
ToolMage
Sign in

AI TOOL COMPARISON

draxlr vs Sequel

What is the difference, and which fits your workflow? Compare features, usage, pricing models and traffic side by side.

Jump to key differences

Product overview

draxlr Product overview

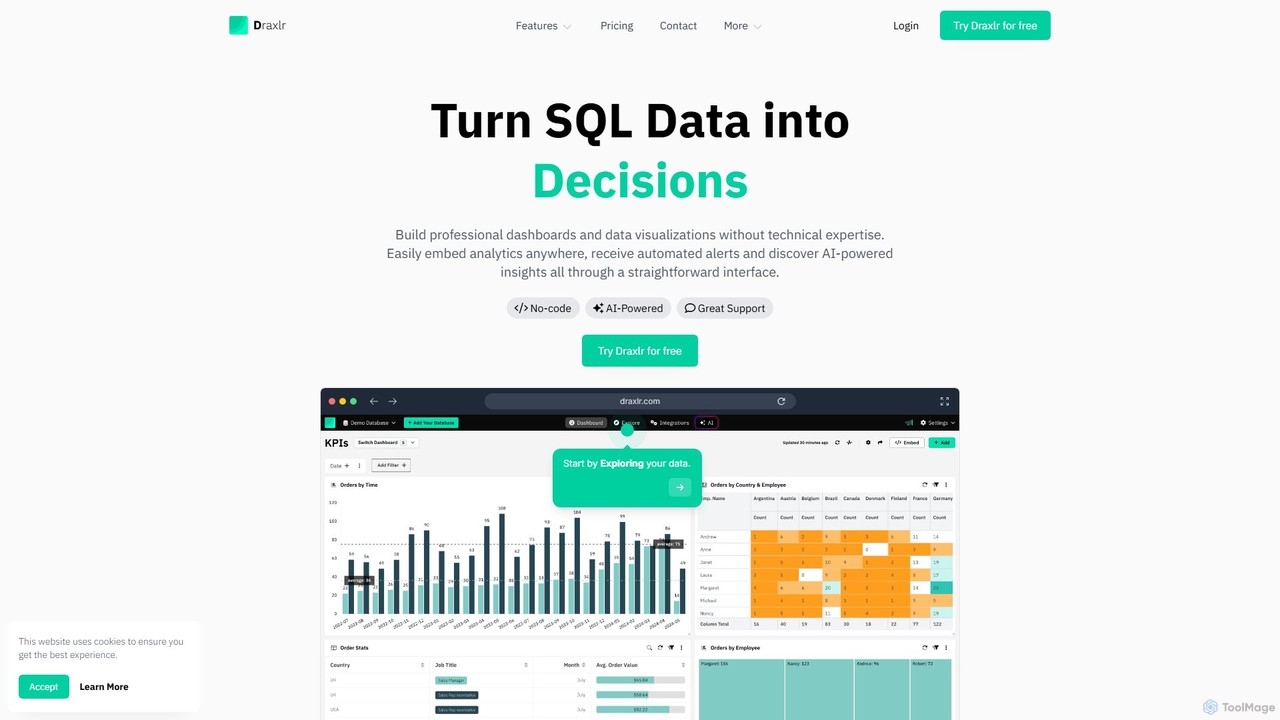
Draxlr is an AI-powered business intelligence platform that enables users to build professional dashboards and data visualizations from SQL databases without technical expertise. It offers a no-code query builder, embeddable analytics, and automated alerts to transform raw data into actionable decisions.

Preview

Sequel Product overview

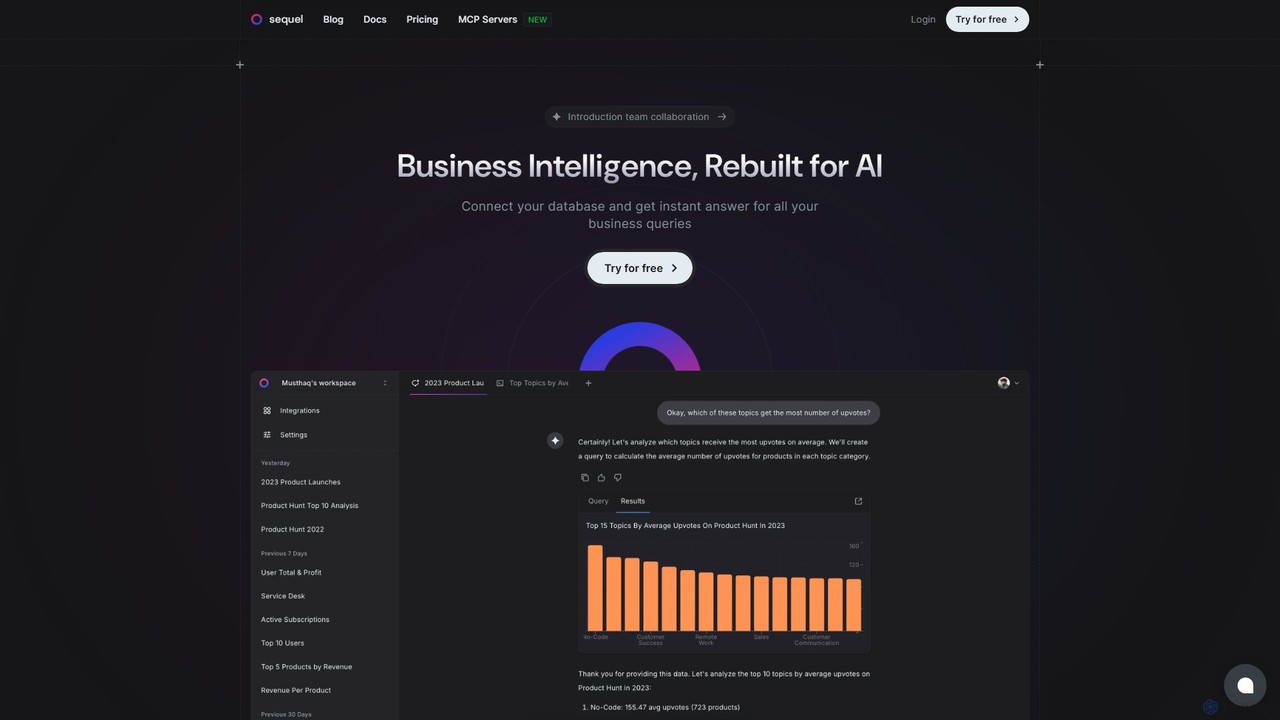
Sequel is an AI-powered Business Intelligence platform that allows you to interact with your databases using natural language. Connect your data, ask questions in plain English, and instantly receive reports, visualizations, and insights without writing a single line of SQL.

Preview

Quick facts

Compare product focus, pricing models and audiences. Highlighted rows indicate different listed information; unknown pricing does not mean free.

draxlr VS Sequel — Quick facts
Quick factsdraxlrSequel
Pricing modelFreemiumFreemium
Product typeWebWeb
Primary focusBusiness IntelligenceBusiness Intelligence
Audience and rolesNo data availableNo data available
CategoriesBusiness Intelligence · Database · Analytics · Data AnalysisBusiness Intelligence · Database · Data Analysis
AddedAug 10, 2025Aug 13, 2025
UpdatedNov 19, 2026Nov 19, 2026

Features, usage and use cases

Explore the listed product descriptions, features and workflows. Taxonomy labels alone are not feature evaluations.

draxlr

Draxlr is a comprehensive, AI-powered business intelligence (BI) and data analytics platform designed to empower teams to make data-driven decisions. It allows users, regardless of their technical background, to connect directly to their SQL databases and transform complex data into clear, interactive, and professional dashboards. The platform's core philosophy is to simplify data access and analysis, eliminating the need for constant developer intervention for reporting tasks.

With a user-friendly, no-code interface, Draxlr enables anyone to build queries, visualize data, and discover insights. It supports a wide array of popular SQL databases, including PostgreSQL, MySQL, BigQuery, Snowflake, Supabase, and many more, ensuring seamless integration with your existing data infrastructure. The platform is built to solve common business challenges, such as freeing up developer resources, providing customers with embedded analytics, and ensuring critical business events are never missed.

How to use draxlr

Using Draxlr is a straightforward, three-step process designed for efficiency and ease of use:

  1. Connect Your Database: Simply sign up for a Draxlr plan, and connect to one or more of your SQL databases. The platform provides secure and easy-to-configure connections. You can also upload data from Excel/CSV files or connect to Airtable.
  2. Build Queries: Utilize the intuitive Visual SQL Query Builder to filter, sort, join, and summarize your data with just a few clicks. For more complex needs, you can switch to the SQL editor. The AI-powered features allow you to ask questions in natural language to get insights from your data.
  3. Build and Share Dashboards: Drag and drop your query results to create beautiful and interactive dashboards. Customize them with various charts, pivot tables, and cards. You can then share these dashboards via secure public links, embed them directly into your application for your customers, or set up scheduled reports via email.

Core Features of draxlr

  • AI-Powered Insights: Use AI Chat to ask questions about your data in plain English and receive instant answers, charts, and insights.
  • Visual SQL Query Builder: A no-code interface that allows non-technical users to build complex queries through clicks, with features like multi-level aggregation, virtual columns, and live data previews.
  • Interactive Dashboards: Create, customize, and share dynamic dashboards with a variety of visualization options, including charts, pivot tables, and compute cards.
  • Embeddable Analytics: Easily embed responsive, white-label dashboards into your own applications, providing valuable analytics to your customers with multi-tenant support.
  • Automated Data Alerts: Set up alerts on your key metrics to receive notifications via Email or Slack when data changes, crosses a specific threshold, or on a schedule.
  • Broad Database Connectivity: Connects to over 10 SQL databases like PostgreSQL, MySQL, Redshift, BigQuery, Snowflake, and more.
  • Query Version Control: Automatically tracks changes to every query, allowing you to review history, compare edits, and revert to previous versions.
  • Data Export and Integration: Export query results to CSV/Excel, and integrate with other tools like Google Sheets and through a dedicated API.

Use Cases for draxlr

Draxlr is versatile and can be used by various teams and industries:

  • Business Teams: Marketing, sales, and operations teams can self-serve their data needs, creating reports and monitoring KPIs without relying on the engineering team.
  • SaaS Companies: Product managers and developers can embed analytics directly into their applications, offering a better user experience and new value to their customers.
  • Developers: Use Draxlr as a powerful SQL client and query builder to speed up development and data exploration tasks.
  • Executives & Managers: Get a high-level overview of business performance through real-time dashboards and receive critical alerts on key business events.

Advantages of draxlr

Draxlr stands out with its modern interface, ease of use, and powerful features. Its primary advantage is democratizing data access, enabling non-technical users to perform complex data analysis. The AI-powered query builder significantly lowers the barrier to entry. The platform's flexibility, with options for cloud or self-hosting, and its robust embedding capabilities make it a scalable solution for businesses of all sizes. Excellent customer support is frequently highlighted by users as a key benefit.

Pricing and Plans

Draxlr offers a flexible pricing structure with a 14-day free trial of the Power plan (no credit card required).

  • Premium Plan: $75/month. Includes 2 databases, 20 users, and 100 AI credits/month.
  • Power Plan: $125/month. Includes 5 databases, 50 users, 300 AI credits/month, and more frequent alert scheduling (from 15 mins).
  • Custom Plan: Custom pricing for larger enterprises, offering features like Single Sign-On (SSO), audit logs, and custom development.
  • Self-Host Plan: Starts at $500/month (billed annually). Allows you to run Draxlr on your own servers for full data control.
  • Add-ons: Extra AI Credits can be purchased at $10/month for 100 credits.

Sequel

Sequel is a revolutionary Business Intelligence (BI) platform designed to democratize data access for teams of all sizes. It addresses the common frustration of slow, cumbersome reporting processes by enabling users to query their databases using simple, natural language. Instead of waiting for technical teams to write complex SQL scripts, you can ask questions directly and get immediate, actionable answers. This transforms data from a bottleneck into a real-time asset, empowering confident, insight-driven decision-making.

The platform is built around an intelligent AI that understands the nuances of your database schema. This allows it to accurately translate your plain-language questions into the correct queries, retrieve the relevant data, and present it in an easily digestible format. Whether you need a quick statistic, a detailed report, or a visual chart, Sequel delivers it on the fly. It's a game-changer for business users who need data independence and for data professionals looking to reduce their backlog of ad-hoc requests.

How to use Sequel

Getting started with Sequel is a straightforward process designed to get you to your insights as quickly as possible:

  1. Sign Up: Create a free account on the Sequel website using your email or a social login.
  2. Connect Your Database: Once logged into your dashboard, connect to your existing database. Sequel supports a wide range of databases and services, including PostgreSQL, MySQL, ClickHouse, Snowflake, BigQuery, Supabase, AWS, and more. The connection process is secure and intuitive.
  3. Chat with Your Data: Use the chat-based interface to ask questions in natural language. For example, you could ask, "What were our total sales last quarter by region?" or "Show me a bar chart of new user sign-ups per day this month."
  4. Generate and Visualize: Sequel will instantly process your request, query the database, and return the answer. This can be in the form of a direct answer, a structured report, or a dynamic chart or graph.
  5. (Optional) Use the SQL Editor: For power users and data analysts who prefer to write their own queries, Sequel includes a full-featured SQL editor. This provides the flexibility to perform highly complex analyses while still benefiting from Sequel's collaborative environment.

Core Features of Sequel

  • Natural Language Querying: Interact with your database using a chat interface. Ask questions in plain English and get instant answers.
  • Automatic Report Generation: Create comprehensive reports across your entire database without any SQL knowledge.
  • Dynamic Data Visualization: Instantly generate various charts and graphs (bar charts, line graphs, etc.) simply by asking.
  • AI-Powered Insights: The AI can analyze your data to provide proactive suggestions, identify trends, and uncover hidden insights you might have missed.
  • Intelligent Schema Understanding: The AI automatically learns and understands your database structure, ensuring accurate query mapping and results.
  • Broad Database Support: Extensive connectivity with popular SQL databases, data warehouses, and cloud database providers.
  • Integrated SQL Editor: A powerful tool for SQL experts to write, run, and manage their own queries within the platform.
  • Team Collaboration: Share insights and reports easily with your team, fostering a data-driven culture.

Use Cases for Sequel

Sequel is versatile and valuable for various roles and departments:

  • Business Teams (Sales, Marketing, Operations): Non-technical users can self-serve their data needs, tracking KPIs, analyzing campaign performance, or monitoring operational metrics without relying on the data team.
  • Product Managers: Analyze user behavior, track feature adoption, and query product data to inform roadmap decisions.
  • Founders and Executives: Gain a high-level, real-time overview of business performance by asking critical questions on the go.
  • Data Analysts and Engineers: Accelerate their workflow by using natural language for routine queries and the SQL editor for complex tasks. This frees them up to focus on more strategic data initiatives.

Advantages of Sequel

Sequel offers a significant competitive edge by being faster, more intuitive, and more powerful than many alternatives. Users praise its ability to instantly understand complex data structures without manual training. Key advantages include:

  • Speed: Eliminates the long wait times associated with traditional reporting cycles.
  • Accessibility: Makes data analysis accessible to everyone in the organization, regardless of their technical skill level.
  • Efficiency: Frees up valuable time for both data consumers and data professionals.
  • Accuracy: The smart AI ensures that natural language queries are translated into accurate and effective SQL.
  • Flexibility: Seamlessly serves both non-technical users with its chat interface and technical users with its robust SQL editor.

Pricing and Plans

Sequel offers a flexible pricing structure to suit different needs, including a free-to-start option.

  • Free Plan: $0. Includes 1 database connection, 1 user, and 50 AI queries per month. Ideal for individuals and small projects.
  • Professional Plan: $19 per user/month. Includes 10 databases, 1 user (with options to add more), 1000 AI queries per user/month, and access to premium integrations. An AI Slack Bot is also a planned feature for this tier.
  • Team Plan: Custom pricing. Offers unlimited databases, users, and AI queries, along with all premium features. Designed for larger teams and enterprises.
  • Self-Hosted Plan: Custom pricing. For organizations that require hosting Sequel within their own cloud or on-premises infrastructure for maximum control and security.

Positioning

Their taxonomy shows where the products overlap and where each one has a more distinct focus. Unknown fields are shown explicitly and are never filled with assumptions.

Categories

Shared
Business IntelligenceDatabaseData Analysis
Only draxlr
Analytics
Only Sequel
No listed items

Tags

Shared
business intelligencedatabasedata visualizationno-codereportingSQL
Only draxlr
AI querydashboarddata alertsembedded analytics
Only Sequel
AI chatbotdata analysisnatural language query

Audience and roles

Shared
No listed items
Only draxlr
No listed items
Only Sequel
No listed items

Traffic comparison

Traffic is shown on the same scale so differences in market visibility are not visually understated.

How to interpret the traffic data

Both charts share the same months and vertical scale. Each tool identifies its latest reporting month; missing months are left blank, not counted as zero. Regional and source visit counts are estimates calculated from the reported shares.

draxlr monthly traffic:

Latest traffic · 2026-05

Monthly visits
37.4K
Avg. visit duration
0:13
Pages per visit
1.76
Bounce rate
38.15%
Data updated 2026-06-15

Monthly traffic trend

  • 2025-09: 263.8K
  • 2026-01: 198.6K
  • 2026-02: 166.4K
  • 2026-03: 157.5K
  • 2026-04: 85.9K
  • 2026-05: 37.4K

Top regions

Top 5 countries/regions
Country/regionPercentageEstimated visits
🇺🇸United States34.46%12.9K
🇻🇳Vietnam18.53%6.9K
🇮🇳India16.78%6.3K
🇸🇻El Salvador16.65%6.2K
🇷🇺Russia13.58%5.1K

Search keywords

draxlr bar chartneondbradar chart makersql query generatorwhich one is better for ui charts or dashboard apart from superset

Sequel monthly traffic:

Latest traffic · 2026-05

Monthly visits
6.4K
Avg. visit duration
0:17
Pages per visit
1.71
Bounce rate
38.78%
Data updated 2026-06-15

Monthly traffic trend

  • 2025-09: 12.9K
  • 2026-01: 17.3K
  • 2026-02: 10.1K
  • 2026-03: 11.2K
  • 2026-04: 8.5K
  • 2026-05: 6.4K

Top regions

Top 5 countries/regions
Country/regionPercentageEstimated visits
🇮🇳India36.37%2.3K
🇻🇳Vietnam32.71%2.1K
🇺🇸United States21.34%1.4K
🇹🇷Turkey9.58%618

Search keywords

bigquerry standrd sql formatcodex mysql connectsequel databasesequel db"snowflake" sql-formatter

Community signals

Ratings, comments, favorites, and likes are community signals—not a substitute for product fit.

draxlr

Rating
No data available
Comments
0
Favorites
158
Likes
153

Sequel

Rating
No data available
Comments
0
Favorites
166
Likes
182

draxlr vs Sequel · Comparison FAQ

What do draxlr and Sequel have in common?
Both tools are listed under Business Intelligence、Database、Data Analysis. These categories indicate overlapping use cases; compare their detailed descriptions for workflows, capabilities and limitations.
Are draxlr and Sequel free?
Listed pricing models: draxlr — Freemium; Sequel — Freemium. Missing pricing is not proof of a free plan, and freemium does not mean every feature is free. Check official sites for current plans, limits and trials.
How should I choose between draxlr and Sequel?
The primary listed category is Business Intelligence for draxlr, and Business Intelligence for Sequel. Compare features, steps and use cases, then verify pricing, data permissions and deployment needs. This page does not include hands-on testing and does not declare a winner from traffic or tags.

Sources and comparison methodology

This page is assembled from ToolMage product listings, taxonomy, traffic statistics and on-site user feedback. It is not a hands-on test or an independent review.

  • Feature and plan descriptions reflect information in the listings, not real-time guarantees. Verify pricing, quotas, availability and privacy terms on the official sites.
  • Traffic uses the reporting months shown. Missing statistics do not mean zero visits, and different periods do not establish growth or superiority. Regional and source visit counts are estimates based on shares.
  • Different tags indicate differences in the listings, not proof that the other product lacks a capability. Ratings, favorites and visits are not used to declare a winner.

Related comparisons