
Querio
Business Intelligence
AI TOOL COMPARISON
What is the difference, and which fits your workflow? Compare features, usage, pricing models and traffic side by side.
Business Intelligence
Business Intelligence
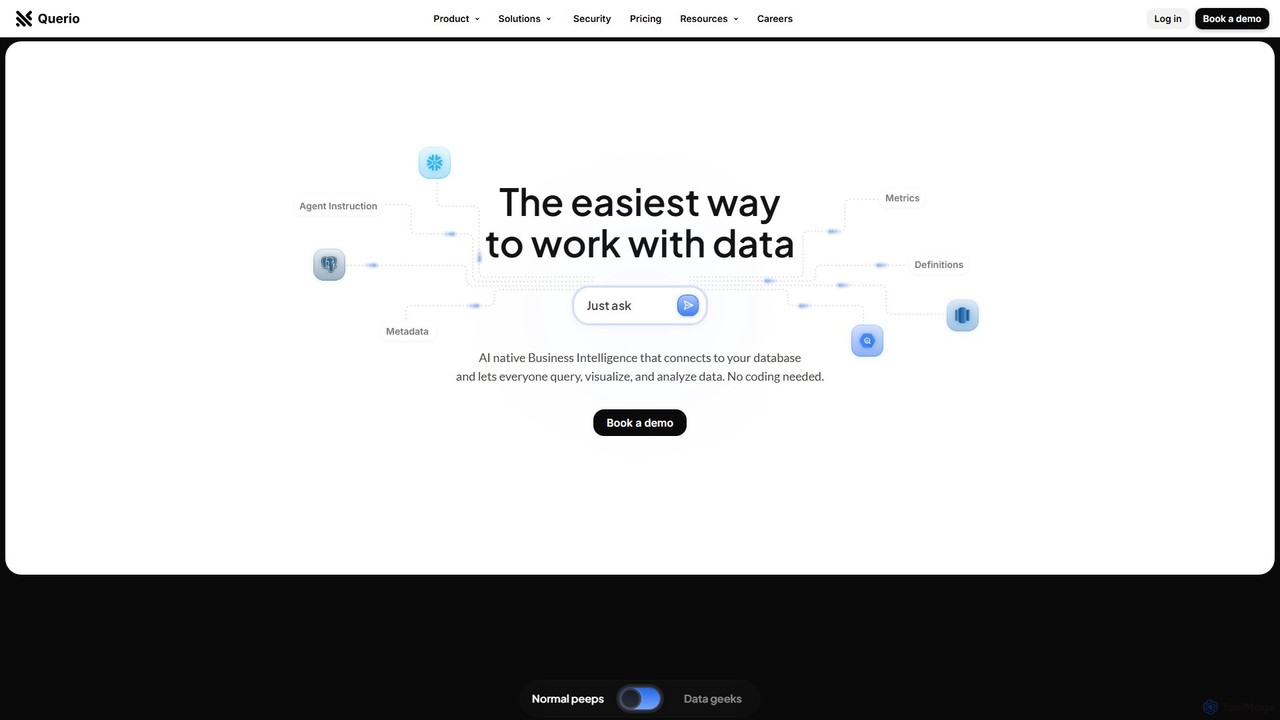
Querio is an AI-native Business Intelligence (BI) platform that allows teams to analyze their data using natural language. Connect directly to your database and ask questions to generate queries, visualizations, and reports without writing any code. It's designed for both technical and non-technical users to make data-driven decisions quickly.
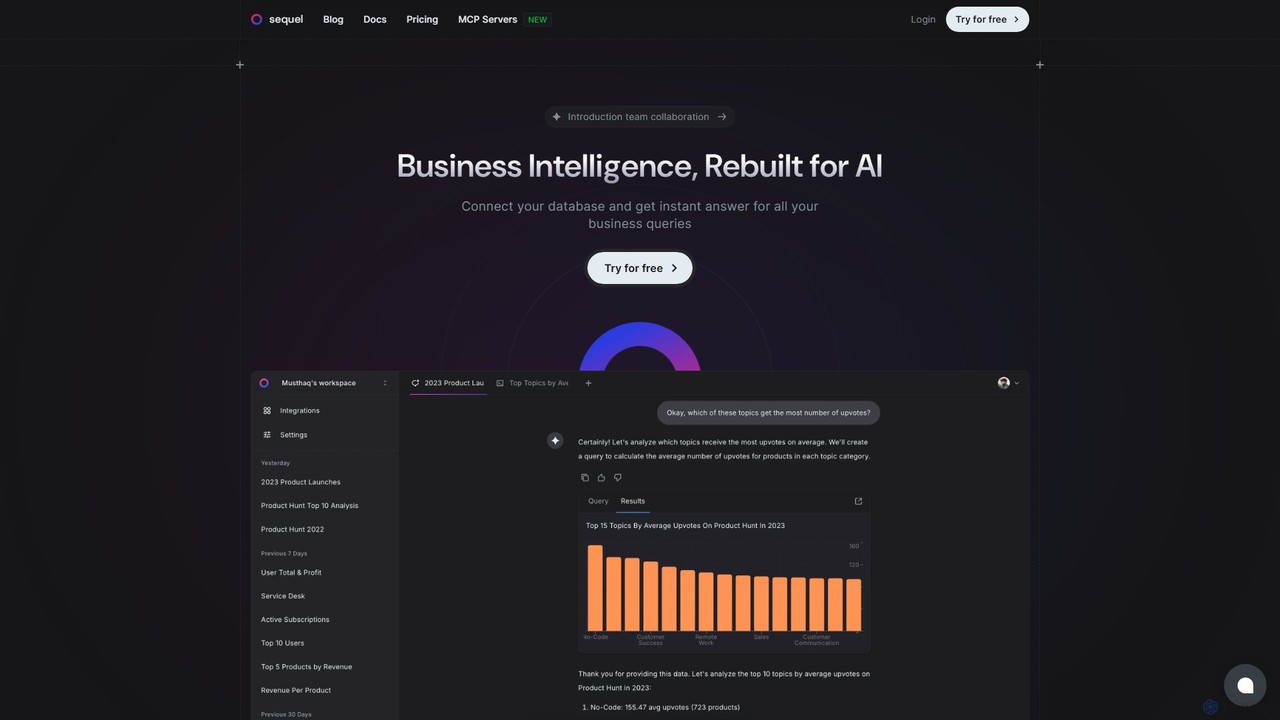
Sequel is an AI-powered Business Intelligence platform that allows you to interact with your databases using natural language. Connect your data, ask questions in plain English, and instantly receive reports, visualizations, and insights without writing a single line of SQL.
Compare product focus, pricing models and audiences. Highlighted rows indicate different listed information; unknown pricing does not mean free.
| Quick facts | Querio | Sequel |
|---|---|---|
| Pricing model | Freemium | Freemium |
| Product type | Web | Web |
| Primary focus | Business Intelligence | Business Intelligence |
| Audience and roles | No data available | No data available |
| Categories | Business Intelligence · Database · Data Analysis | Business Intelligence · Database · Data Analysis |
| Added | Aug 16, 2025 | Aug 13, 2025 |
| Updated | Nov 19, 2026 | Nov 19, 2026 |
Explore the listed product descriptions, features and workflows. Taxonomy labels alone are not feature evaluations.
Querio is a revolutionary AI-native Business Intelligence (BI) platform designed to democratize data access across organizations. It empowers every team member, regardless of their technical expertise, to interact with, analyze, and visualize complex data simply by asking questions in natural language. By connecting securely and directly to your existing databases, Querio eliminates the traditional barriers of complex query languages like SQL and the reliance on dedicated data teams for routine reports. The platform's intelligent AI agents learn the context of your data, enabling them to provide accurate, relevant answers and insights, transforming raw data into actionable intelligence.
Using Querio is an intuitive process designed for speed and efficiency:
Querio is versatile and benefits various teams within an organization:
Querio offers a significant competitive edge:
Querio offers a structured pricing model with a mandatory 1-month free guided pilot for all plans to ensure value before commitment.
Sequel is a revolutionary Business Intelligence (BI) platform designed to democratize data access for teams of all sizes. It addresses the common frustration of slow, cumbersome reporting processes by enabling users to query their databases using simple, natural language. Instead of waiting for technical teams to write complex SQL scripts, you can ask questions directly and get immediate, actionable answers. This transforms data from a bottleneck into a real-time asset, empowering confident, insight-driven decision-making.
The platform is built around an intelligent AI that understands the nuances of your database schema. This allows it to accurately translate your plain-language questions into the correct queries, retrieve the relevant data, and present it in an easily digestible format. Whether you need a quick statistic, a detailed report, or a visual chart, Sequel delivers it on the fly. It's a game-changer for business users who need data independence and for data professionals looking to reduce their backlog of ad-hoc requests.
Getting started with Sequel is a straightforward process designed to get you to your insights as quickly as possible:
Sequel is versatile and valuable for various roles and departments:
Sequel offers a significant competitive edge by being faster, more intuitive, and more powerful than many alternatives. Users praise its ability to instantly understand complex data structures without manual training. Key advantages include:
Sequel offers a flexible pricing structure to suit different needs, including a free-to-start option.
Their taxonomy shows where the products overlap and where each one has a more distinct focus. Unknown fields are shown explicitly and are never filled with assumptions.
Traffic is shown on the same scale so differences in market visibility are not visually understated.
Both charts share the same months and vertical scale. Each tool identifies its latest reporting month; missing months are left blank, not counted as zero. Regional and source visit counts are estimates calculated from the reported shares.
| Country/region | Percentage | Estimated visits |
|---|---|---|
| 🇺🇸United States | 51.57% | 25.2K |
| 🇧🇷Brazil | 14.07% | 6.9K |
| 🇻🇳Vietnam | 13.42% | 6.6K |
| 🇮🇳India | 10.6% | 5.2K |
| 🇬🇧United Kingdom | 10.34% | 5.1K |
| Source type | Percentage | Estimated visits |
|---|---|---|
| Direct | 81.82% | 40K |
| Referral | 18.18% | 8.9K |
| Country/region | Percentage | Estimated visits |
|---|---|---|
| 🇮🇳India | 36.37% | 2.3K |
| 🇻🇳Vietnam | 32.71% | 2.1K |
| 🇺🇸United States | 21.34% | 1.4K |
| 🇹🇷Turkey | 9.58% | 618 |
Ratings, comments, favorites, and likes are community signals—not a substitute for product fit.
This page is assembled from ToolMage product listings, taxonomy, traffic statistics and on-site user feedback. It is not a hands-on test or an independent review.