
ToolMage
Sign in

AI TOOL COMPARISON

Querio vs QueryHub

What is the difference, and which fits your workflow? Compare features, usage, pricing models and traffic side by side.

Jump to key differences

Product overview

Querio Product overview

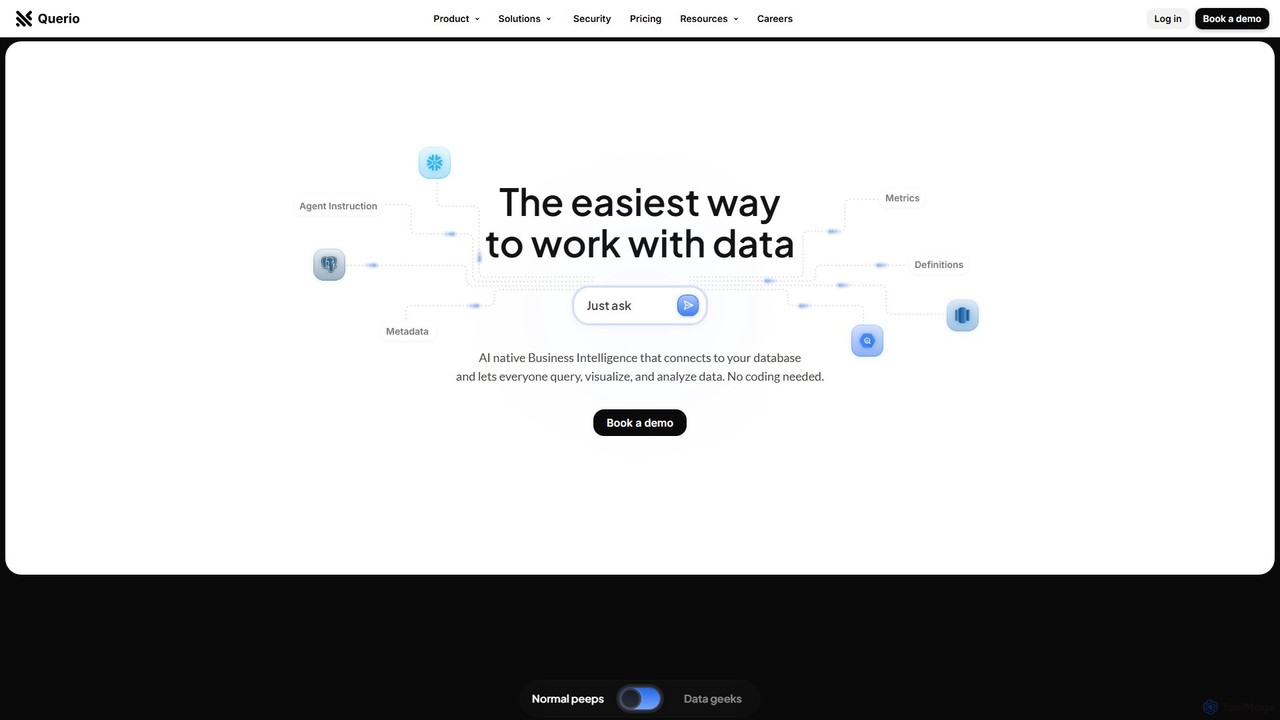
Querio is an AI-native Business Intelligence (BI) platform that allows teams to analyze their data using natural language. Connect directly to your database and ask questions to generate queries, visualizations, and reports without writing any code. It's designed for both technical and non-technical users to make data-driven decisions quickly.

Preview

QueryHub Product overview

QueryHub is an AI-powered business intelligence platform that allows users to query their data using natural language. Connect to various data sources, ask complex questions in plain English, and instantly receive answers, visualizations, and reports. It democratizes data analysis, making it accessible to non-technical team members.

Preview

Quick facts

Compare product focus, pricing models and audiences. Highlighted rows indicate different listed information; unknown pricing does not mean free.

Querio VS QueryHub — Quick facts
Quick factsQuerioQueryHub
Pricing modelFreemiumFreemium
Product typeWebWeb
Primary focusBusiness IntelligenceBusiness Intelligence
Audience and rolesNo data availableNo data available
CategoriesBusiness Intelligence · Database · Data AnalysisBusiness Intelligence · Database · Analytics · Data Analysis
AddedAug 16, 2025Aug 3, 2025
UpdatedNov 19, 2026Nov 19, 2026

Features, usage and use cases

Explore the listed product descriptions, features and workflows. Taxonomy labels alone are not feature evaluations.

Querio

Querio is a revolutionary AI-native Business Intelligence (BI) platform designed to democratize data access across organizations. It empowers every team member, regardless of their technical expertise, to interact with, analyze, and visualize complex data simply by asking questions in natural language. By connecting securely and directly to your existing databases, Querio eliminates the traditional barriers of complex query languages like SQL and the reliance on dedicated data teams for routine reports. The platform's intelligent AI agents learn the context of your data, enabling them to provide accurate, relevant answers and insights, transforming raw data into actionable intelligence.

How to use Querio

Using Querio is an intuitive process designed for speed and efficiency:

  1. Connect Your Data Source: Securely connect Querio to your production databases. The platform supports various integrations, ensuring a seamless setup without the need for data migration.
  2. Let AI Learn Your Context: Querio's AI agents analyze your database schema and metadata. You can provide additional custom context to ensure the AI understands your business logic, metrics, and definitions perfectly.
  3. Ask Questions in Natural Language: Simply type your questions into the prompt interface, just as you would ask a colleague. For example, "What were our top 10 selling products in the last quarter?" or "Show me the user retention rate by cohort for the past 6 months."
  4. Analyze and Drill Down: Querio doesn't just provide a single answer. It allows you to ask follow-up questions to drill down into specifics, helping you understand the 'why' behind the data, not just the 'what'.
  5. Visualize and Report: Instantly generate dynamic dashboards and professional reports from your queries. Track your KPIs, filter data on the fly, and share insights with your team to foster a data-driven culture.

Core Features of Querio

  • AI-Powered Natural Language Querying: The core of Querio, allowing users to query databases using plain English, eliminating the need for SQL or coding knowledge.
  • Intelligent AI Agents: These agents learn your unique data structure and business context to provide highly accurate and relevant answers.
  • Dynamic Dashboards and Reporting: Create, customize, and share interactive dashboards and reports to track key metrics and present data professionally.
  • Follow-up Question Capability: Engage in a conversational analysis by asking follow-up questions to explore data more deeply and uncover root causes.
  • Direct & Secure Database Integrations: Connects directly to your data where it lives, ensuring security and real-time analysis without data duplication. Supports SOC 2 Type II compliance for enterprise needs.
  • Collaborative Environment: Empowers teams like Product, Finance, Operations, and Data to become self-sufficient in their data needs, fostering better collaboration and faster decision-making.
  • Custom LLM Choices (Enterprise): Enterprise clients can choose custom Large Language Models and opt for self-hosted deployments for maximum control and security.

Use Cases for Querio

Querio is versatile and benefits various teams within an organization:

  • Product Teams: Can analyze user behavior, track feature adoption, and measure the impact of new releases without waiting for the data team.
  • Finance Teams: Can monitor financial KPIs, analyze revenue trends, and generate financial reports on-demand.
  • Operations Teams: Can track operational efficiency, monitor supply chains, and identify bottlenecks in real-time.
  • Marketing Teams: Can analyze campaign performance, track customer acquisition cost (CAC), and understand customer lifetime value (LTV).
  • Executive Leadership: Can get a high-level overview of business performance through customized dashboards and by asking strategic questions directly.

Advantages of Querio

Querio offers a significant competitive edge:

  • Democratization of Data: Makes data accessible and actionable for everyone, not just data experts.
  • Increased Efficiency: Drastically reduces the time from question to insight, from weeks to minutes.
  • Reduced Engineering Load: Frees up data and engineering teams from handling ad-hoc query requests, allowing them to focus on more strategic initiatives.
  • Enhanced Data Literacy: Empowers employees to make informed, data-driven decisions independently, fostering a stronger data culture.
  • Security and Trust: With direct connections and enterprise-grade security features, your data remains safe and under your control.

Pricing and Plans

Querio offers a structured pricing model with a mandatory 1-month free guided pilot for all plans to ensure value before commitment.

  • Standard Plan: Starting at $1100/month. Ideal for growing teams. Includes 1 production database, 1000 prompts, and Slack support.
  • Pro Plan: Starting from $2000/month. Designed for data-driven organizations. Includes everything in Standard, plus up to 3 databases, 4500 prompts, priority support, and dashboard migration.
  • Enterprise Plan: Custom pricing. For large-scale or regulated operations. Includes everything in Pro, plus self-hosting options, SCIM, 24/7 SRE support, SOC 2 Type II audit report, and custom LLM choices.
  • Startup Program: A special program is available for startups that have raised less than $3 million.

QueryHub

QueryHub is a revolutionary conversational analytics platform designed to bridge the gap between complex data and business decision-makers. In today's data-driven world, accessing timely insights is crucial, but it often requires specialized skills like SQL or reliance on overloaded data teams. QueryHub eliminates this bottleneck by empowering anyone in an organization to explore data and get answers simply by asking questions in natural language.

The platform securely integrates with a wide array of data sources, from modern cloud data warehouses to simple spreadsheets. Once connected, its advanced AI engine interprets the user's intent, translates the natural language query into the appropriate database language (like SQL), executes the query, and returns the results in an easily digestible format. This process, which traditionally could take hours or days, is completed in seconds. QueryHub is not just a query tool; it's a comprehensive hub for collaborative data exploration and insight generation.

How to use QueryHub

Using QueryHub is designed to be an intuitive, conversational experience:

  1. Connect Your Data Sources: Start by securely connecting QueryHub to your databases (e.g., PostgreSQL, MySQL, Snowflake, BigQuery), data warehouses, or even flat files like CSVs and Google Sheets. The onboarding process is guided and secure.
  2. Ask a Question: In the main interface, simply type your question into the query bar as if you were asking a colleague. For example: "What were our top 5 selling products in Europe last quarter?" or "Show me the monthly user growth rate for the past year."
  3. Get Instant AI-Powered Answers: The AI engine instantly processes your request. It identifies the relevant tables, generates the correct SQL query behind the scenes, and fetches the data.
  4. Visualize and Explore: The results are automatically presented in the most suitable format, whether it's a table, a bar chart, a line graph, or a map. You can easily switch between visualization types to explore the data from different angles.
  5. Build and Share Dashboards: Save your most important queries and visualizations to create interactive dashboards. Share these dashboards with your team via a link or schedule regular email reports to keep everyone informed.

Core Features of QueryHub

  • Natural Language to SQL (Text-to-SQL): The core engine that translates plain English questions into complex SQL queries automatically.
  • Broad Data Source Integration: Connects to dozens of popular SQL/NoSQL databases, data warehouses, and business applications.
  • Automated Data Visualization: Intelligently selects the best chart or graph to represent your query results, with options for customization.
  • Interactive Dashboards: Drag-and-drop interface to build real-time, shareable dashboards that consolidate key metrics.
  • Collaborative Workspaces: Share insights, comment on charts, and work together with your team within the platform.
  • Scheduled Reporting and Alerts: Automate the delivery of key reports to your inbox and set up alerts for when specific metrics cross a threshold.
  • Data Governance and Security: Enterprise-grade security features, including role-based access control and audit logs, to ensure your data is always safe.
  • AI-Powered Suggestions: The platform can suggest relevant follow-up questions to help you dig deeper into your data.

Use Cases for QueryHub

QueryHub is versatile and can be used across various departments:

  • Marketing Teams: Analyze campaign ROI, track customer acquisition cost (CAC), segment users based on behavior, and measure website traffic trends without writing a single line of code.
  • Sales Teams: Monitor sales performance against quotas, forecast revenue, identify top-performing regions or sales reps, and analyze the sales funnel.
  • Product Managers: Understand feature adoption rates, track user engagement metrics, analyze user feedback, and make data-informed decisions for the product roadmap.
  • Operations & Finance: Track key performance indicators (KPIs), monitor operational costs, analyze financial statements, and build comprehensive business performance dashboards.
  • Executives: Get a high-level, real-time overview of the entire business's health without needing to sift through complex spreadsheets or wait for manual reports.

Advantages of QueryHub

The primary advantage of QueryHub is its ability to foster a data-driven culture by removing technical barriers. Key benefits include:

  • Democratization of Data: Empowers non-technical users (in marketing, sales, HR, etc.) to self-serve their data needs.
  • Increased Efficiency: Frees up data analysts and engineers from handling routine data requests, allowing them to focus on more strategic initiatives.
  • Speed to Insight: Reduces the time from question to answer from days to seconds, enabling faster and more agile decision-making.
  • Reduced Costs: Lowers the need for extensive training or hiring specialized BI developers for many analytical tasks.
  • Improved Collaboration: A central hub for data insights ensures that everyone on the team is working from the same information.

Pricing and Plans

QueryHub typically offers a tiered pricing model to suit different needs, from individuals to large enterprises. While specific pricing should be confirmed on the official website, the plans generally follow this structure:

  • Free Plan: Ideal for individuals or small teams getting started. It usually includes a limited number of users, basic data connectors, and a cap on the number of queries per month.
  • Pro Plan: Designed for growing businesses. This plan typically offers more users, access to premium data connectors, unlimited queries, and advanced dashboarding features.
  • Enterprise Plan: A custom solution for large organizations. It includes all Pro features plus advanced security (like SSO), data governance controls, dedicated support, and custom integrations.

Please visit the official QueryHub website for the most current and detailed pricing information.

Positioning

Their taxonomy shows where the products overlap and where each one has a more distinct focus. Unknown fields are shown explicitly and are never filled with assumptions.

Categories

Shared
Business IntelligenceDatabaseData Analysis
Only Querio
No listed items
Only QueryHub
Analytics

Tags

Shared
business intelligencedashboarddata analysisdatabasedata visualizationnatural language queryreporting
Only Querio
AI analyticsno-code
Only QueryHub
analyticsconversational AItext to sql

Audience and roles

Shared
No listed items
Only Querio
No listed items
Only QueryHub
No listed items

Traffic comparison

Traffic is shown on the same scale so differences in market visibility are not visually understated.

How to interpret the traffic data

Both charts share the same months and vertical scale. Each tool identifies its latest reporting month; missing months are left blank, not counted as zero. Regional and source visit counts are estimates calculated from the reported shares.

Querio monthly traffic:

Latest traffic · 2026-05

Monthly visits
48.9K
Avg. visit duration
0:26
Pages per visit
2.03
Bounce rate
39.19%
Data updated 2026-06-15

Monthly traffic trend

  • 2025-09: 17.1K
  • 2026-01: 23.3K
  • 2026-02: 21.4K
  • 2026-03: 27.9K
  • 2026-04: 44.1K
  • 2026-05: 48.9K

Top regions

Top 5 countries/regions
Country/regionPercentageEstimated visits
🇺🇸United States51.57%25.2K
🇧🇷Brazil14.07%6.9K
🇻🇳Vietnam13.42%6.6K
🇮🇳India10.6%5.2K
🇬🇧United Kingdom10.34%5.1K

Traffic sources

Source typePercentageEstimated visits
Direct81.82%40K
Referral18.18%8.9K

Search keywords

bar graph vs histogram difference and how to identify'chat gpt logochatgpt logointeractive data visualization, good examplesjuliuis ai pro monthly

QueryHub

No data available

Community signals

Ratings, comments, favorites, and likes are community signals—not a substitute for product fit.

Querio

Rating
No data available
Comments
0
Favorites
182
Likes
183

QueryHub

Rating
No data available
Comments
0
Favorites
180
Likes
193

Querio vs QueryHub · Comparison FAQ

What do Querio and QueryHub have in common?
Both tools are listed under Business Intelligence、Database、Data Analysis. These categories indicate overlapping use cases; compare their detailed descriptions for workflows, capabilities and limitations.
Are Querio and QueryHub free?
Listed pricing models: Querio — Freemium; QueryHub — Freemium. Missing pricing is not proof of a free plan, and freemium does not mean every feature is free. Check official sites for current plans, limits and trials.
How should I choose between Querio and QueryHub?
The primary listed category is Business Intelligence for Querio, and Business Intelligence for QueryHub. Compare features, steps and use cases, then verify pricing, data permissions and deployment needs. This page does not include hands-on testing and does not declare a winner from traffic or tags.

Sources and comparison methodology

This page is assembled from ToolMage product listings, taxonomy, traffic statistics and on-site user feedback. It is not a hands-on test or an independent review.

  • Feature and plan descriptions reflect information in the listings, not real-time guarantees. Verify pricing, quotas, availability and privacy terms on the official sites.
  • Traffic uses the reporting months shown. Missing statistics do not mean zero visits, and different periods do not establish growth or superiority. Regional and source visit counts are estimates based on shares.
  • Different tags indicate differences in the listings, not proof that the other product lacks a capability. Ratings, favorites and visits are not used to declare a winner.

Related comparisons