
Haystack
Business Intelligence
AI TOOL COMPARISON
What is the difference, and which fits your workflow? Compare features, usage, pricing models and traffic side by side.
Business Intelligence
Business Intelligence
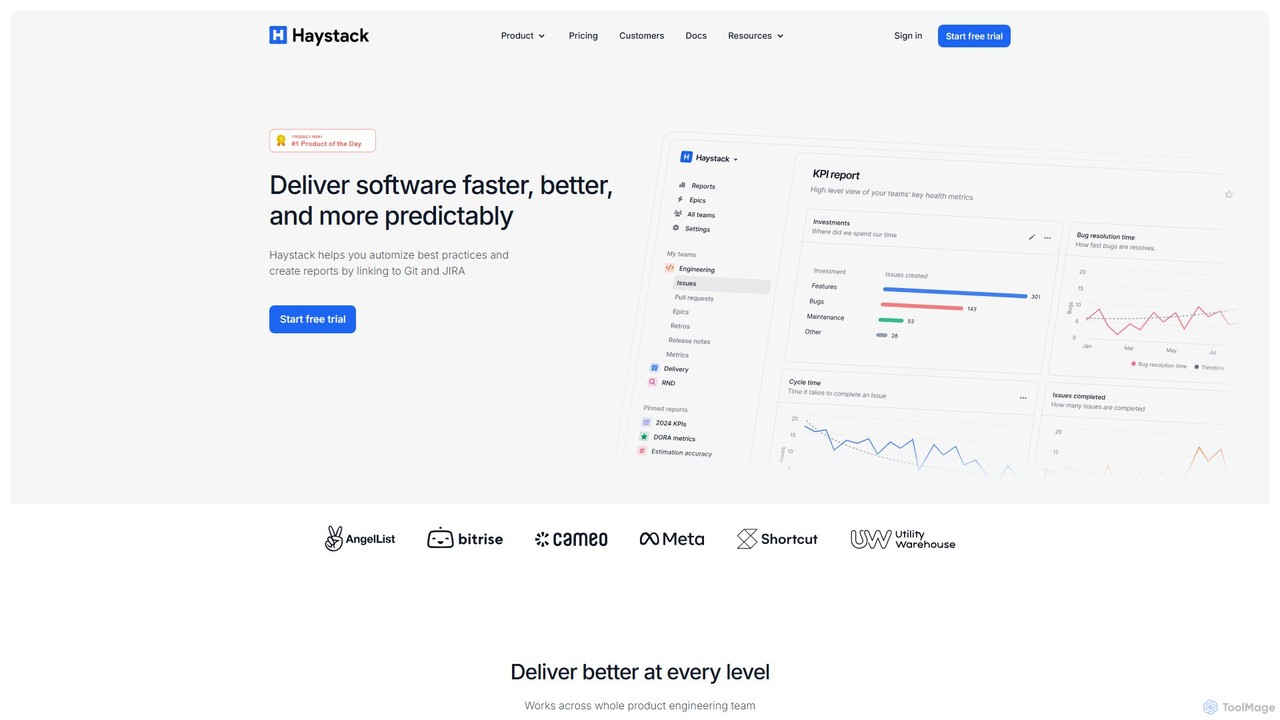
Haystack is an engineering intelligence platform that provides actionable insights for product and engineering leaders. It helps teams improve their software delivery lifecycle by tracking DORA metrics, cycle time, and other key performance indicators. By analyzing data from Git and project management tools, Haystack identifies bottlenecks, automates reporting, and fosters a culture of transparency and continuous improvement, ultimately accelerating time-to-market.
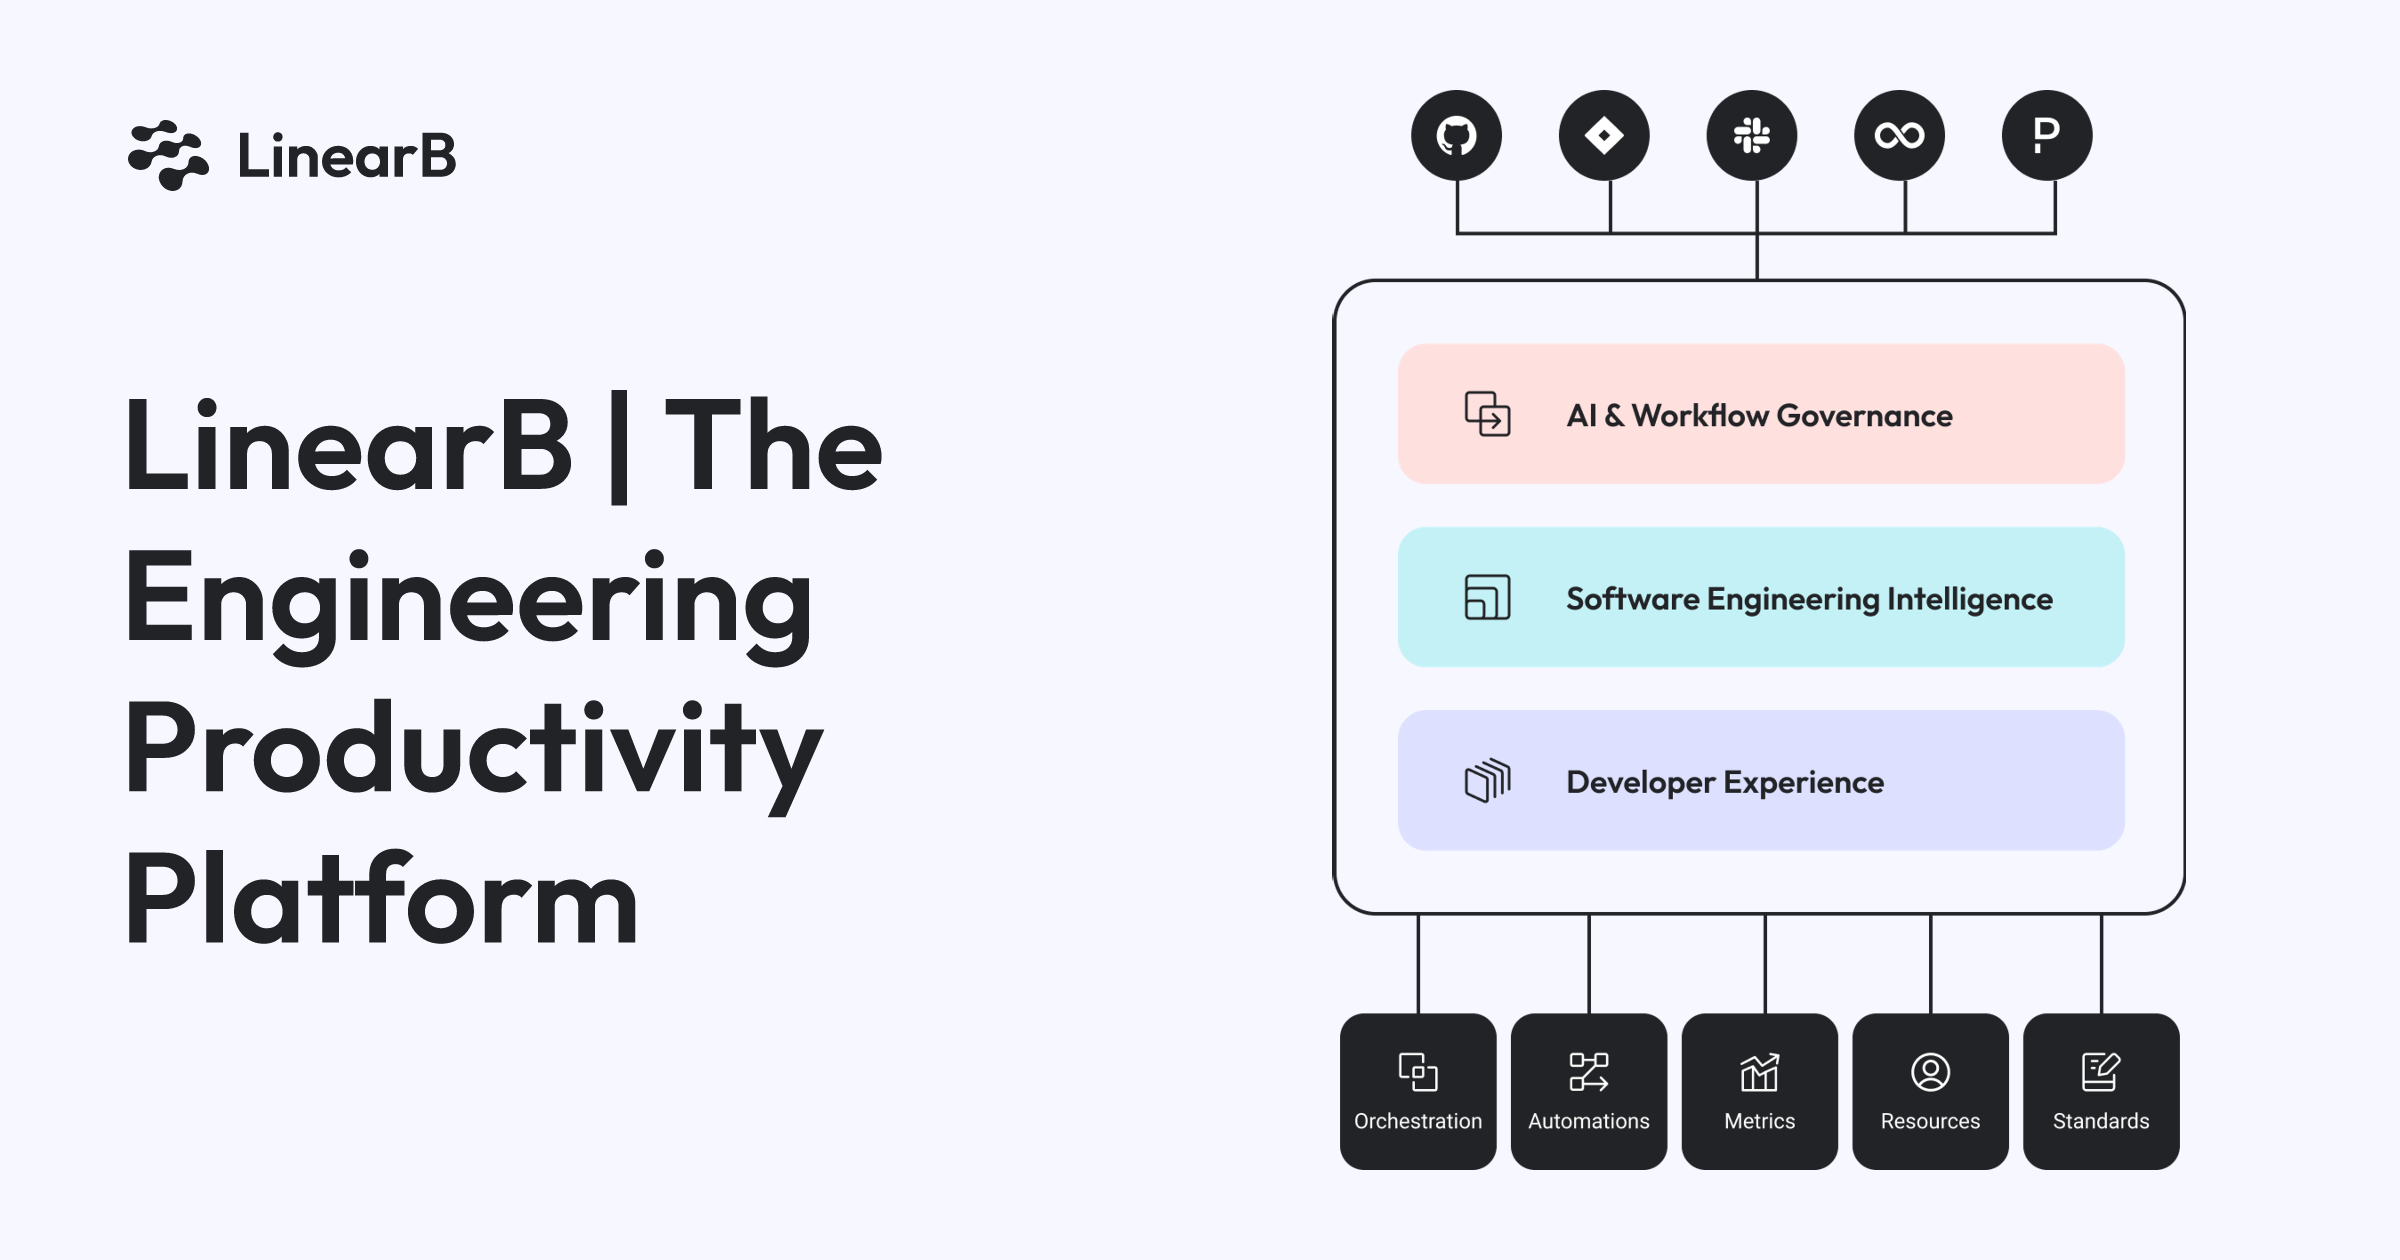
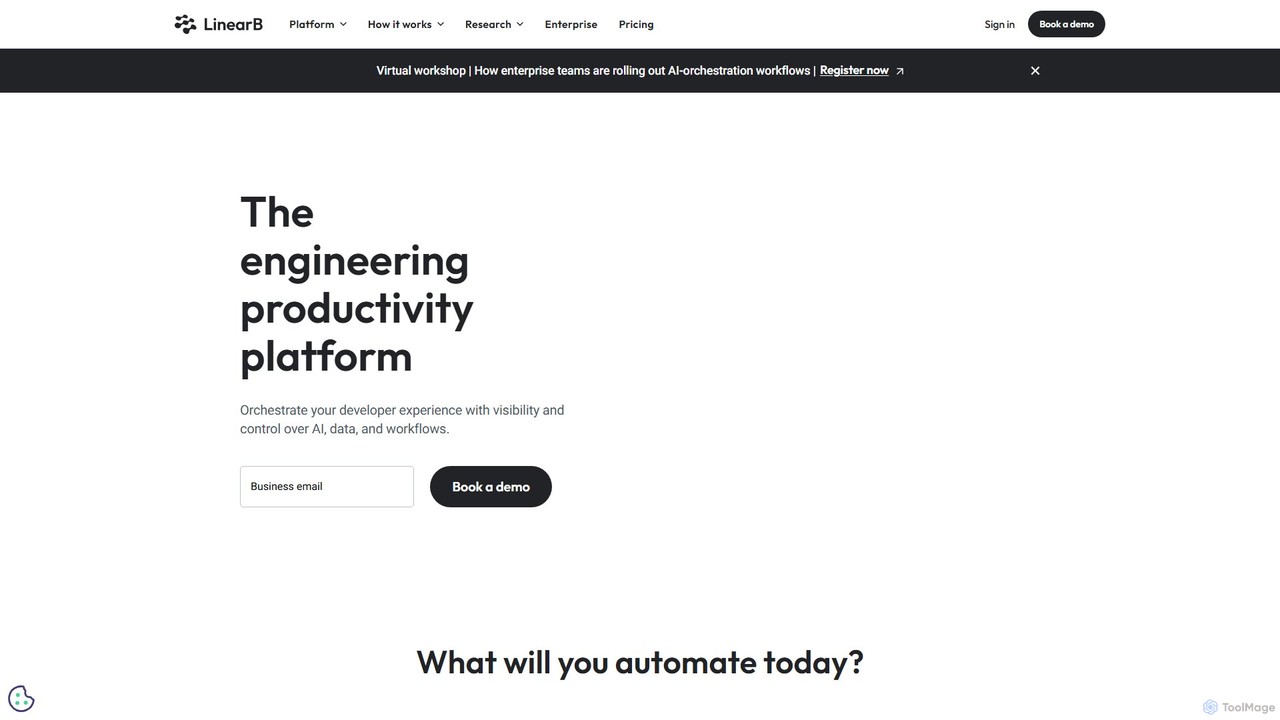
LinearB is an AI-powered engineering productivity platform that provides visibility and control over the entire software development lifecycle. It helps teams measure performance with DORA & SPACE metrics, automate workflows like AI code reviews, and align engineering efforts with business outcomes, ultimately enhancing developer experience (DevEx).
Compare product focus, pricing models and audiences. Highlighted rows indicate different listed information; unknown pricing does not mean free.
| Quick facts | Haystack | LinearB |
|---|---|---|
| Pricing model | Freemium | Freemium |
| Product type | Web | Web |
| Primary focus | Business Intelligence | Business Intelligence |
| Audience and roles | No data available | No data available |
| Categories | Business Intelligence · Analytics & Reporting · Project Management | Business Intelligence · Code Quality · Project Management |
| Added | Aug 1, 2025 | Aug 12, 2025 |
| Updated | Nov 19, 2026 | Nov 19, 2026 |
Explore the listed product descriptions, features and workflows. Taxonomy labels alone are not feature evaluations.
Haystack is a leading delivery operations and engineering intelligence platform designed to provide clarity and actionable insights for software development teams. Trusted by hundreds of companies, it transforms complex development data from Git repositories and project management tools into easy-to-understand metrics and reports. The platform focuses on improving engineering output, fostering team trust, and aligning development efforts with business objectives. Unlike tools that can be misused for top-down micromanagement, Haystack promotes transparency by ensuring that teams and executives have access to the same data, creating a collaborative environment for continuous improvement.
Getting started with Haystack is a straightforward process designed to deliver value quickly:
Haystack is valuable for various roles within an engineering organization:
Haystack stands out by focusing on team empowerment and trust. Its core advantages include:
Haystack offers a transparent pricing model with a 14-day free trial.
A credit card is not required to start the free trial, making it easy to experience the platform's benefits firsthand.
LinearB is a comprehensive engineering productivity platform designed to orchestrate the developer experience by providing unparalleled visibility and control over AI, data, and workflows. It empowers engineering leaders to move beyond simple metrics and actively shape how code is brought to production. By correlating data from Git, project management, and CI/CD tools, LinearB offers a holistic view of the software development lifecycle (SDLC), enabling teams to identify bottlenecks, automate tedious tasks, and translate engineering performance into tangible business outcomes.
The platform is built on the philosophy that engineering data is business data. It helps leaders break down operational silos, eliminate guesswork, and achieve predictable software delivery. For developers, LinearB reduces toil and friction by automating routine tasks, allowing them to focus on high-value work and innovation. This focus on improving the developer experience (DevEx) is central to LinearB's mission, creating a foundation for modern engineering teams to build, ship, and scale effectively.
LinearB follows a structured, five-step methodology to drive productivity at scale:
For Engineering Leaders (CTOs, VPs of Engineering): Translate complex engineering data into clear business narratives for the C-suite. Justify headcount, demonstrate the ROI of engineering investments, and drive strategic initiatives based on data-driven insights into team performance and project delivery.
For Engineering Managers: Identify and eliminate bottlenecks within the development process. Use real-time data to coach developers, balance workloads, and improve team velocity. Reduce PR cycle time and improve code quality through targeted automations and insights.
For Developer Experience (DevEx) & Platform Teams: Standardize best practices across the entire organization. Safely roll out and govern the use of AI tools. Reduce developer friction by automating manual tasks and streamlining workflows, ultimately improving developer satisfaction and retention.
LinearB stands out by not just providing metrics, but by offering the controls to act on them. Its key advantages include:
LinearB offers a tiered pricing structure to cater to teams of different sizes and needs. While a free plan exists, the core offerings are in the paid tiers:
Their taxonomy shows where the products overlap and where each one has a more distinct focus. Unknown fields are shown explicitly and are never filled with assumptions.
Traffic is shown on the same scale so differences in market visibility are not visually understated.
Both charts share the same months and vertical scale. Each tool identifies its latest reporting month; missing months are left blank, not counted as zero. Regional and source visit counts are estimates calculated from the reported shares.
| Country/region | Percentage | Estimated visits |
|---|---|---|
| 🇺🇸United States | 36.06% | 2.4K |
| 🇧🇷Brazil | 24.07% | 1.6K |
| 🇮🇳India | 19.21% | 1.3K |
| 🇩🇪Germany | 11.3% | 765 |
| 🇻🇳Vietnam | 9.36% | 633 |
| Country/region | Percentage | Estimated visits |
|---|---|---|
| 🇺🇸United States | 39.54% | 29.7K |
| 🇮🇳India | 22.46% | 16.9K |
| 🇬🇧United Kingdom | 17.97% | 13.5K |
| 🇨🇦Canada | 11.03% | 8.3K |
| 🇮🇱Israel | 9% | 6.8K |
| Source type | Percentage | Estimated visits |
|---|---|---|
| Direct | 79.7% | 59.9K |
| Referral | 19.02% | 14.3K |
| 1.28% | 962 |
Ratings, comments, favorites, and likes are community signals—not a substitute for product fit.
This page is assembled from ToolMage product listings, taxonomy, traffic statistics and on-site user feedback. It is not a hands-on test or an independent review.