ToolMage
Sign in

AI TOOL COMPARISON

Metaplane vs Trackingplan

What is the difference, and which fits your workflow? Compare features, usage, pricing models and traffic side by side.

Jump to key differences

Product overview

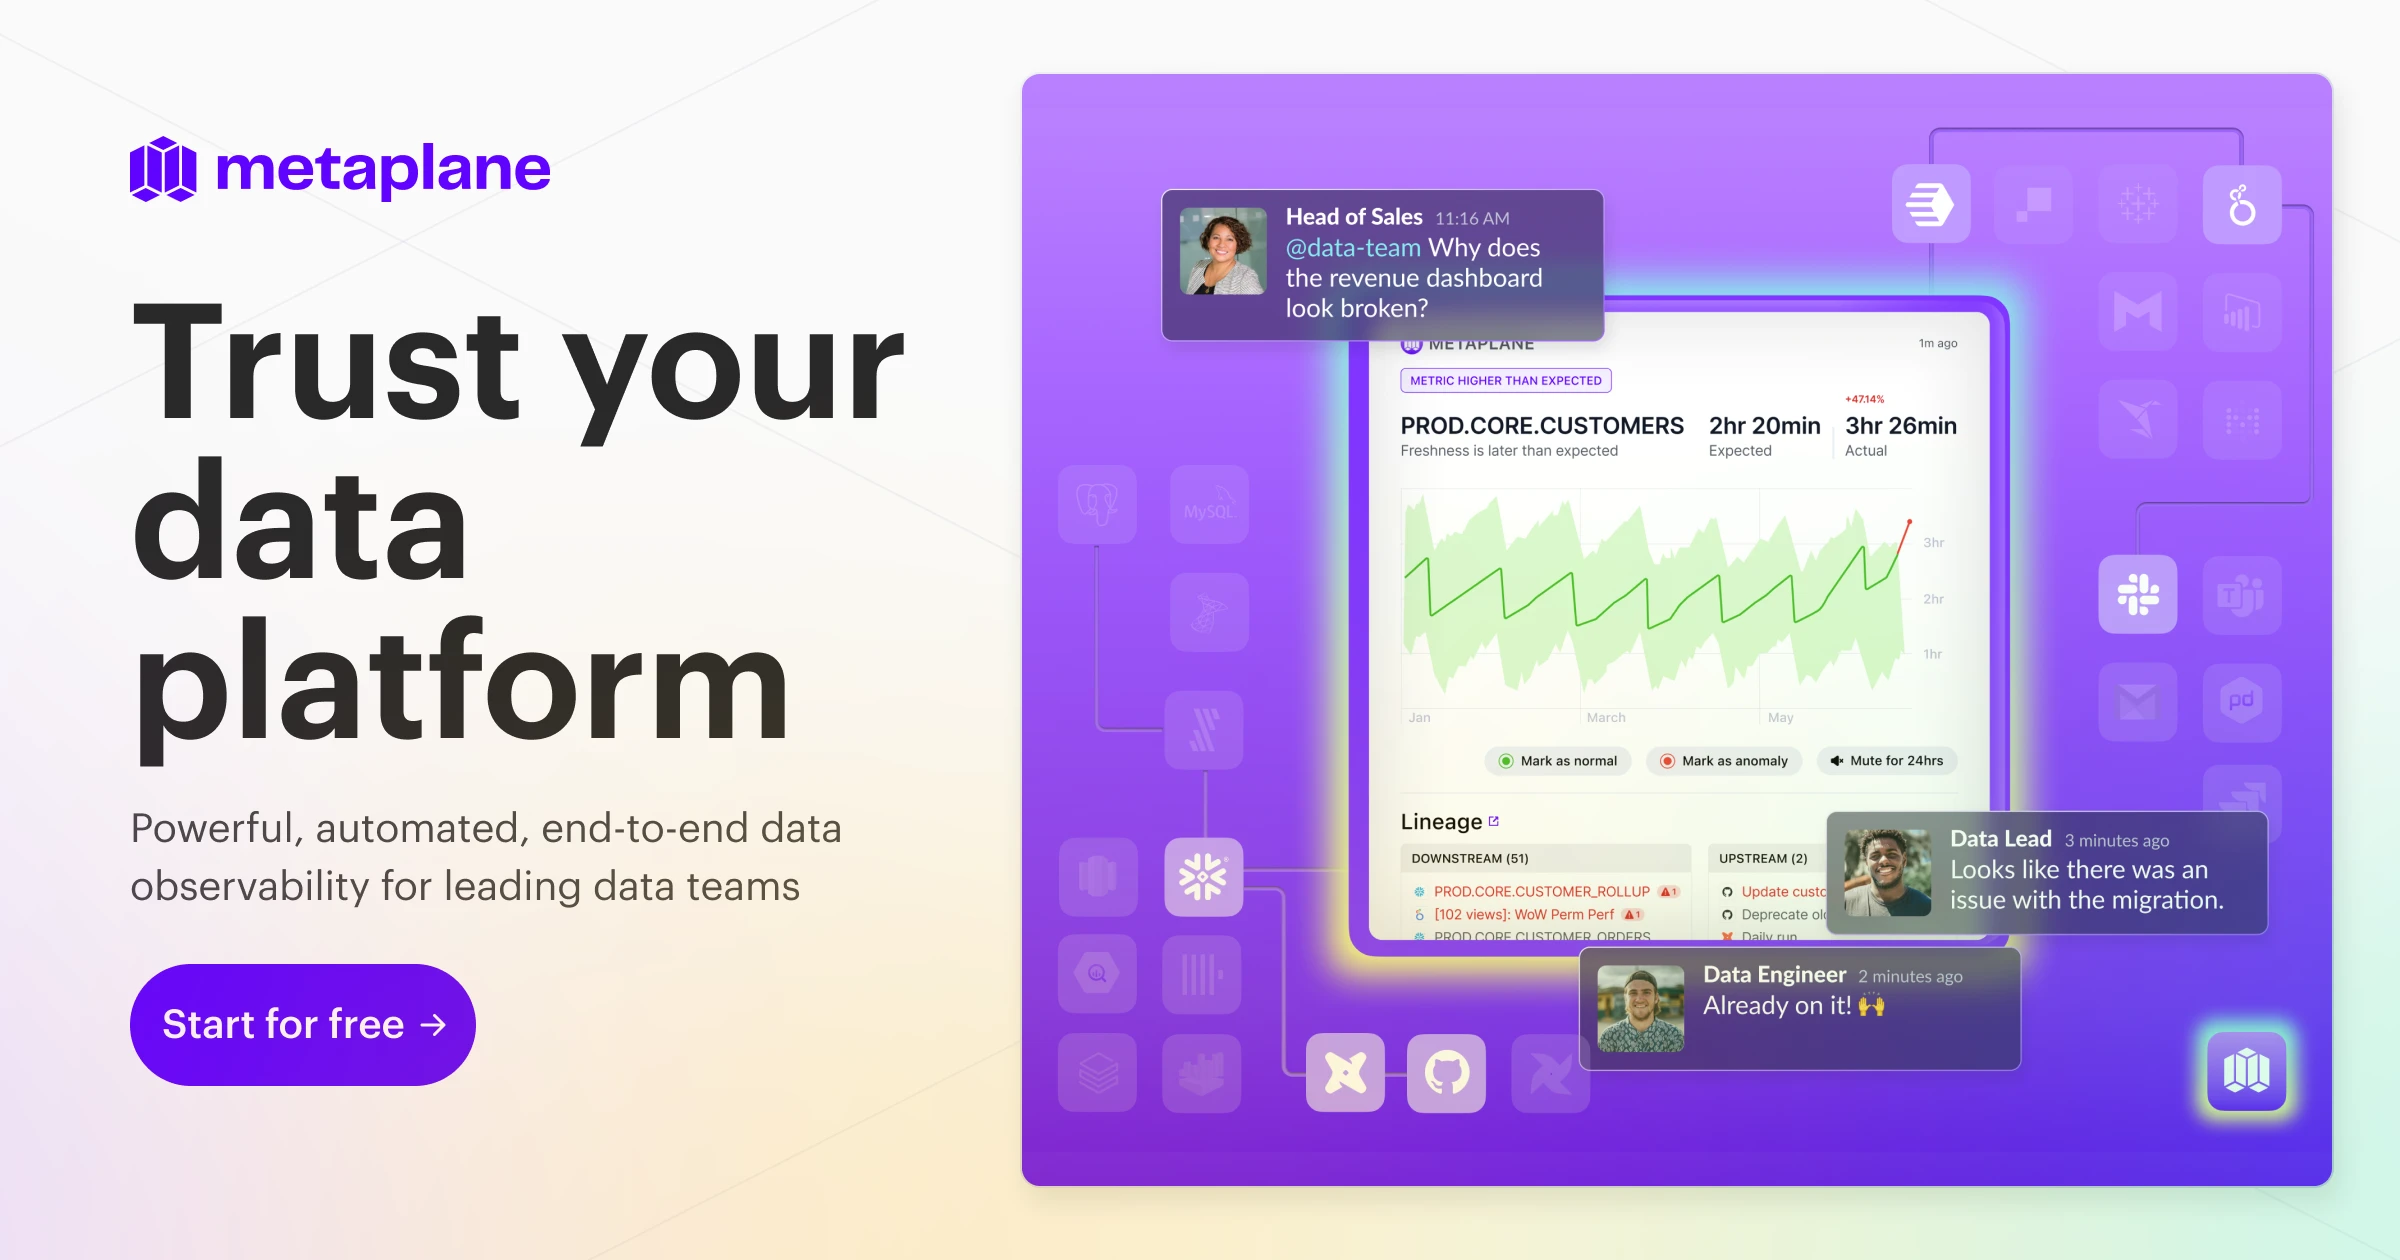
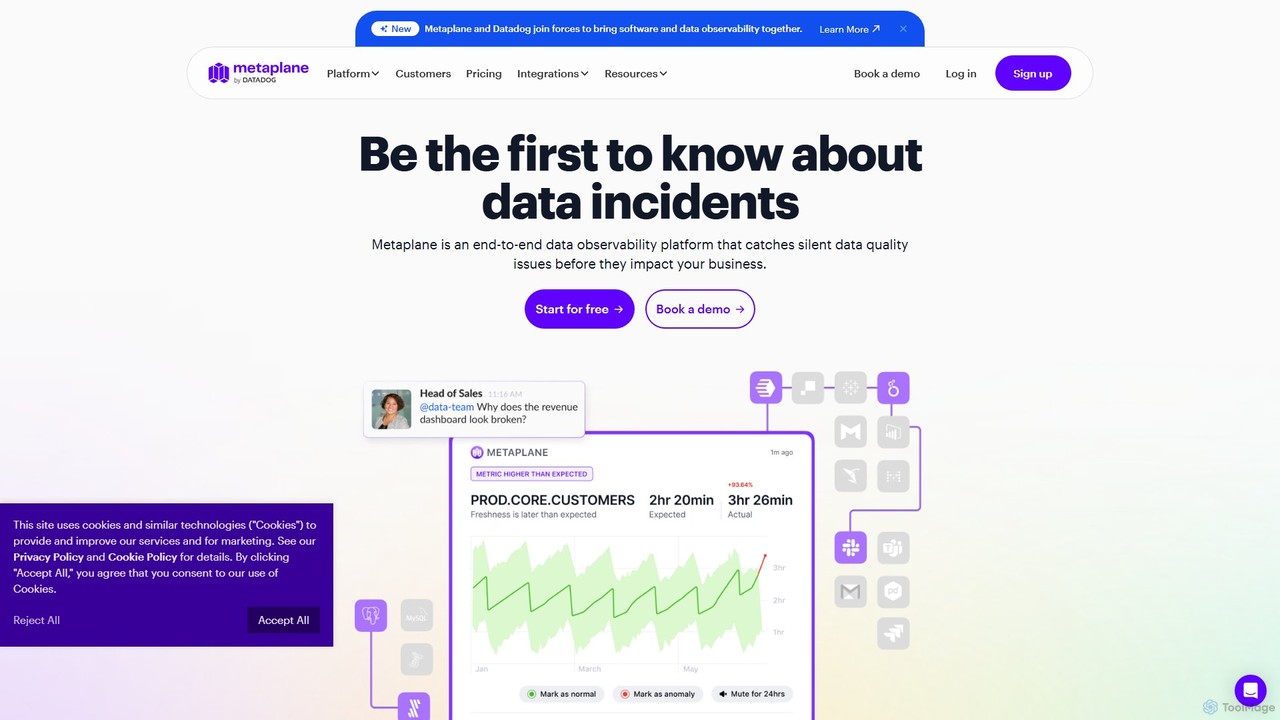
Metaplane Product overview

Metaplane is an end-to-end data observability platform for modern data teams. It uses machine learning to automatically monitor your data stack, detect silent data quality issues before they impact the business, and provide actionable alerts with full context.

Preview

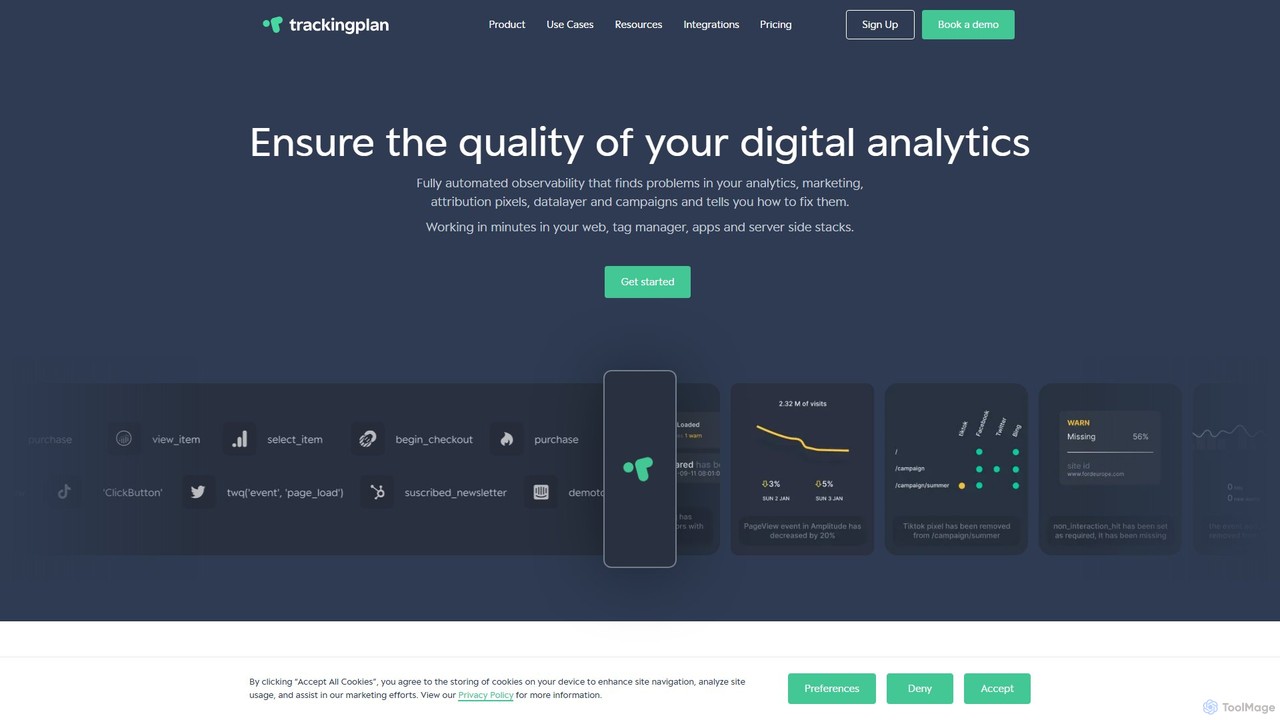
Trackingplan Product overview

Trackingplan is an automated data observability platform that ensures the quality of your digital analytics. It proactively detects and helps fix errors in your analytics implementations, marketing pixels, and campaign tracking in real-time. By eliminating manual audits, it saves time and ensures data integrity for data-driven decisions.

Preview

Quick facts

Compare product focus, pricing models and audiences. Highlighted rows indicate different listed information; unknown pricing does not mean free.

Metaplane VS Trackingplan — Quick facts
Quick factsMetaplaneTrackingplan
Pricing modelFreemiumFreemium
Product typeWebWeb
Primary focusAnalyticsObservability
Audience and rolesNo data availableNo data available
CategoriesAnalytics · Observability · Database · MonitoringObservability · Testing · Analytics
AddedAug 10, 2025Aug 13, 2025
UpdatedNov 19, 2026Nov 19, 2026

Features, usage and use cases

Explore the listed product descriptions, features and workflows. Taxonomy labels alone are not feature evaluations.

Metaplane

Metaplane, now part of Datadog, is a comprehensive data observability platform designed to bring software and data observability together. It empowers modern data teams to build trust in their data by proactively identifying and resolving data quality issues across the entire data stack, from source to BI tools. The platform uses advanced machine learning to detect anomalies that traditional, rigid tests might miss, accounting for seasonality and trends in your data. This ensures that alerts are relevant and noise-free, allowing teams to focus on genuine problems.

The core mission of Metaplane is to prevent silent data incidents—subtle errors in data that can go unnoticed for long periods, leading to flawed analysis and poor business decisions. By providing 100% visibility into data pipelines, Metaplane helps teams understand the flow of data, identify critical dependencies, and assess the impact of changes before they are deployed.

How to use Metaplane

Getting started with Metaplane is designed to be quick and straightforward, typically taking less than 15 minutes.

  1. Integrate Your Data Stack: Connect Metaplane to your data warehouses (like Snowflake, BigQuery, Redshift), transformation tools (like dbt), and BI platforms (like Looker, Tableau, PowerBI). The integration process is seamless and requires only read-only access to metadata, ensuring your underlying data remains secure.
  2. Configure Monitors: Metaplane automatically suggests monitors for your most important tables. You can also manually configure monitors for various data quality metrics, including volume, freshness, schema changes, uniqueness, nullness, and statistical distributions. Custom SQL monitors are also available for specific business logic.
  3. ML Model Training: Once connected, Metaplane's machine learning models begin training on your data's metadata profiles. Within as little as three days, the system is ready to send intelligent, context-aware alerts.
  4. Receive and Act on Alerts: When an anomaly is detected, Metaplane sends a targeted notification to your preferred communication channel (e.g., Slack, MS Teams, PagerDuty). The alert includes rich context, such as the nature of the issue and potential downstream impacts.
  5. Investigate and Resolve: Use Metaplane's end-to-end column-level lineage to trace the issue back to its root cause. The lineage graph visualizes dependencies across your entire stack, significantly accelerating triage and resolution time.
  6. Prevent Future Issues with Data CI/CD: Integrate Metaplane into your CI/CD pipeline (GitHub/GitLab). Before merging a pull request (e.g., for a dbt model change), Metaplane automatically runs regression and impact tests, forecasting which downstream tables and dashboards will be affected. This prevents data quality issues from ever reaching production.

Core Features of Metaplane

  • Automated Anomaly Detection: ML-powered monitors that automatically adjust to seasonality and trends to detect issues in data volume, freshness, schema, uniqueness, nullness, and more.
  • End-to-End Column-Level Lineage: Get a complete, automatically generated picture of your data stack, from sources to BI tools, to understand data flow and dependencies without manual setup.
  • Data CI/CD: Prevent data quality issues by running automated regression and impact tests within pull requests. It integrates with dbt Core/Cloud and GitHub/GitLab.
  • Data Insights & Usage Analytics: Discover how your data is being used, by whom, where, and how frequently. This helps in optimizing queries, reducing data debt, and prioritizing critical data assets.
  • Automated & Configurable Alerts: Receive targeted, noise-free notifications in tools like Slack, MS Teams, and PagerDuty, with the context needed to resolve issues quickly.
  • Schema Change Tracking: Get notified whenever databases, schemas, tables, or columns are added, renamed, or removed.
  • Snowflake Native App: Deploy and run Metaplane directly within your Snowflake environment, ensuring data never leaves your warehouse and allowing you to pay with existing Snowflake credits.

Use Cases for Metaplane

Metaplane is valuable for various roles and teams within a data-driven organization:

  • Data Engineering Teams: Proactively monitor data pipelines, reduce time spent firefighting data bugs, and ensure the reliability of data infrastructure.
  • Analytics Engineers: Confidently develop and deploy dbt models using Data CI/CD to prevent breaking changes to downstream dashboards and analyses.
  • BI and Analytics Teams: Build and maintain trust with business stakeholders by ensuring that the data powering reports and dashboards is accurate, fresh, and reliable.
  • Data Platform Owners: Gain full visibility and control over the data stack, optimize warehouse costs by identifying unused assets, and enforce data governance standards.

Advantages of Metaplane

Metaplane offers several key advantages over traditional data quality solutions:

  • Fast Time-to-Value: Setup takes minutes, not weeks, with actionable alerts generated within days.
  • Cost-Effective Pricing: A flexible, usage-based model where you only pay for the tables you actively monitor, which scales with your needs.
  • Reduced Alert Fatigue: Intelligent, ML-driven alerting that understands your data's normal patterns, significantly reducing false positives.
  • Holistic Observability: It combines monitoring, lineage, usage insights, and CI/CD into a single, unified platform.
  • Enterprise-Grade Security: SOC 2 Type II compliant and adheres to high privacy standards like GDPR, CCPA, and HIPAA, with a read-only metadata approach.

Pricing and Plans

Metaplane offers a flexible pricing structure designed for teams of all sizes.

  • Free Plan: A forever-free plan that includes monitoring for up to 10 tables and support for 4 users. It provides core monitoring capabilities for small teams or for trying out the platform.
  • Pro Plan: A usage-based plan where you pay per monitored table. It includes everything in the Free plan, plus advanced features like column-level lineage, Data CI/CD, cost & performance monitoring, and support for 12 users and unlimited viewers.
  • Enterprise Plan: A custom plan for large organizations with specific needs. It includes all Pro features, plus custom integrations, SSO (Okta, SAML), PrivateLink support, and premium support with a dedicated CSM.

Additionally, users of the Snowflake Native App can pay for Metaplane using their existing Snowflake credits, simplifying procurement.

Trackingplan

Trackingplan is a comprehensive, AI-powered data observability platform designed to guarantee the quality and accuracy of your digital analytics infrastructure. It serves as an automated guardian for your entire data pipeline, from the datalayer to the final destination, monitoring your web, app, and server-side stacks. The platform is built for data-driven teams, including digital analysts, marketers, developers, and agencies, who rely on accurate data to make critical business decisions. It addresses the common and time-consuming problem of data quality issues, such as broken tracking, misconfigured marketing pixels, and inconsistent campaign data, by replacing tedious manual audits with a fully automated, real-time monitoring system.

By leveraging AI, Trackingplan learns your implementation's patterns and automatically identifies anomalies, schema deviations, and configuration errors. It provides immediate alerts via Slack, email, or Teams, allowing you to address problems before they significantly impact your reporting, ad spend ROI, or business intelligence. This proactive approach ensures that the data you rely on is always trustworthy and up-to-date.

How to use Trackingplan

Getting started with Trackingplan is designed to be fast and straightforward, requiring minimal technical effort. The process typically involves a simple, one-time setup that takes only a few minutes.

  1. Installation: Install the Trackingplan pixel or SDK. For websites, this is a single line of code that you can copy and paste into your site's header or via a tag manager like Google Tag Manager. For mobile applications (iOS/Android) and server-side implementations, you can integrate the lightweight SDK. No complex code changes are needed.
  2. Automatic Discovery: Once installed, Trackingplan begins listening to the data your users send to all your analytics and marketing integrations. It automatically discovers all events, properties, and pixels, creating a live and always-updated map of your entire tracking setup.
  3. Real-time Monitoring & Alerts: The platform's AI starts analyzing the data flow, identifying patterns, and setting up baseline behaviors. You will automatically receive real-time alerts for any detected issues, such as missing events, traffic anomalies, schema validation errors, or misconfigured campaign parameters.
  4. Diagnose and Fix: Alerts provide detailed context about what went wrong, where it occurred, and why. Using Trackingplan's dashboard, including tools like the Data Explorer and Track Explorer, your team can perform root cause analysis to quickly diagnose the problem and implement the correct fix, streamlining resolution times.

Core Features of Trackingplan

  • Automated Error Detection: Continuously monitors your analytics in real-time and alerts you to any changes or breaks in your tracking, marketing pixels, and campaigns.
  • Traffic Change Monitoring: Detects unexpected drops or peaks in event traffic, identifies new or missing events and pixels, and allows for custom alert thresholds.
  • Specification & Schema Validation: Validates data against your tracking plan, detecting missing properties, incorrect data types, and values that don't match predefined rules (Regex, Enums), including complex conditional logic.
  • Campaign Monitoring: Spots attribution errors by validating UTM naming conventions, checking for campaign tagging issues, and ensuring marketing pixels are firing correctly on landing pages.
  • Privacy Risk Identification: Helps you stay compliant by identifying potential data privacy breaches and comparing event data based on user consent status.
  • Regression Testing: Integrates with your CI/CD pipeline to validate tracking implementations in staging or development environments, catching errors before they reach production.
  • Root Cause Analysis: Provides powerful debugging tools to trace problems from the alert back to the source, offering data samples and detailed context for swift resolution.

Use Cases for Trackingplan

Trackingplan is versatile and provides value to various roles within an organization:

  • For Digital Analysts: Automate the tedious process of data QA and validation. Get instant notifications on integration errors, ensuring the data used for reports and dashboards is always accurate and reliable.
  • For Marketing & Growth Teams: Ensure marketing pixels are always active and correctly configured on landing pages. Control campaign attribution by catching UTM and tagging errors early, maximizing ad ROI.
  • For Developers & QA Teams: Integrate analytics testing into the development lifecycle. Catch tracking bugs before they are deployed to production, preventing data corruption and saving development cycles.
  • For Agencies: Efficiently manage data quality across multiple client accounts. Move away from manual audits, provide proactive issue detection as a service, and demonstrate value by ensuring clients' data is always pristine.

Advantages of Trackingplan

The primary advantage of Trackingplan is its ability to build a foundation of trusted data across the organization. It saves significant time and resources—over 3 hours daily for analysts, according to the company—by automating what is typically a manual, error-prone process. This leads to an 80% reduction in data errors in reports and a 15% improvement in campaign performance. By providing a single source of truth for your tracking implementation, it fosters seamless collaboration between marketing, product, and engineering teams. Its ease of installation and privacy-centric design make it a powerful yet non-intrusive solution for maintaining high-quality data.

Pricing and Plans

Trackingplan offers a freemium model with plans designed to scale with your business needs.

  • Free Plan: Ideal for small websites or those just getting started. It includes monitoring for up to 10,000 Monthly Active Users (MAUs), 1 seat, 1 environment, automatic error detection, and marketing pixels reports. No credit card is required.
  • Pay As You Grow: A flexible, self-service plan with pricing based on your MAU volume (e.g., tiers for 50k, 200k, 500k MAUs). This plan includes more seats, environments, and standard email support.
  • Enterprise Plan: Tailored for large organizations with over 500,000 MAUs. It starts at $1,500/month (billed annually) and includes all features, plus dedicated premium support with an SLA, API access for custom integrations, and integration with regression testing pipelines.
  • For Agencies: Custom pricing packages are available for agencies managing multiple clients, starting at a total of 500,000 MAUs across all accounts.

Positioning

Their taxonomy shows where the products overlap and where each one has a more distinct focus. Unknown fields are shown explicitly and are never filled with assumptions.

Categories

Shared
Observability
Only Metaplane
AnalyticsDatabaseMonitoring
Only Trackingplan
TestingAnalytics

Tags

Shared
analyticsdata governancedata observabilitydata quality
Only Metaplane
anomaly detectionbigqueryCI/CDdata engineeringdata monitoringdbtlineagesnowflake
Only Trackingplan
campaign monitoringerror detectionmarketing analyticspixel trackingqa testingtag managementUTM validation

Audience and roles

Shared
No listed items
Only Metaplane
No listed items
Only Trackingplan
No listed items

Traffic comparison

Traffic is shown on the same scale so differences in market visibility are not visually understated.

How to interpret the traffic data

Both charts share the same months and vertical scale. Each tool identifies its latest reporting month; missing months are left blank, not counted as zero. Regional and source visit counts are estimates calculated from the reported shares.

Metaplane monthly traffic:

Latest traffic · 2026-05

Monthly visits
26.5K
Avg. visit duration
2:39
Pages per visit
9.75
Bounce rate
33.59%
Data updated 2026-06-15

Monthly traffic trend

  • 2025-09: 36.9K
  • 2026-01: 33.4K
  • 2026-02: 37.4K
  • 2026-03: 30.9K
  • 2026-04: 25.7K
  • 2026-05: 26.5K

Top regions

Top 5 countries/regions
Country/regionPercentageEstimated visits
🇺🇸United States75.27%20K
🇻🇳Vietnam7.21%1.9K
🇮🇳India6.88%1.8K
🇧🇷Brazil5.54%1.5K
🇮🇩Indonesia5.1%1.4K

Traffic sources

Source typePercentageEstimated visits
Direct97.17%25.8K
Referral2.83%750

Search keywords

anomaliesdata anomaly meaningdata validation in marketing researchgoogle big query rows in tablesmetaplane

Trackingplan monthly traffic:

Latest traffic · 2026-05

Monthly visits
21.5K
Avg. visit duration
0:19
Pages per visit
1.69
Bounce rate
42.25%
Data updated 2026-06-15

Monthly traffic trend

  • 2025-09: 30.9K
  • 2026-01: 21.5K
  • 2026-02: 19K
  • 2026-03: 22.7K
  • 2026-04: 20.5K
  • 2026-05: 21.5K

Top regions

Top 5 countries/regions
Country/regionPercentageEstimated visits
🇺🇸United States35.93%7.7K
🇮🇳India17.51%3.8K
🇧🇷Brazil16.42%3.5K
🇻🇳Vietnam15.36%3.3K
🇷🇺Russia14.78%3.2K

Search keywords

data retention policy templatemeta pixel helpertiktok pixel helpertracking plantrackingplan

Community signals

Ratings, comments, favorites, and likes are community signals—not a substitute for product fit.

Metaplane

Rating
No data available
Comments
0
Favorites
158
Likes
177

Trackingplan

Rating
No data available
Comments
0
Favorites
192
Likes
182

Metaplane vs Trackingplan · Comparison FAQ

What do Metaplane and Trackingplan have in common?
Both tools are listed under Observability. These categories indicate overlapping use cases; compare their detailed descriptions for workflows, capabilities and limitations.
Are Metaplane and Trackingplan free?
Listed pricing models: Metaplane — Freemium; Trackingplan — Freemium. Missing pricing is not proof of a free plan, and freemium does not mean every feature is free. Check official sites for current plans, limits and trials.
How should I choose between Metaplane and Trackingplan?
The primary listed category is Analytics for Metaplane, and Observability for Trackingplan. Compare features, steps and use cases, then verify pricing, data permissions and deployment needs. This page does not include hands-on testing and does not declare a winner from traffic or tags.

Sources and comparison methodology

This page is assembled from ToolMage product listings, taxonomy, traffic statistics and on-site user feedback. It is not a hands-on test or an independent review.
  • Feature and plan descriptions reflect information in the listings, not real-time guarantees. Verify pricing, quotas, availability and privacy terms on the official sites.
  • Traffic uses the reporting months shown. Missing statistics do not mean zero visits, and different periods do not establish growth or superiority. Regional and source visit counts are estimates based on shares.
  • Different tags indicate differences in the listings, not proof that the other product lacks a capability. Ratings, favorites and visits are not used to declare a winner.

Related comparisons