PLG OS is an all-in-one, no-code platform designed for SaaS businesses to accelerate product-led growth. It enables the creation of personalized user onboarding, in-app messaging, feedback surveys, and gamification features to boost user activation, engagement, and retention, all without extensive development effort.
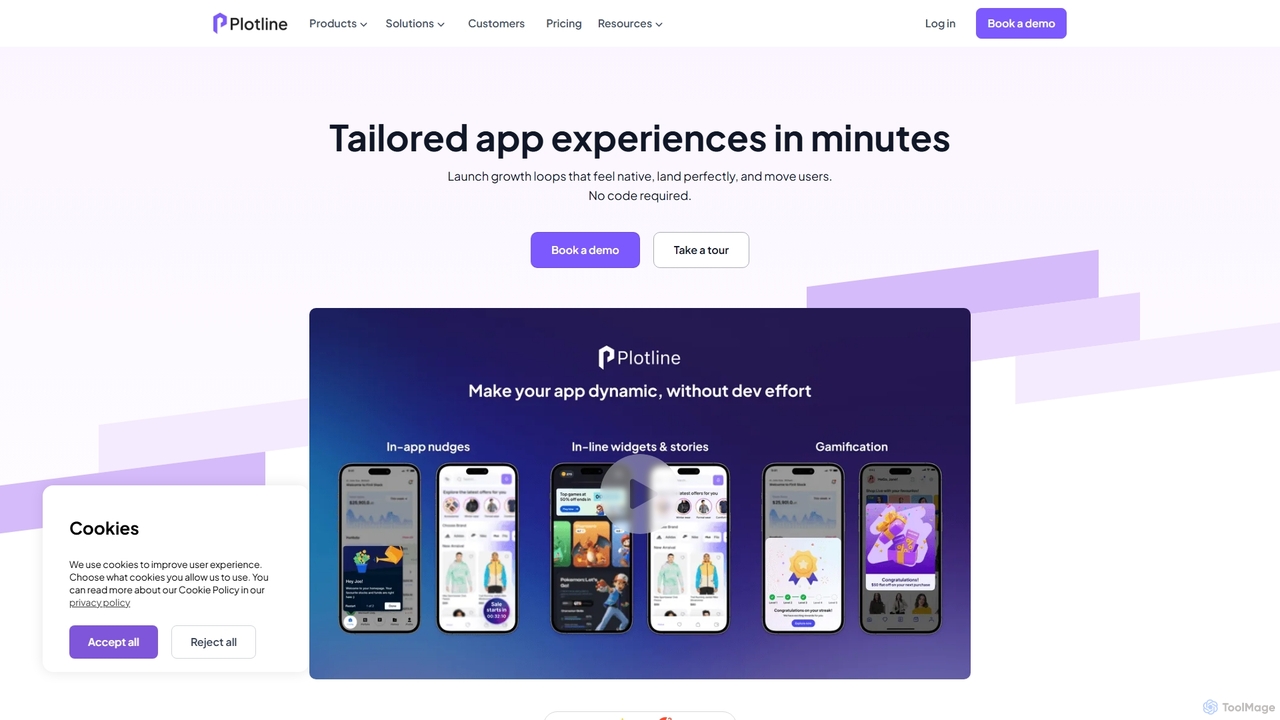
Plotline is a no-code platform that empowers mobile app teams to design, launch, and A/B test dynamic in-app experiences. Boost user activation, feature adoption, and conversions with customizable widgets, nudges, and gamification, all without relying on engineering resources.
Product overview
PLG OS Product overview
PLG OS is an all-in-one, no-code platform designed for SaaS businesses to accelerate product-led growth. It enables the creation of personalized user onboarding, in-app messaging, feedback surveys, and gamification features to boost user activation, engagement, and retention, all without extensive development effort.
Plotline Product overview
Plotline is a no-code platform that empowers mobile app teams to design, launch, and A/B test dynamic in-app experiences. Boost user activation, feature adoption, and conversions with customizable widgets, nudges, and gamification, all without relying on engineering resources.
Detailed feature comparison
| Feature | PLG OS | Plotline |
|---|---|---|
| Primary category | User Behavior | User Behavior |
| Added | 2025-08-02 | 2025-09-27 |
| Pricing | Freemium | Paid |
| Official website | www.plgos.com | plotline.so |
| Product type | Website | Website |
| Performance data | ||
| User rating | Not verified | Not verified |
| Comments | 0 | 0 |
| Monthly visits | 6.9K | 31.2K |
| Monthly growth | -24% | 72.2% |
| Favorites | 98 | 120 |
| Details | View details | View details |
PLG OS vs Plotline monthly traffic
Compare PLG OS and Plotline by monthly reach, traffic trend, visit depth, top regions, and acquisition sources.
How to interpret the traffic data
In the PLG OS vs Plotline monthly traffic comparison, PLG OS currently shows 6.9K visits and Plotline shows 31.2K; Plotline has about 4.5 times the visible traffic of PLG OS, an absolute difference of about 24.3K visits. This reflects visible reach, not feature quality or paid users.
Both tools provide verified traffic details, so monthly trends, visit depth, regions, and acquisition sources can be compared on the same basis.
PLG OS monthly traffic:
Latest traffic
Monthly traffic trend
- 2025/9: 14.2K Monthly visits
- 2026/1: 9.8K Monthly visits
- 2026/2: 7.8K Monthly visits
- 2026/3: 10.3K Monthly visits
- 2026/4: 9.1K Monthly visits
- 2026/5: 6.9K Monthly visits
Top regions
Top 5 countries/regions
| Country/region | Percentage | Traffic |
|---|---|---|
| 🇺🇸United States | 49.1% | 3.4K |
| 🇮🇳India | 17.92% | 1.2K |
| 🇮🇩Indonesia | 13.18% | 912 |
| 🇬🇧United Kingdom | 10.26% | 710 |
| 🇨🇦Canada | 9.54% | 660 |
Search keywords
Plotline monthly traffic:
Latest traffic
Monthly traffic trend
- 2025/9: 70K Monthly visits
- 2026/1: 38.2K Monthly visits
- 2026/2: 18.6K Monthly visits
- 2026/3: 20.2K Monthly visits
- 2026/4: 18.1K Monthly visits
- 2026/5: 31.2K Monthly visits
Top regions
Top 5 countries/regions
| Country/region | Percentage | Traffic |
|---|---|---|
| 🇮🇳India | 33.29% | 10.4K |
| 🇺🇸United States | 29.89% | 9.3K |
| 🇳🇬Nigeria | 18.53% | 5.8K |
| 🇻🇳Vietnam | 13.67% | 4.3K |
| 🇮🇩Indonesia | 4.62% | 1.4K |
Traffic sources
| Source type | Percentage | Traffic |
|---|---|---|
| Direct | 93.92% | 29.3K |
| Referral | 6.08% | 1.9K |
Search keywords
Usage comparison
Compare the core capabilities of PLG OS and Plotline
PLG OS Core features
Plotline Core features
Use cases
PLG OS Use cases
Plotline Use cases
Best suited roles
PLG OS Best suited roles
Plotline Best suited roles
PLG OS vs Plotline:In-depth comparison and selection guidance
First decide whether the products solve the same kind of need
This in-depth PLG OS vs Plotline comparison uses only the product records, taxonomy, audience, traffic, and community signals available on this page. PLG OS is primarily listed under “User Behavior”, while Plotline is primarily listed under “User Behavior”, so the first decision is whether your actual task matches their recorded scope.
The structured fields currently show these decision-relevant differences: Pricing (PLG OS: Freemium; Plotline: Paid); Monthly visits (PLG OS: 6.9K; Plotline: 31.2K); Monthly growth (PLG OS: -24%; Plotline: 72.2%); Favorites (PLG OS: 98; Plotline: 120); Website (PLG OS: www.plgos.com; Plotline: plotline.so). These facts are more useful for selection than brand visibility alone.
What market visibility and monthly traffic mean
In the PLG OS vs Plotline monthly traffic comparison, PLG OS currently shows 6.9K visits and Plotline shows 31.2K; Plotline has about 4.5 times the visible traffic of PLG OS, an absolute difference of about 24.3K visits. This reflects visible reach, not feature quality or paid users.
Both tools provide verified traffic details, so monthly trends, visit depth, regions, and acquisition sources can be compared on the same basis.
If public market visibility is an important first-pass criterion, investigate Plotline first. The final choice should still follow taxonomy, use case, and a real trial because higher traffic does not prove broader capabilities or better workflow fit.
Product positioning, use cases, and roles
PLG OS and Plotline currently overlap in shared categories: User Behavior; shared tags: customer retention, gamification, in-app messaging, no-code, and user onboarding. This can place both on the same shortlist, but it does not prove equal implementation, depth, or cost.
PLG OS's unique categories/tags are User Onboarding, Product Led Growth, No Code & Low Code, analytics, customer engagement, product-led growth, SaaS, and user feedback; Plotline's are Customer Engagement, No Code, A/B testing, conversion optimization, feature adoption, mobile growth, and user engagement. These unique fields are the strongest differentiators: validate the product whose recorded scope matches the task instead of following traffic alone.
What ratings, comments, and favorites can tell you
PLG OS has no verified rating, 0 comments, 98 favorites, and 104 likes;Plotline has no verified rating, 0 comments, 120 favorites, and 129 likes。
Neither product has enough rating or comment samples for a credible reputation ranking.
Selection guidance by actual need
When to evaluate PLG OS first
Put PLG OS on the priority trial list when the task aligns with “User Behavior” and especially User Onboarding, Product Led Growth, No Code & Low Code, analytics, customer engagement, and product-led growth. This follows recorded positioning and does not imply unlisted capabilities are absent.
PLG OS also currently records: pricing is freemium, product type is website, 6.9K verified monthly visits, no verified user rating. Verify any hard requirement around price, platform, or reach before trial, and do not let sparse review data substitute for testing.
When to evaluate Plotline first
Put Plotline on the priority trial list when the task aligns with “User Behavior” and especially Customer Engagement, No Code, A/B testing, conversion optimization, feature adoption, and mobile growth, or the users include Customer Success Manager, Growth Hacker, Marketing Manager, and Mobile App Developer. This follows recorded positioning and does not imply unlisted capabilities are absent.
Plotline also currently records: pricing is paid, product type is website, 31.2K verified monthly visits, no verified user rating. Verify any hard requirement around price, platform, or reach before trial, and do not let sparse review data substitute for testing.
How to validate the recommendation before deciding
The available data describes positioning, public visibility, and community signals, but it cannot prove output quality, speed, integration effort, privacy, or long-term cost in your workflow. Before deciding, run the same representative tasks in PLG OS and Plotline, then record completion time, accuracy, manual corrections, and the real paid threshold. A like-for-like trial turns this comparison into a defensible adoption decision.