Userflow
Userflow is an AI-powered, no-code platform for building in-app user onboarding, product tours, and surveys. It helps SaaS …
Userflow is an AI-powered, no-code platform for building in-app user onboarding, product tours, and surveys. It helps SaaS companies increase product adoption, engage users with new features, and reduce customer churn through interactive guidance.
Plotline
Plotline is a no-code platform that empowers mobile app teams to design, launch, and A/B test dynamic in-app …
Plotline is a no-code platform that empowers mobile app teams to design, launch, and A/B test dynamic in-app experiences. Boost user activation, feature adoption, and conversions with customizable widgets, nudges, and gamification, all without relying on engineering resources.

Zipy
Zipy is an AI-powered platform combining session replay, error tracking, and user analytics. It helps software teams proactively …
Zipy is an AI-powered platform combining session replay, error tracking, and user analytics. It helps software teams proactively identify, debug, and resolve user-facing issues, providing complete context with developer tools to enhance digital experiences and accelerate problem-solving.

Sahha
Sahha is a Health, Lifestyle, and Wellness API that empowers applications to unlock user data beyond their product. …
Sahha is a Health, Lifestyle, and Wellness API that empowers applications to unlock user data beyond their product. By integrating with smartphones and wearables, it provides real-time biomarkers, health scores, and behavioral archetypes to enable hyper-personalized user experiences, boost engagement, and increase retention.
Glassbox
Glassbox is an AI-powered digital experience analytics platform that helps businesses understand and optimize customer journeys. It provides …
Glassbox is an AI-powered digital experience analytics platform that helps businesses understand and optimize customer journeys. It provides complete visibility into web and mobile app interactions through session replay, AI-driven insights, and real-time alerts. The platform is designed to boost conversions, enhance security, and ensure compliance, particularly for enterprises in regulated industries like finance and retail.
Eyeware
Eyeware provides AI-powered head and eye tracking software that transforms standard webcams into powerful tracking devices. It offers …
Eyeware provides AI-powered head and eye tracking software that transforms standard webcams into powerful tracking devices. It offers solutions for immersive gaming, enhanced live streaming, productivity, user research, and OEM integration, eliminating the need for specialized hardware.
UserWise
UserWise is an AI-powered user analytics and feedback platform designed to help businesses understand their customers deeply. It …
UserWise is an AI-powered user analytics and feedback platform designed to help businesses understand their customers deeply. It consolidates user behavior data, feedback, and support tickets, using AI to uncover actionable insights, identify friction points, and predict user churn, enabling data-driven product development and enhanced user experience.
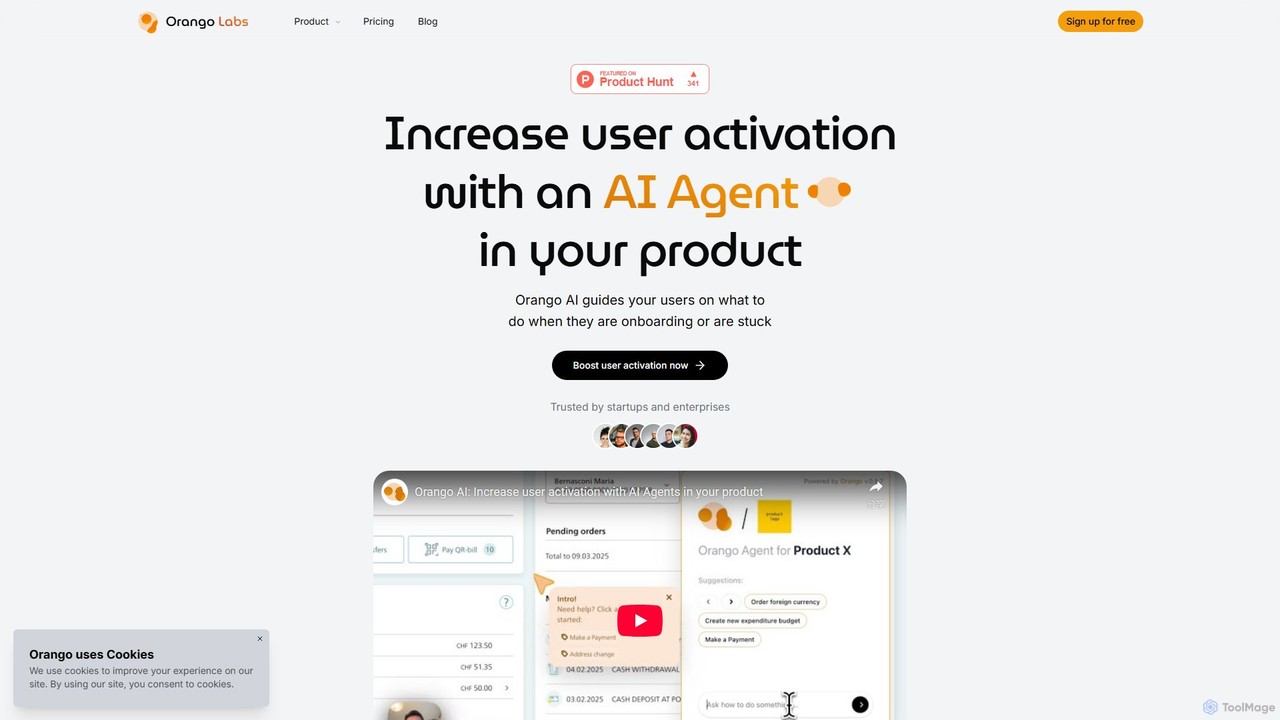
Orango AI
Orango AI is an in-product AI agent designed to boost user activation and reduce churn. It provides real-time, …
Orango AI is an in-product AI agent designed to boost user activation and reduce churn. It provides real-time, interactive guidance by controlling a virtual cursor to show users how to complete tasks, navigate complex workflows, and discover features, effectively acting as an expert co-pilot within your web application.
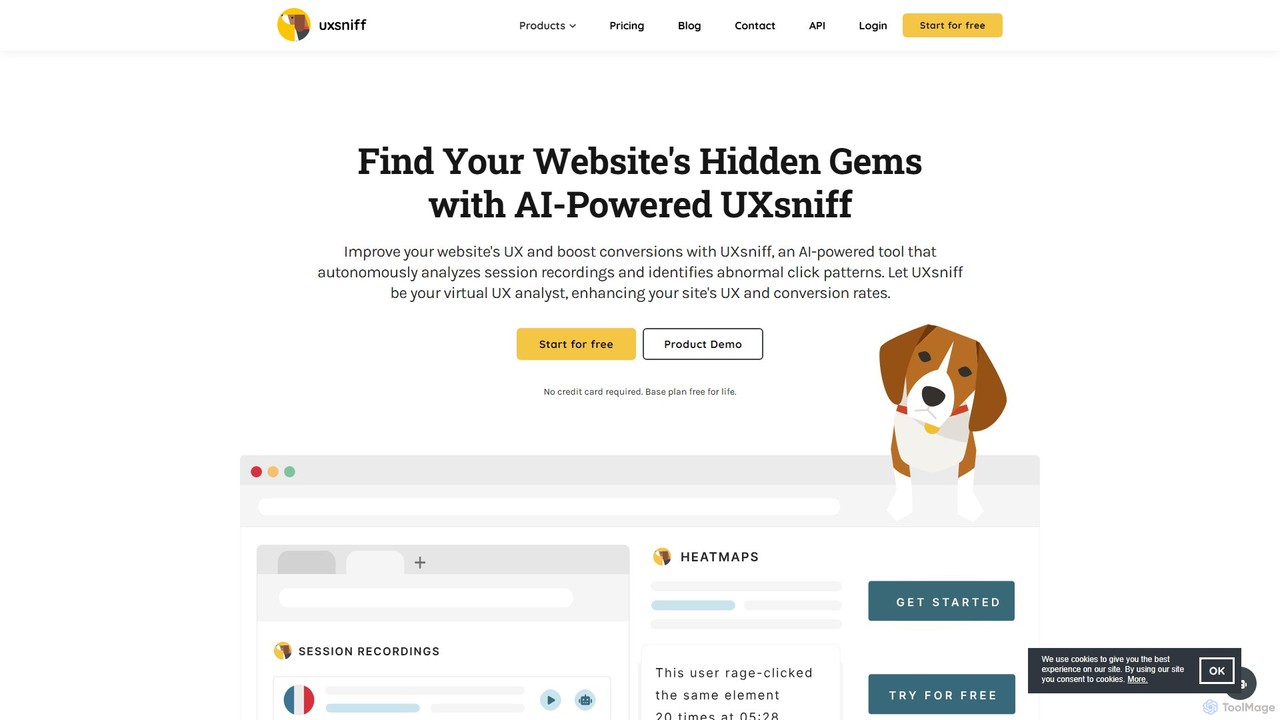
uxsniff
An AI-powered UX analytics platform offering website heatmaps, session recordings with GPT summaries, and automated audits. It helps …
An AI-powered UX analytics platform offering website heatmaps, session recordings with GPT summaries, and automated audits. It helps businesses understand user behavior, identify friction points, and optimize conversion rates.
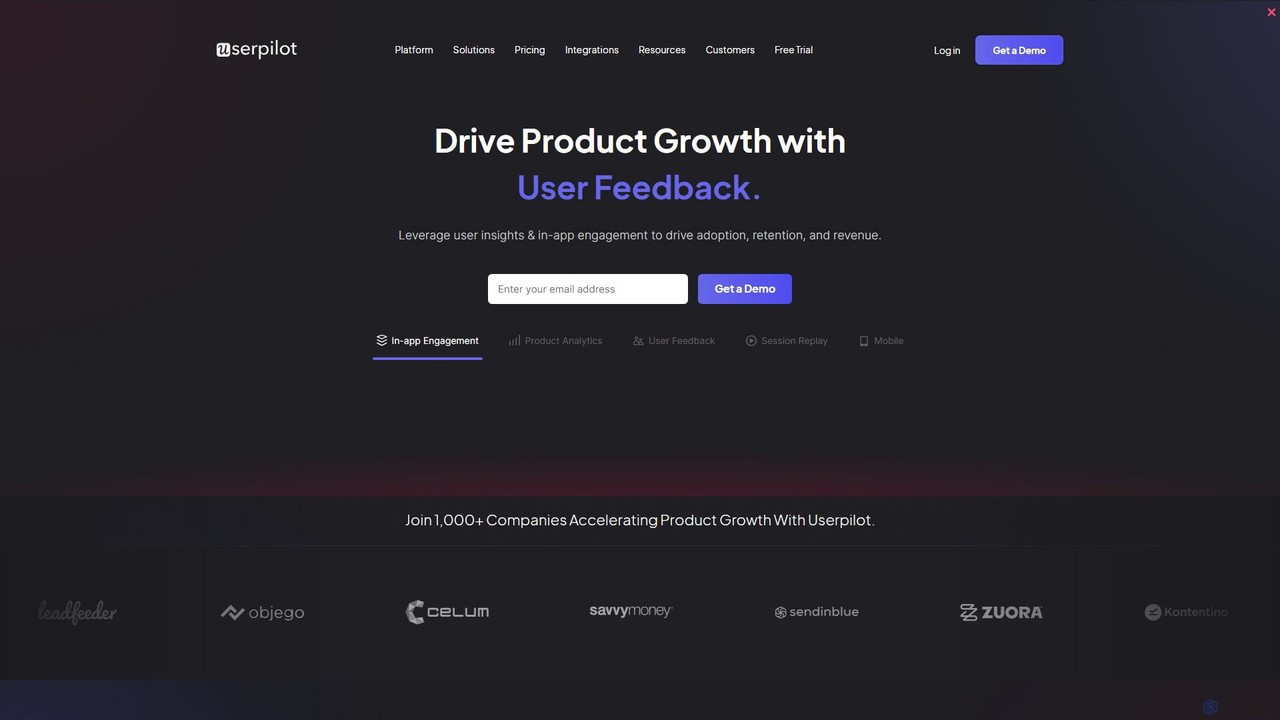
Userpilot
Userpilot is a comprehensive product growth platform designed for SaaS companies to improve user onboarding, engagement, and feature …
Userpilot is a comprehensive product growth platform designed for SaaS companies to improve user onboarding, engagement, and feature adoption. It enables teams to create personalized in-app experiences, track user behavior with advanced analytics, and gather actionable feedback through surveys, all without writing any code. It aims to boost user activation and long-term retention.
1Flow
1Flow is an AI-powered, in-product microsurvey platform for SaaS and mobile apps. It enables teams to create targeted, …
1Flow is an AI-powered, in-product microsurvey platform for SaaS and mobile apps. It enables teams to create targeted, contextual surveys to understand user needs, collect real-time feedback, and ultimately reduce churn and improve retention.
Human Behavior Co. Session Replay
Human Behavior Co. is an AI-powered analytics platform that automatically watches and analyzes user session replays. It identifies …
Human Behavior Co. is an AI-powered analytics platform that automatically watches and analyzes user session replays. It identifies key moments, uncovers behavior patterns, and provides actionable insights to help product teams optimize user journeys, improve feature adoption, and reduce churn without manual effort.
Instabug
Instabug is an AI-powered mobile observability platform designed for developers and product teams. It provides comprehensive tools for …
Instabug is an AI-powered mobile observability platform designed for developers and product teams. It provides comprehensive tools for bug and crash reporting, app performance monitoring (APM), session replay, and user feedback, helping teams build stable, high-performance mobile applications and resolve issues faster.
MOWA.ai
MOWA.ai is an AI-powered platform for automating mobile app and website optimization. It intelligently analyzes user behavior, automates …
MOWA.ai is an AI-powered platform for automating mobile app and website optimization. It intelligently analyzes user behavior, automates A/B testing, and delivers personalized experiences to boost engagement, conversions, and user retention.

Castle
Castle is an AI-powered fraud and abuse prevention platform that protects online businesses from bots, account takeovers (ATO), …
Castle is an AI-powered fraud and abuse prevention platform that protects online businesses from bots, account takeovers (ATO), and other malicious activities. It offers a dual-layer defense system, operating at both the edge and in-app, to provide real-time, developer-friendly security without disrupting the user experience.

PLG OS
PLG OS is an all-in-one, no-code platform designed for SaaS businesses to accelerate product-led growth. It enables the …
PLG OS is an all-in-one, no-code platform designed for SaaS businesses to accelerate product-led growth. It enables the creation of personalized user onboarding, in-app messaging, feedback surveys, and gamification features to boost user activation, engagement, and retention, all without extensive development effort.
Cedar
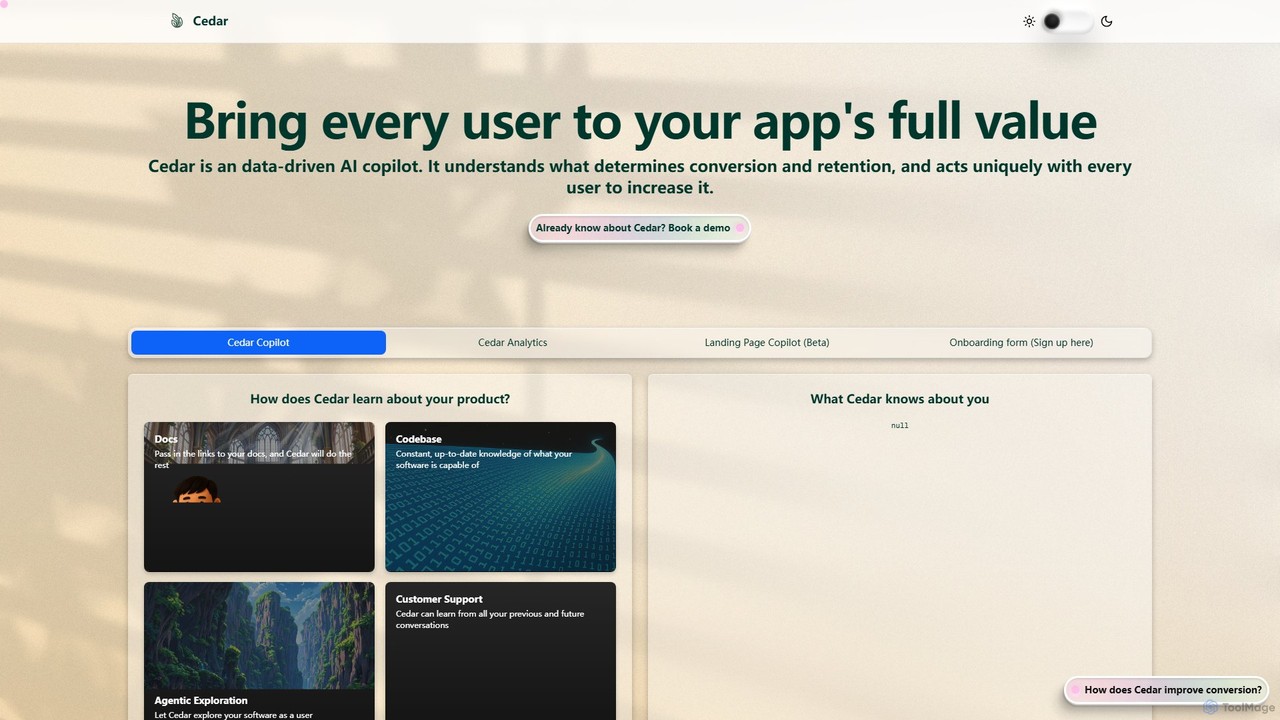
Cedar is a data-driven AI copilot designed to enhance user engagement and boost conversion rates for applications. It …
Cedar is a data-driven AI copilot designed to enhance user engagement and boost conversion rates for applications. It understands user behavior to provide personalized guidance, transforming the user journey from onboarding to full feature adoption, ultimately increasing retention.
About User Behavior
User Behavior analytics tools are a specialized category of software designed to visualize and understand how users interact with a website or application. They capture granular actions like clicks, mouse movements, and scrolling patterns through features like heatmaps and session recordings. This qualitative data helps product managers, UX designers, and marketers identify user friction points, optimize conversion funnels, and improve the overall digital experience. These tools provide the 'why' behind the quantitative data found in general analytics platforms.
Core Features
- Session Replays: Watch video-like recordings of real user sessions to see their exact journey and interactions.
- Heatmaps: Visualize aggregate user attention with maps for clicks, mouse movements, and scroll depth.
- Conversion Funnels: Track user progression through key steps (e.g., checkout) and identify where they drop off.
- Form Analytics: Analyze how users interact with forms field-by-field to reduce abandonment.
- On-site Surveys: Collect direct, in-context user feedback about specific pages or features in real-time.
Use Cases
These tools are essential for e-commerce businesses optimizing checkout flows, SaaS companies improving user onboarding, and content publishers understanding reader engagement. UX/UI designers use them to validate design changes with real data, while support teams use session replays to diagnose customer-reported bugs without needing to replicate them.
How to Choose
When selecting a tool, consider its impact on website performance, its data privacy and compliance features (e.g., GDPR, CCPA), and the accuracy of its data sampling methods. Also, evaluate its ability to integrate with your existing analytics stack, such as Google Analytics or CRM systems, and the user-friendliness of its dashboard and reporting features.
User BehaviorUse Cases
Optimizing E-commerce Checkout Funnels
An e-commerce manager notices a high cart abandonment rate. They use a User Behavior tool to watch session replays of users who drop off during checkout. They discover a confusing form field is causing frustration. By analyzing heatmaps, they see users repeatedly clicking a non-clickable element. Based on this direct visual evidence, they redesign the form, leading to a measurable increase in completed purchases and a reduction in support tickets related to checkout issues.
Optimize E-commerce Checkout Funnel
An e-commerce manager notices a high drop-off rate between the 'cart' and 'payment' pages. By using a User Behavior tool, they analyze session replays of users who abandoned their carts and discover a confusing shipping address field. They also use funnel analysis to confirm this is the primary drop-off point. After redesigning the form based on these insights, the checkout completion rate increases significantly.
Improving SaaS Feature Adoption
A product manager for a SaaS application wants to understand why a new feature has low engagement. They set up a funnel to track users from the dashboard to the new feature. Session recordings reveal that users are not seeing the entry point or are confused by the initial setup steps. The team then uses this insight to improve the feature's visibility and add an onboarding tutorial, boosting adoption rates and user satisfaction.
Improve SaaS Product Feature Adoption
A product manager for a SaaS application wants to understand why a new feature is not being used. They set up heatmaps on the dashboard where the feature is located, revealing that the button is in a 'cold' area with low user attention. They also launch an on-site survey targeting users who have not used the feature. This data informs a UI redesign that makes the feature more prominent, leading to a notable increase in adoption.
Validating a Website Redesign
A UX designer is proposing a new homepage layout. Before committing development resources, they create a prototype and use a User Behavior tool to run a user test. They analyze heatmaps and session recordings from test participants to see how they interact with the new design. This qualitative data helps validate design choices and identify potential usability issues early in the process, ensuring the final design is user-centric and effective.
Debug User-Reported Technical Issues
A customer support agent receives a bug report that developers cannot replicate. Instead of a lengthy back-and-forth, the agent finds the user's session replay in the User Behavior tool. By watching the recording, they see the exact sequence of actions, browser type, and console errors that led to the bug. They share the recording with the development team, enabling a quick and accurate fix.
Identifying and Reproducing Bugs
A customer support team receives a bug report that developers can't reproduce. By finding the user's session replay in the User Behavior tool, they can watch the exact sequence of actions that led to the error. The recording includes console logs and network information, providing developers with all the context needed to quickly identify and fix the bug, reducing resolution time and improving customer satisfaction.
Enhance Blog Post and Content Engagement
A content marketer wants to improve the performance of key landing pages. They use scroll maps to see how far down the page most users read, identifying which sections are most engaging. Click maps show which calls-to-action (CTAs) are being ignored. Based on this visual data, they restructure the content, move important CTAs to 'hot' areas, and shorten less engaging paragraphs, resulting in a higher time-on-page and more lead conversions.
Enhancing Blog Post Readability
A content marketer wants to improve engagement on their blog. They use scroll maps to see how far down the page most readers scroll before leaving, discovering that long paragraphs cause a significant drop-off. They also use click maps to see which calls-to-action are being ignored. This data informs a content refresh, breaking up text with images and improving CTA placement to increase read time and conversions.
Validate UI/UX Design Changes
A UX designer proposes a new navigation menu. Before committing development resources, they implement the new design for a segment of users. They then compare heatmaps and session recordings of the old vs. new design. The data shows users find key pages faster with the new navigation. This evidence-based approach validates the design decision and secures stakeholder buy-in for a full rollout.
Collecting In-Context User Feedback
A product team is unsure about which feature to build next. Instead of relying on external surveys, they use an on-page feedback widget from their User Behavior tool. They can trigger a short poll asking 'What feature would help you most?' to appear for highly engaged users. This provides immediate, contextual feedback from their actual user base, helping them prioritize their product roadmap effectively and build features that users truly need.
Reduce Form Abandonment on Lead Pages
A marketing team is running a campaign with a lead generation form, but the conversion rate is low. Using form analytics, they discover that many users hesitate on the 'Phone Number' field and a significant number drop off at the 'Company Size' dropdown. They decide to make the phone number optional and simplify the company size options. This reduces friction and increases the form submission rate by over 20%.