
Streamlit
Data Visualization
AI TOOL COMPARISON
What is the difference, and which fits your workflow? Compare features, usage, pricing models and traffic side by side.
Data Visualization
Data Visualization
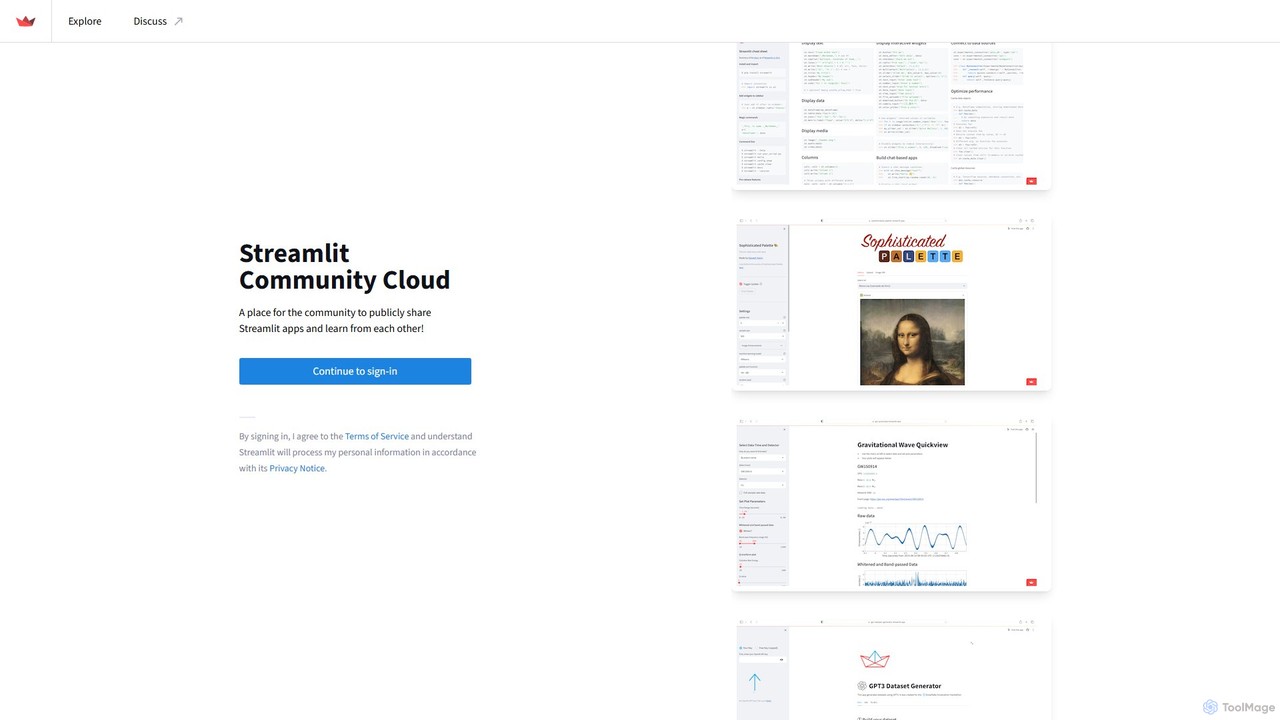
Streamlit is an open-source Python framework that enables developers and data scientists to build and share beautiful, custom web apps for machine learning and data science in minutes. The Streamlit Community Cloud provides a free platform to deploy, manage, and share these public applications with the world, fostering a collaborative environment for innovation.
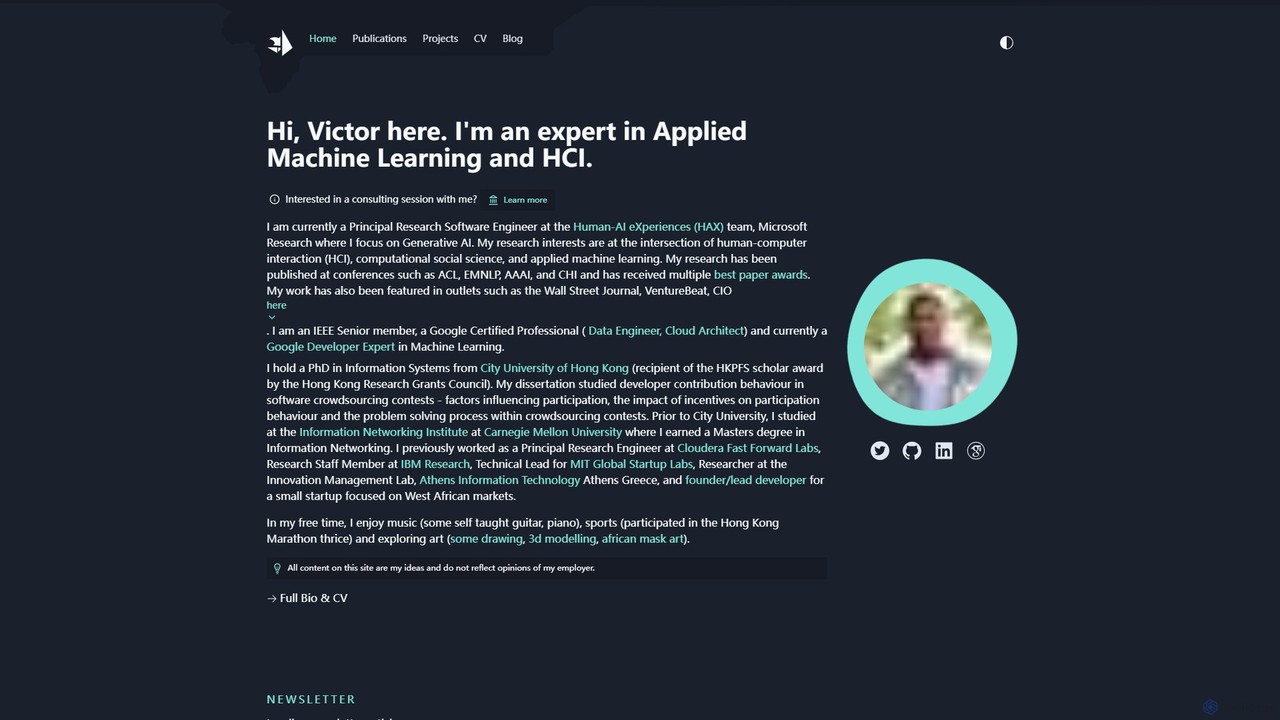
A comprehensive resource hub by Victor Dibia, a leading researcher in Applied ML and HCI. It features open-source AI tools like AutoGen Studio and LIDA, in-depth articles, research papers, and talks on generative AI, multi-agent systems, and human-computer interaction. A valuable platform for developers, researchers, and AI enthusiasts.
Compare product focus, pricing models and audiences. Highlighted rows indicate different listed information; unknown pricing does not mean free.
| Quick facts | Streamlit | victordibia |
|---|---|---|
| Pricing model | Freemium | Free |
| Product type | Web | Web |
| Primary focus | Data Visualization | Data Visualization |
| Audience and roles | No data available | No data available |
| Categories | Data Visualization · Low Code No Code · App Builder | Data Visualization · Low Code No Code · Research · Writing |
| Added | Aug 17, 2025 | Aug 4, 2025 |
| Updated | Nov 19, 2026 | Nov 19, 2026 |
Explore the listed product descriptions, features and workflows. Taxonomy labels alone are not feature evaluations.
Streamlit is a revolutionary open-source Python library that makes it incredibly simple to create and share interactive, custom web applications for data science and machine learning projects. It's designed for data scientists and engineers who want to turn their data scripts into shareable web apps without needing extensive front-end development experience. Paired with the Streamlit Community Cloud, it offers a complete ecosystem for building, deploying, and discovering data-centric applications.
The core philosophy of Streamlit is to allow you to build an app as easily as you write a Python script. It treats widgets as variables, and any change in the code or user interaction instantly reruns the script from top to bottom, ensuring the app is always up-to-date. This simplicity accelerates the development process, enabling you to go from a concept to a deployed application in a fraction of the time it would take with traditional web frameworks.
Using Streamlit is a straightforward process designed for Python developers:
pip install streamlit.app.py). Use Streamlit's functions like st.title(), st.write(), st.slider(), or st.button() to add text, data, and interactive widgets to your app.streamlit run app.py in your terminal. A new tab will open in your browser with your live application.requirements.txt file (listing all necessary Python libraries) into a public GitHub repository.@st.cache_data and @st.cache_resource) prevents re-computation of expensive operations, making apps fast and efficient.Streamlit's versatility makes it suitable for a wide range of applications, from simple data explorers to complex machine learning dashboards.
The primary advantage of Streamlit is its unparalleled speed and simplicity. It dramatically lowers the barrier to entry for creating web applications, empowering data professionals to share their work without becoming web developers. The tight integration with the Python data science ecosystem means you can leverage your existing skills and favorite libraries. The free Community Cloud platform removes the complexities of deployment and hosting, making it effortless to share your work with the community, collaborators, or potential employers.
Streamlit is fundamentally a free and open-source tool. The Python library is completely free to use. The Streamlit Community Cloud is also a free service, offering hosting for public applications with generous resource limits. For users and organizations requiring private applications, enhanced security, more computational resources, and enterprise-grade features, Snowflake (which acquired Streamlit) offers paid hosting solutions as part of its platform. This freemium model ensures that individual developers, students, and the open-source community can build and share freely, while businesses have a scalable path for their production needs.
Victor Dibia's website serves as a central hub and portfolio for his extensive work in the fields of Applied Machine Learning (ML) and Human-Computer Interaction (HCI). As a Principal Research Software Engineer at Microsoft Research, Victor focuses on cutting-edge areas like Generative AI and multi-agent systems. This platform is not a single application but rather a rich ecosystem of open-source projects, insightful articles, academic publications, and technical talks. It provides a direct window into the mind of a leading expert, offering invaluable resources for anyone interested in the practical application and theoretical underpinnings of modern AI.
The site meticulously documents his journey and contributions, from his award-winning research papers at top conferences like ACL and CHI to his practical, open-source tools that empower developers and researchers worldwide. It's a testament to his expertise, recognized by his status as a Google Developer Expert in Machine Learning and an IEEE Senior member. The content bridges the gap between complex academic research and real-world implementation, making it an essential destination for both seasoned professionals and aspiring learners in the AI space.
To leverage the resources on Victor Dibia's website, users can navigate through its well-organized sections:
The platform is valuable for a diverse audience:
All the resources on the Victor Dibia website, including his blog, research papers, and open-source projects (like AutoGen Studio and LIDA), are available completely free of charge. He does mention the availability of consulting sessions, for which interested parties would need to reach out directly for details.
Their taxonomy shows where the products overlap and where each one has a more distinct focus. Unknown fields are shown explicitly and are never filled with assumptions.
Traffic is shown on the same scale so differences in market visibility are not visually understated.
Both charts share the same months and vertical scale. Each tool identifies its latest reporting month; missing months are left blank, not counted as zero. Regional and source visit counts are estimates calculated from the reported shares.
| Country/region | Percentage | Estimated visits |
|---|---|---|
| 🇺🇸United States | 44.68% | 410.4K |
| 🇮🇳India | 25.68% | 235.9K |
| 🇰🇷Korea, Republic of | 12.59% | 115.6K |
| 🇬🇧United Kingdom | 8.9% | 81.7K |
| 🇵🇰Pakistan | 8.15% | 74.9K |
| Source type | Percentage | Estimated visits |
|---|---|---|
| Direct | 57.82% | 531.1K |
| Referral | 40.37% | 370.8K |
| 1.81% | 16.6K |
| Country/region | Percentage | Estimated visits |
|---|---|---|
| 🇺🇸United States | 37.7% | 8.5K |
| 🇮🇳India | 25.61% | 5.7K |
| 🇻🇳Vietnam | 14.63% | 3.3K |
| 🇬🇧United Kingdom | 11.38% | 2.6K |
| 🇮🇩Indonesia | 10.68% | 2.4K |
Ratings, comments, favorites, and likes are community signals—not a substitute for product fit.
This page is assembled from ToolMage product listings, taxonomy, traffic statistics and on-site user feedback. It is not a hands-on test or an independent review.