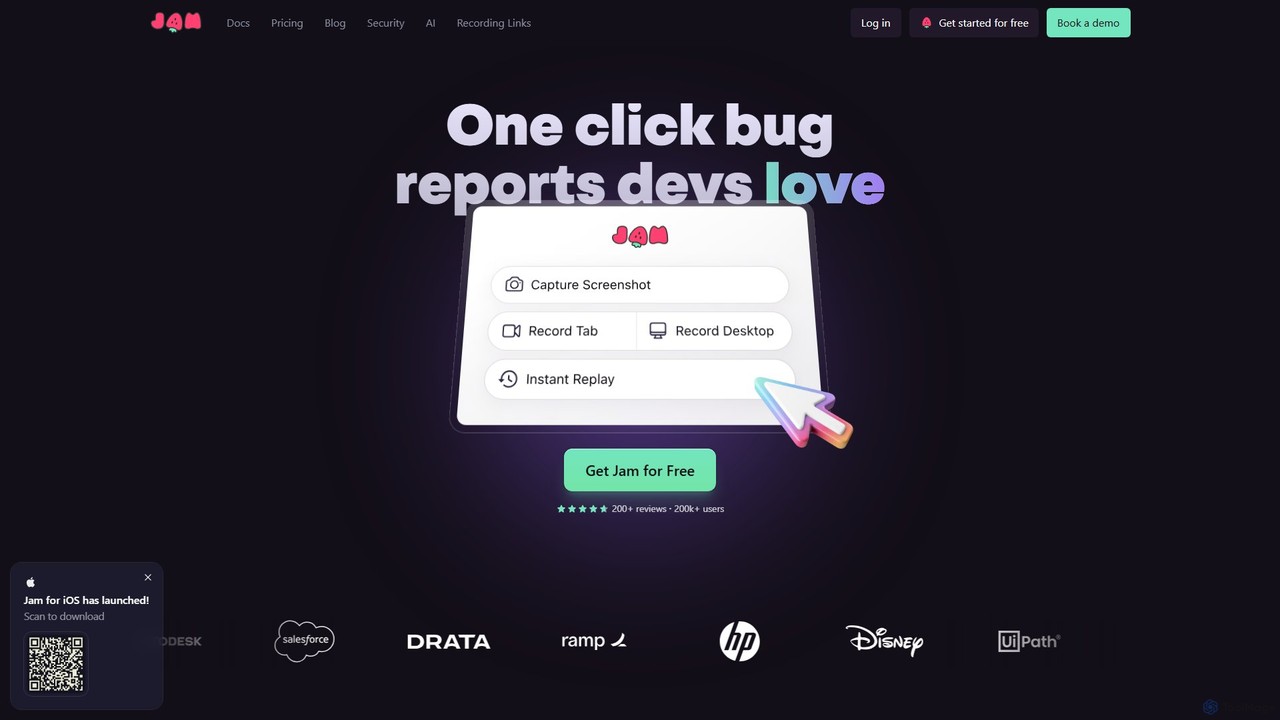
AI Debugging tools are a specialized type of AI Code Assistant focused on intelligently identifying, analyzing, and resolving errors in software code. They utilize machine learning models to understand code context, trace complex execution paths, and suggest accurate solutions beyond simple syntax checks. These tools accelerate the development cycle by automating tedious diagnostic tasks and providing deep insights into the root causes of bugs, significantly reducing time spent on troubleshooting.
Core Features
- Intelligent Error Analysis: Goes beyond standard error messages to provide contextual explanations of why a bug is occurring.
- Root Cause Suggestion: Automatically analyzes stack traces and code changes to pinpoint the likely origin of an error.
- Context-Aware Fix Generation: Proposes code snippets to resolve bugs that are consistent with the existing codebase's style and logic.
- Automated Log Analysis: Sifts through vast amounts of log data to identify patterns and anomalies related to specific issues.
Use Cases
These tools are invaluable for software developers, QA engineers, and SREs working on complex applications, microservices architectures, or legacy systems. They are particularly effective in scenarios requiring rapid incident response in production environments or when onboarding new developers to an unfamiliar codebase, helping them understand error flows quickly.
How to Choose
When selecting an AI Debugging tool, consider its integration with your existing IDE and CI/CD pipeline. Evaluate the breadth of supported programming languages and frameworks. Also, assess the depth of its analysis capabilities (e.g., static, dynamic, or both) and whether it offers collaborative features for team-based troubleshooting.