
ToolMage
Sign in

Best 1 Business Intelligence AI tools for Artificial Intelligence

Popular Business Intelligence AI tools in Artificial Intelligence include Feasy, helping you work more efficiently.

Feasy
Paid

Feasy

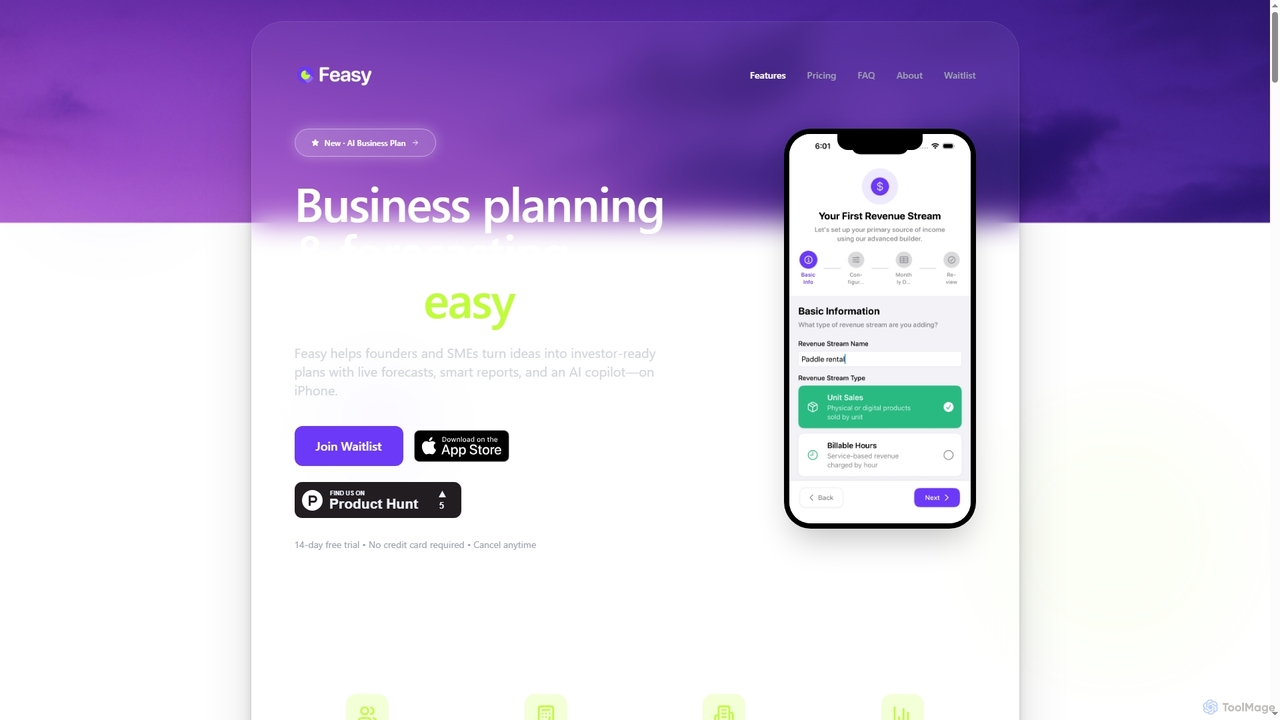
Feasy is an AI-powered platform designed to simplify business planning and financial forecasting for founders and SMEs. It helps transform ideas into investor-ready business plans with live forecasts, smart financial reports, and an AI copilot, available on iPhone. Trusted by over 4,000 startups, Feasy streamlines complex financial modeling and report generation, enabling quick, professional insights.

3D
Visits 5.1KFavorites 86Likes 116

About Business Intelligence

Business Intelligence (BI) tools are a class of software that transforms raw data into actionable insights for informed decision-making. Leveraging AI, these platforms automate data collection, analysis, and visualization, presenting complex information through interactive dashboards and reports. They empower organizations to track key performance indicators (KPIs), identify market trends, and optimize business operations. Modern BI tools often incorporate machine learning for predictive forecasting and natural language processing for intuitive data queries.

Core Features

  • Interactive Dashboards: Consolidate multiple data sources into a single, customizable visual interface for real-time monitoring.
  • Data Visualization: Generate charts, graphs, maps, and other visual representations to reveal patterns and trends in data.
  • Automated Reporting: Schedule and automatically generate regular reports on key business metrics, saving manual effort.
  • Natural Language Query (NLQ): Ask questions about data in plain language and receive instant answers and visualizations.
  • Predictive Analytics: Utilize AI and machine learning models to forecast future outcomes based on historical data.

Use Cases

BI tools are widely used across sectors like retail, finance, healthcare, and manufacturing. Marketing teams use them to analyze campaign performance, sales departments track sales funnels and forecasts, and operations managers monitor supply chain efficiency. Executives rely on high-level dashboards for strategic planning and performance overviews.

How to Choose

When selecting a BI tool, consider its data source connectivity and integration capabilities with your existing systems. Evaluate the ease of use for non-technical users versus the advanced features required by data analysts. Also, assess the platform's scalability to handle growing data volumes and the pricing model, whether it's per-user or based on usage.

Business Intelligence use cases

1

Sales Performance Monitoring and Forecasting

A sales manager connects a BI tool to their CRM system. They create a dashboard to track real-time sales figures, conversion rates by region, and individual team member performance. Using the AI-powered forecasting feature, they can predict quarterly revenue and identify potential shortfalls, allowing for proactive strategy adjustments and resource allocation to underperforming areas.

2

Marketing Campaign ROI Analysis

A digital marketing specialist integrates data from Google Analytics, social media platforms, and ad networks into a BI tool. They build a dashboard to visualize the entire customer journey, attribute conversions to specific campaigns, and calculate the return on investment (ROI) for each marketing channel. This helps them optimize ad spend and focus on high-performing strategies.

3

Operational Efficiency Optimization in Manufacturing

An operations manager in a factory connects the BI tool to IoT sensors on the production line and the ERP system. They monitor machine uptime, production output, and defect rates in real-time. The tool helps identify bottlenecks and patterns in equipment failure, enabling predictive maintenance to be scheduled before a breakdown occurs, thus reducing downtime and improving overall equipment effectiveness (OEE).

4

Financial Health and Budget Tracking

A finance department uses a BI tool to consolidate data from accounting software, expense reports, and budget spreadsheets. They create comprehensive financial dashboards to monitor cash flow, track departmental spending against budgets in real-time, and generate automated monthly profit and loss (P&L) statements for stakeholders, ensuring financial transparency and control.

5

Customer Behavior Analysis for E-commerce

An e-commerce analyst connects a BI platform to their online store's database. They analyze customer purchase history, browsing patterns, and cart abandonment rates. These insights are used to create targeted promotions, personalize product recommendations with AI, and identify friction points in the checkout process, ultimately leading to higher conversion rates and increased customer lifetime value.

6

Human Resources Workforce Analytics

An HR manager utilizes a BI tool to analyze employee data from their HRIS. They create dashboards to track key metrics like employee turnover rates, time-to-hire, and diversity statistics. This data-driven approach helps in identifying retention issues, improving recruitment processes, and ensuring fair compensation practices by visualizing salary data across different roles and demographics.

Business Intelligence FAQ

What is Business Intelligence (BI)?

Business Intelligence (BI) refers to the technologies and practices for collecting, integrating, analyzing, and presenting business information. AI-powered BI tools automate this process, transforming raw data into meaningful insights that help organizations make smarter, data-driven decisions. Key components include data visualization, interactive dashboards, and reporting.

How do I choose the right Business Intelligence tool?

To choose the right BI tool, consider these factors:

  • Data Connectivity: Ensure it can connect to all your essential data sources (databases, cloud apps, spreadsheets).
  • Ease of Use: Evaluate if it's intuitive for business users or powerful enough for data analysts.
  • Scalability: Check if the tool can handle your growing data volume and user base.
  • Features: Determine if you need basic reporting or advanced features like AI-driven predictive analytics.
  • Cost: Compare pricing models (per-user, usage-based) to fit your budget.
What's the difference between Business Intelligence and Data Analytics?

Business Intelligence (BI) primarily focuses on descriptive analytics, answering 'what happened' using historical and current data, often presented in dashboards. Data Analytics is a broader term that includes BI but also encompasses diagnostic ('why it happened'), predictive ('what will happen'), and prescriptive ('what should we do') analytics. Modern BI tools are increasingly incorporating these advanced analytics capabilities.

Who uses Business Intelligence tools in a company?

BI tools are used by a wide range of roles. Executives and managers use high-level dashboards for strategic oversight. Business analysts and data analysts perform deep-dive analyses to uncover insights. Sales, marketing, finance, and operations teams use them to track performance against their specific goals. The trend is towards 'self-service BI,' empowering non-technical employees to access and analyze data themselves.

How does AI enhance Business Intelligence?

AI significantly enhances BI by automating complex tasks and uncovering deeper insights. Key AI contributions include:

  • Automated Insights: AI algorithms can automatically detect trends, anomalies, and correlations in data that a human might miss.
  • Predictive Analytics: Machine learning models forecast future outcomes, such as sales revenue or customer churn.
  • Natural Language Processing (NLP): Allows users to ask questions about their data in plain language and get instant visualizations.