Mermaid Online
Mermaid Online is an advanced web-based editor and AI-powered diagram generator that transforms text descriptions and Mermaid syntax …
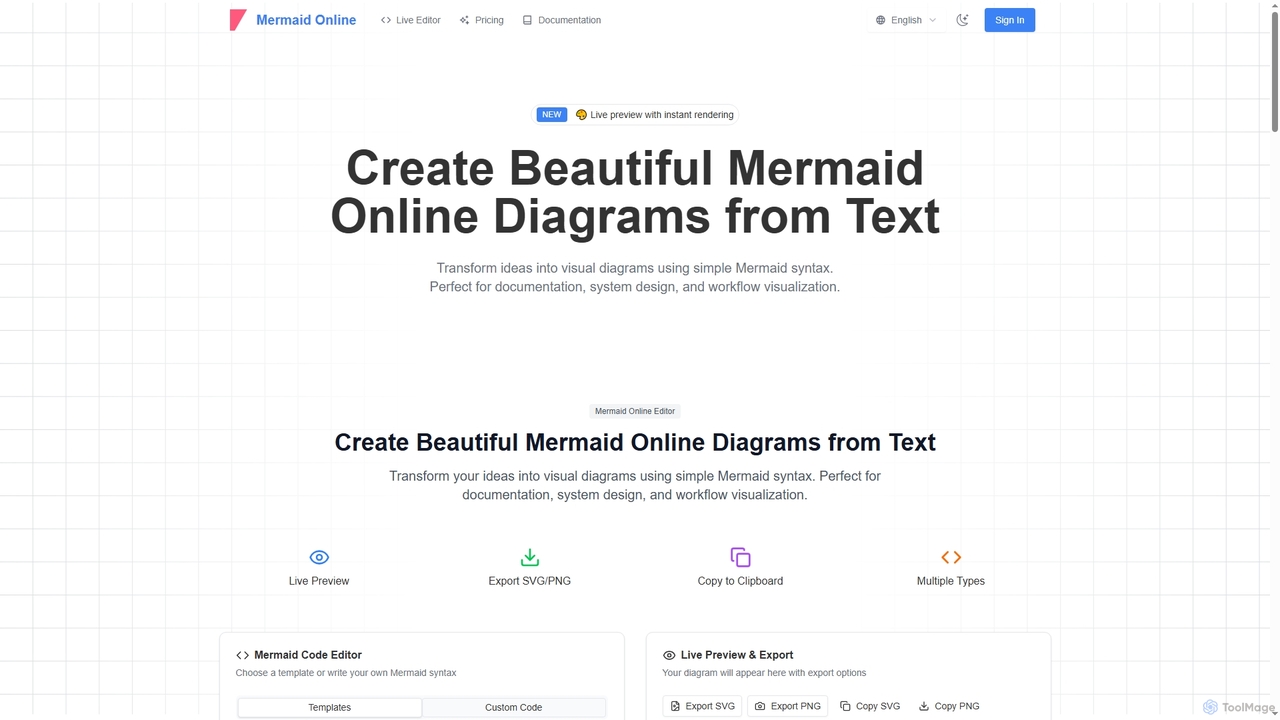
Mermaid Online is an advanced web-based editor and AI-powered diagram generator that transforms text descriptions and Mermaid syntax into professional visual diagrams. It supports various diagram types, offers real-time preview, and flexible export options, streamlining documentation and system design workflows for individuals and teams.
About Text To Diagram
Text To Diagram tools are a specialized category of AI-powered applications that transform natural language descriptions and structured text into various visual diagrams. Leveraging advanced Natural Language Processing (NLP), these tools interpret user input to automatically generate flowcharts, mind maps, sequence diagrams, and more. They significantly streamline the visualization process, making complex information easier to understand and communicate across different domains.
Core Features
- Natural Language Input: Converts plain text, markdown, or code-like syntax into diagrams.
- Multi-Diagram Support: Generates a wide range of diagram types, including flowcharts, sequence diagrams, class diagrams, and mind maps.
- Real-time Preview: Offers instant visual feedback as text input is modified.
- Customization Options: Allows users to adjust styles, colors, and layouts to match branding or preferences.
- Export Capabilities: Supports exporting diagrams in various formats like SVG, PNG, JPEG, or PDF for easy sharing and integration.
Use Cases
These tools are invaluable for professionals across various sectors, including software development, business analysis, education, and project management. They are used to quickly visualize system architectures, map out business processes, illustrate complex concepts in educational materials, or rapidly prototype ideas during brainstorming sessions.
How to Choose
When selecting a Text To Diagram tool, consider the range of supported diagram types that align with your needs, the accuracy of its natural language interpretation, and the flexibility of its customization options. Evaluate its integration capabilities with existing workflows and tools, the available export formats, and its overall ease of use for your team. Pricing models and community support are also important factors to weigh.
Text To DiagramUse Cases
Streamlining Software Architecture Documentation
Software developers and architects often need to create and update complex system diagrams. Using a Text To Diagram tool, they can write simple text descriptions or use lightweight markup languages (like Mermaid or PlantUML) to define components, relationships, and data flows. The tool instantly generates visual diagrams, saving hours of manual drawing and ensuring documentation stays synchronized with code changes, facilitating clearer communication within development teams.
Documenting Software Architecture
Software architects and developers can input text descriptions of system components, their relationships, and data flows to automatically generate detailed flowcharts, sequence diagrams, and class diagrams. This accelerates the documentation process, ensures consistency, and helps communicate complex system designs clearly to team members and stakeholders, reducing manual drawing effort by up to 70%.
Rapid Prototyping of Business Processes
Business analysts and project managers frequently map out new or existing business processes. Instead of dragging and dropping shapes, they can describe the steps, decisions, and outcomes in plain text. The Text To Diagram tool then visualizes these processes as flowcharts or BPMN diagrams, allowing for quick iteration and feedback during the design phase. This accelerates process definition and helps identify bottlenecks early on.
Visualizing Business Processes
Business analysts and project managers can describe operational workflows, decision points, and stakeholder interactions in text. The tool then converts this into clear process flowcharts or BPMN diagrams. This facilitates process optimization, identifies bottlenecks, and ensures all team members have a shared understanding of how tasks are executed, saving significant time in diagram creation.
Enhancing Educational Content with Visuals
Educators and content creators often struggle to make abstract concepts engaging. With Text To Diagram tools, they can convert lesson outlines, scientific processes, or historical timelines described in text into clear, concise diagrams. This provides students with visual aids that reinforce learning, improve comprehension, and make study materials more accessible and memorable, without requiring graphic design skills.
Creating Educational Content
Educators and trainers can quickly generate visual aids for their lessons by inputting outlines, key concepts, or step-by-step instructions. Text To Diagram tools can produce mind maps, concept maps, or organizational charts that help students grasp complex topics more easily. This enhances learning engagement and retention, allowing educators to focus more on content delivery rather than design.
Generating Mind Maps for Brainstorming Sessions
Individuals and teams conducting brainstorming sessions can use Text To Diagram tools to quickly capture ideas and organize them visually. By simply listing keywords and hierarchical relationships in text, the tool automatically creates a mind map. This allows participants to focus on idea generation rather than formatting, helping to structure thoughts, identify connections, and develop concepts more effectively during collaborative meetings.
Brainstorming and Idea Visualization
Product managers and creative professionals can use these tools to rapidly structure and visualize ideas during brainstorming sessions. By simply typing keywords, concepts, and their relationships, users can instantly generate mind maps or affinity diagrams. This helps in organizing thoughts, identifying connections, and fostering collaborative idea development without the friction of manual drawing, leading to more productive sessions.
Automating Network Topology Visualization
IT professionals and network engineers need accurate network diagrams for planning, troubleshooting, and documentation. By feeding network configurations or device lists in a structured text format, Text To Diagram tools can automatically generate detailed network topology maps. This reduces the labor-intensive process of manual diagramming, ensures diagrams reflect the current network state, and aids in faster problem diagnosis and infrastructure management.
Illustrating Technical Reports
Technical writers and researchers often need to include clear diagrams in their reports to explain complex methodologies, experimental setups, or data processing flows. Text To Diagram tools allow them to generate precise block diagrams, data flow diagrams, or state diagrams directly from text descriptions. This ensures accuracy, maintains a consistent visual style, and significantly reduces the time spent on creating illustrations for publications and presentations.
Creating Sequence Diagrams for API Interactions
Backend developers and API designers often need to illustrate the sequence of interactions between different services or components in an application. Using a Text To Diagram tool, they can describe the message flow and participants in a textual format (e.g., using PlantUML sequence diagram syntax). The tool then renders a clear sequence diagram, which is crucial for understanding complex API calls, debugging issues, and documenting system behavior for other team members.
Summarizing Meeting Notes Visually
Team leads and meeting facilitators can transform lengthy meeting minutes or discussion points into concise visual summaries. By inputting key decisions, action items, and responsible parties, the tool can generate decision trees or action item flowcharts. This helps in quickly disseminating information, ensuring accountability, and providing a clear overview of meeting outcomes, making follow-ups more efficient and reducing miscommunication.