ToolMage
Sign in

Best 13 Diagramming AI tools for Design

Popular Diagramming AI tools in Design include Wondershare, tldraw, Boardmix, boardmix, MyMap, Mermaid Online, xtenav, Jeda.ai, Docuopia, and FlowDyno, helping you work more efficiently.

FlowDyno
Freemium

FlowDyno

FlowDyno is an AI-powered tool that transforms natural language descriptions into dynamic, animated architecture diagrams. It simplifies complex diagramming workflows, offering one-click export and a rich library of technical icons.

Diagramming
Visits 5.5KFavorites 103Likes 110
Mermaid Online
Paid

Mermaid Online

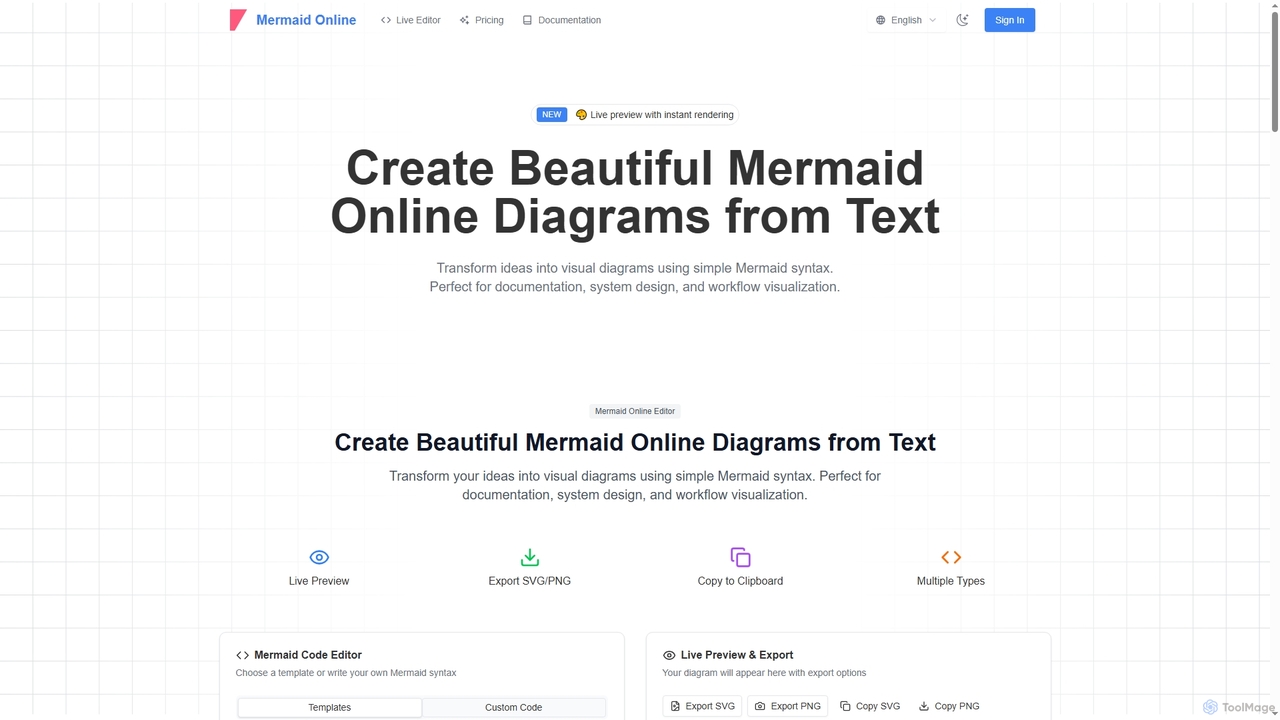
Mermaid Online is an advanced web-based editor and AI-powered diagram generator that transforms text descriptions and Mermaid syntax into professional visual diagrams. It supports various diagram types, offers real-time preview, and flexible export options, streamlining documentation and system design workflows for individuals and teams.

Text To Diagram
Visits 179.2KFavorites 114Likes 113
Wondershare
Freemium

Wondershare

Wondershare offers a comprehensive suite of AI-powered software for creativity, productivity, and utility. From the advanced video editor Filmora and AI content generator ToMoviee to the powerful PDFelement and data recovery tools, Wondershare simplifies digital experiences for millions of users worldwide. It provides intuitive, powerful solutions for content creators, businesses, and individuals to create, manage, and secure their digital assets with ease.

Diagramming
Visits 11MFavorites 100Likes 133
Wondershare
Freemium

Wondershare

Wondershare offers a comprehensive suite of AI-powered creative and productivity software. From the industry-leading Filmora video editor to the intelligent PDFelement and versatile Edraw diagramming tools, Wondershare empowers creators, professionals, and students to bring their ideas to life. Its integrated AI features streamline workflows, automate complex tasks, and unlock new creative possibilities in video, document management, and visual communication.

Diagramming
Visits 151.9KFavorites 129Likes 105
Boardmix
Freemium

Boardmix

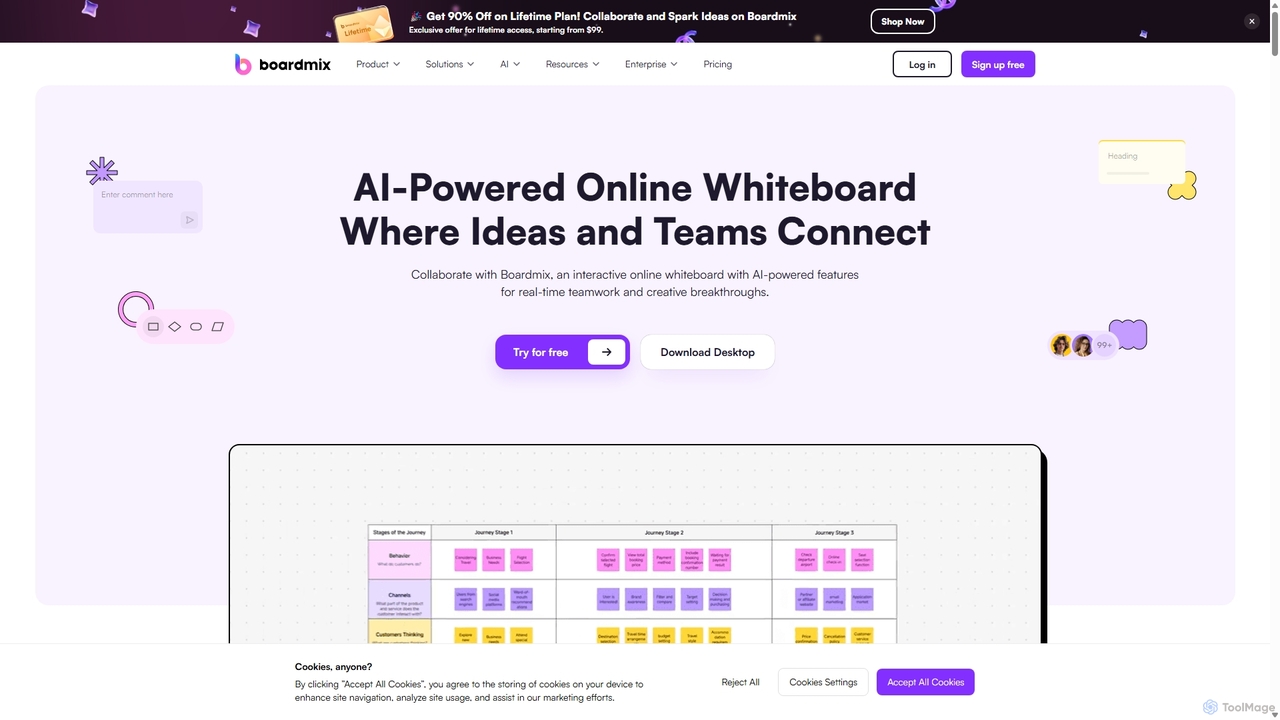
Boardmix is an AI-powered online collaborative whiteboard designed to connect ideas and teams. It integrates tools for mind mapping, diagramming, brainstorming, and project management into a single infinite canvas, facilitating real-time teamwork and creative breakthroughs for various professional teams.

Project Management
Visits 569.8KFavorites 153Likes 142
tldraw
Freemium

tldraw

tldraw is a free, AI-powered collaborative whiteboard that transforms your rough sketches into functional code and polished diagrams. With its 'Make Real' feature, it's an essential tool for developers, designers, and teams to brainstorm, prototype, and innovate with unprecedented speed.

Brainstorming
Visits 938KFavorites 131Likes 124
boardmix
Freemium

boardmix

boardmix is an AI-powered collaborative online whiteboard designed to enhance team creativity and productivity. It integrates AIGC, mind mapping, flowcharts, and real-time collaboration tools into a single, infinite canvas, making it an all-in-one solution for brainstorming, project management, and visual communication.

Project Management
Visits 370.2KFavorites 128Likes 127
VisFlow
Freemium

VisFlow

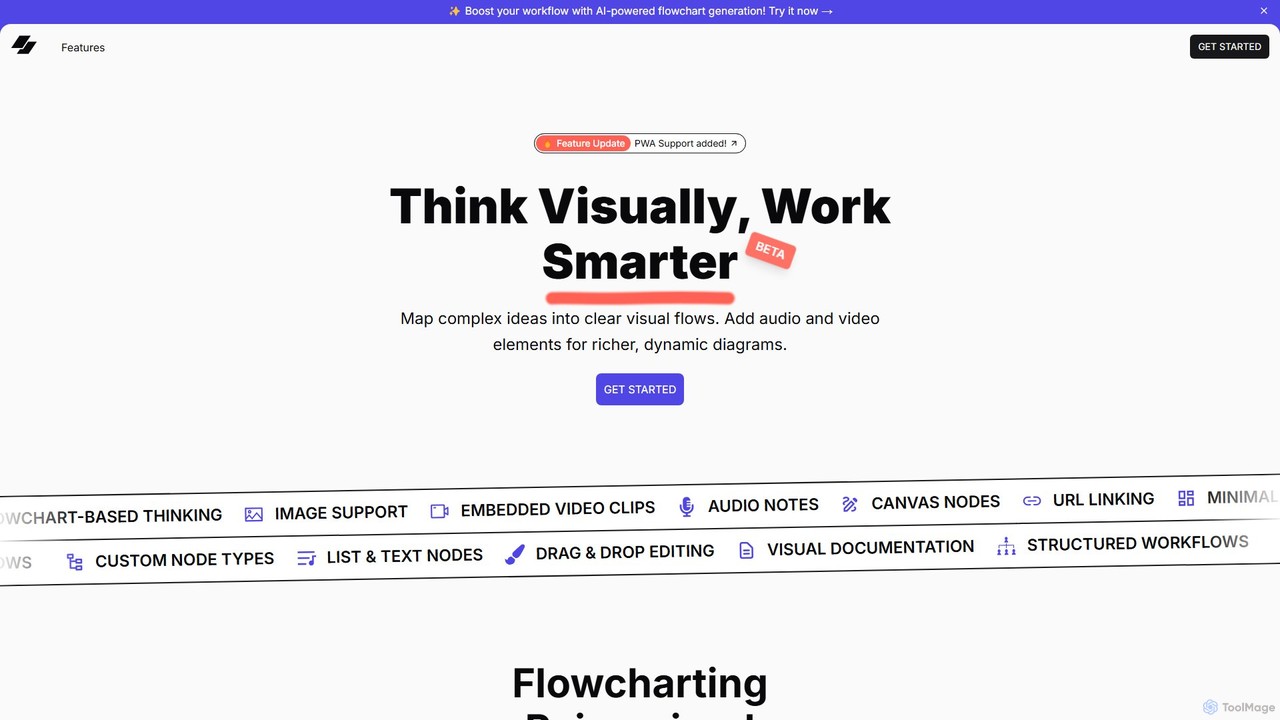
VisFlow is an AI-powered visual workspace that redefines flowcharting and mind mapping by integrating rich multimedia. It allows users to embed images, audio, and video directly into their diagrams, fostering a more dynamic and contextual way to brainstorm, plan, and collaborate. With a focus on privacy through local-first storage and an intuitive drag-and-drop interface, VisFlow is designed for creatives, educators, and teams who think visually.

Whiteboard
Visits 5.4KFavorites 107Likes 136
MyMap
Freemium

MyMap

MyMap is an AI-native diagramming tool that transforms text, files, and web content into visual formats like mind maps, flowcharts, and presentations. Simply chat with the AI to generate, edit, and collaborate on diagrams in real-time. It's designed for visual thinkers to quickly structure ideas, plan projects, and create engaging content without manual design work.

Planning
Visits 188.2KFavorites 125Likes 133
FlowCraft
Paid

FlowCraft

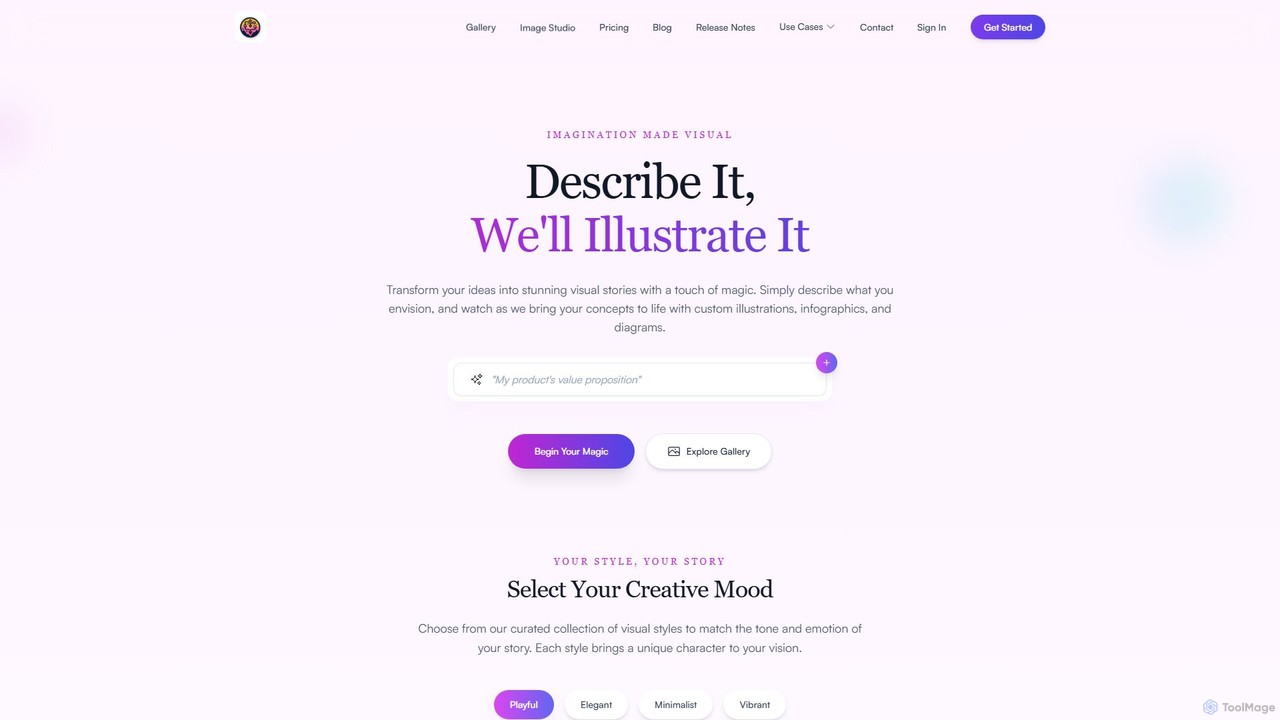
FlowCraft is an AI-powered platform that transforms text descriptions into stunning visual content like diagrams, infographics, and illustrations. Simply describe your idea, and FlowCraft generates professional-quality visuals in various styles. It's ideal for professionals and creators who need to visualize complex information quickly, without any design skills.

Diagramming
Visits 5.3KFavorites 179Likes 152
Jeda.ai
Freemium

Jeda.ai

Jeda.ai is a multimodal generative visual AI workspace designed to enhance productivity and collaboration. It allows users to instantly generate editable flowcharts, wireframes, visual templates, and data analyses from text prompts, documents, or data files, all within a collaborative online whiteboard.

Diagramming
Visits 45KFavorites 141Likes 134
Docuopia
Freemium

Docuopia

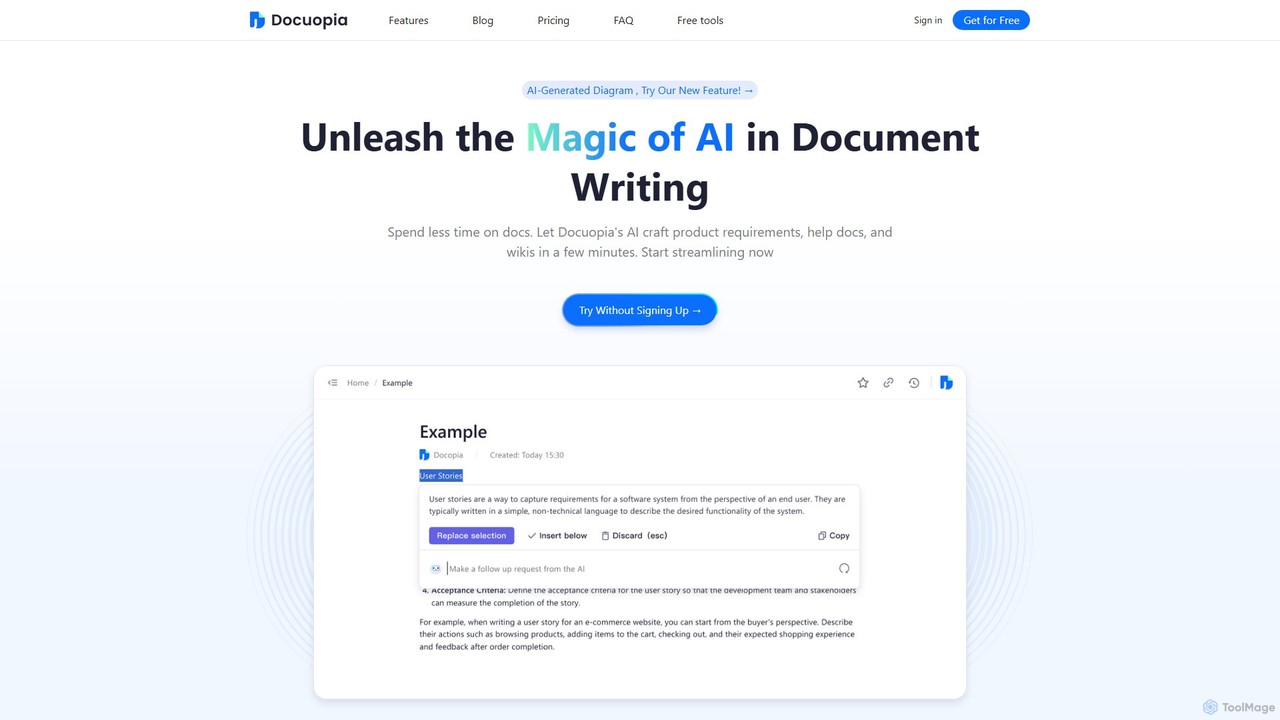
Docuopia is an AI-powered document collaboration platform designed to streamline the creation of technical and business documents. It helps teams generate product requirements documents (PRDs), help articles, wikis, and professional diagrams in minutes. By leveraging AI for drafting, refining, and visualizing content, Docuopia significantly reduces documentation time, enhances content quality, and fosters real-time collaboration.

Diagramming
Visits 7KFavorites 145Likes 136
xtenav
Freemium

xtenav

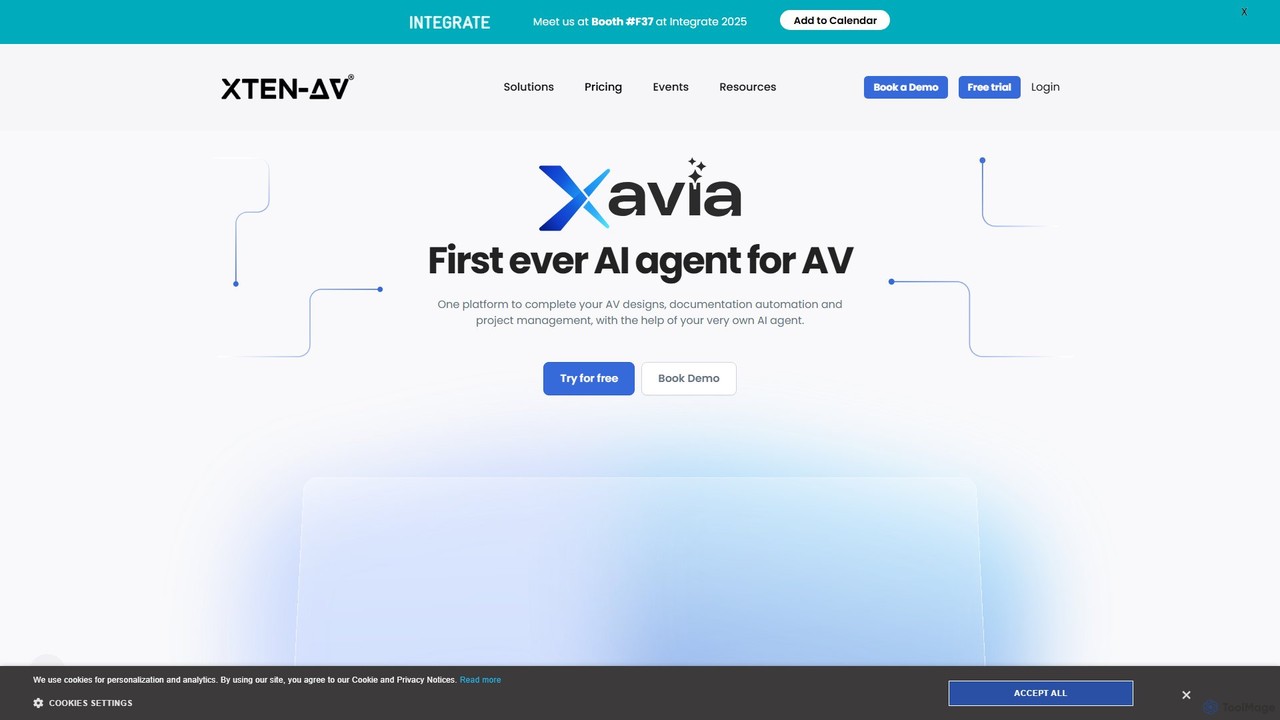
XTEN-AV is a revolutionary AI-powered, cloud-based platform for the audio-visual (AV) industry. It streamlines the entire workflow for AV professionals by automating system design, proposal generation, and project management. Featuring an AI agent named XAVIA, it helps users create complex drawings, accurate Bill of Materials (BOMs), and winning proposals in a fraction of the time, consolidating multiple tools into one efficient solution.

Diagramming
Visits 46.9KFavorites 145Likes 156

About Diagramming

AI Diagramming tools are a class of software that uses artificial intelligence to automate the creation and optimization of visual diagrams. These tools interpret text prompts, structured data, or even code to generate flowcharts, mind maps, and technical schematics automatically. Their primary value lies in rapidly transforming complex information, processes, and systems into clear, well-structured visual representations, significantly reducing manual effort. This allows teams to brainstorm, document, and communicate ideas with greater speed and clarity.

Core Features

  • Text-to-Diagram Generation: Converts natural language descriptions or outlines into structured diagrams like flowcharts or mind maps.
  • Automated Layout & Formatting: Intelligently arranges elements, connectors, and spacing for optimal readability and aesthetic appeal.
  • Smart Suggestions: Recommends next steps, appropriate shapes, or logical connections based on the diagram's context.
  • Data-to-Diagram Conversion: Automatically generates diagrams such as ERDs or org charts from data sources like CSVs or databases.
  • Code-based Diagramming: Creates visual diagrams from simple syntax or code (e.g., Mermaid, PlantUML), ideal for technical documentation.

Use Cases

AI Diagramming tools are widely used in software development for creating UML diagrams and system architecture maps. Business analysts and project managers use them for process modeling (BPMN) and visualizing project timelines. They are also valuable in education for explaining complex concepts and in IT for documenting network infrastructure.

How to Choose

When selecting an AI Diagramming tool, consider the specific diagram types you need (e.g., UML, ERD, flowchart). Evaluate the input methods available, such as text-to-diagram, data import, or integration with services like GitHub. Also, assess its collaboration features, export options, and integration capabilities with your existing workflow tools like Confluence or Jira.

Featured tool rankings

Diagramming use cases

1

Automating Software Architecture Documentation

A software architect needs to create and maintain up-to-date diagrams for a complex microservices system. Instead of manually drawing dozens of components and connections in a traditional tool, they use an AI diagramming tool with code-based input. By writing simple Mermaid or PlantUML syntax directly within their Markdown documentation files, they can describe the services, databases, and API interactions. The tool automatically renders these descriptions into clean, professional component and sequence diagrams. This approach ensures that the documentation always matches the code, as updating the diagram is as simple as editing a few lines of text, saving hours of manual redrawing during each development cycle.

2

Rapid Business Process Mapping from Text

A business analyst is tasked with documenting a company's customer support workflow. They conduct interviews and gather notes describing the process step-by-step. Using an AI diagramming tool's text-to-diagram feature, they paste their structured notes (e.g., 'Step 1: Customer submits a ticket via email. Step 2: Ticket is assigned to an agent. Step 3: If issue is technical, escalate to Tier 2.'). The AI instantly generates a professional BPMN flowchart, correctly identifying decision points, processes, and actors. The analyst can then quickly refine the auto-generated layout, share it with stakeholders for feedback, and finalize the documentation in a fraction of the time it would take to build the chart from scratch.

3

Visualizing Database Schemas from SQL

A database administrator (DBA) needs to understand the structure of a legacy database with hundreds of tables and complex relationships. Manually tracing foreign keys and dependencies is time-consuming and error-prone. The DBA uses an AI diagramming tool that can import a SQL schema file. Upon uploading the file, the tool parses the 'CREATE TABLE' statements and foreign key constraints, then automatically generates a complete and accurate Entity-Relationship Diagram (ERD). The AI-powered layout engine arranges the tables to minimize line crossings, making the relationships easy to follow. This provides the DBA with an instant, clear overview of the entire database architecture, facilitating maintenance, optimization, and migration planning.

4

Brainstorming and Organizing Ideas with Mind Maps

A marketing team is planning a new product launch campaign. They start by listing all their ideas for channels, messaging, target audiences, and content in a simple text document. To structure this information, the team lead pastes the entire list into an AI diagramming tool. The AI analyzes the text, identifies hierarchical relationships and themes, and instantly organizes the raw ideas into a coherent, multi-level mind map. This visual representation helps the team see connections they might have missed, identify gaps in their plan, and collaboratively rearrange branches by simply dragging and dropping. The process turns a chaotic list of ideas into an actionable plan in minutes.

5

Generating Educational Flowcharts for Complex Topics

An educator is preparing a lesson on the process of cellular respiration for high school students. To make the complex biochemical pathway easier to understand, they want to create a visual flowchart. Instead of spending hours designing it, they type a clear, step-by-step description into an AI diagramming tool: 'Start with Glucose. Glycolysis splits Glucose into Pyruvate, producing ATP and NADH. If oxygen is present, Pyruvate enters the Krebs Cycle...'. The AI interprets this biological process and generates a logically structured flowchart with appropriate labels and directional arrows. The educator can then customize colors and add icons, creating an engaging and accurate teaching aid in a fraction of the time, allowing them to focus more on the lesson content itself.

6

Auto-Generating Cloud Infrastructure Diagrams

A DevOps team manages a large-scale cloud environment on AWS. Manually keeping network topology and resource diagrams up-to-date is nearly impossible due to constant changes. They use a specialized AI diagramming tool that integrates directly with their AWS account. The tool scans their cloud environment, identifies all resources (like EC2 instances, S3 buckets, VPCs, and security groups), and automatically generates a detailed and accurate infrastructure diagram. The AI layout engine organizes the resources logically, showing dependencies and network flows. The team can schedule the tool to run daily, ensuring their documentation is always a perfect reflection of their live environment, which is critical for security audits, onboarding new team members, and troubleshooting.

Diagramming FAQ

What are AI Diagramming tools?

AI Diagramming tools are applications that use artificial intelligence to automate the creation, layout, and optimization of diagrams. Unlike traditional manual tools, they can interpret inputs like natural language text, code, or raw data to automatically generate visual charts such as flowcharts, sequence diagrams, and mind maps. Their main purpose is to accelerate the process of visualizing complex information and ensure diagrams are clear, consistent, and easy to maintain.

How do AI diagramming tools differ from traditional diagramming software?

The key difference lies in automation and intelligence. Traditional tools (like early versions of Visio or Draw.io) are digital drawing boards requiring users to manually place every shape and connector. AI diagramming tools automate this process. Key differentiators include:

  • Automated Generation: AI tools can create entire diagrams from text, code, or data, whereas traditional tools require manual creation from a blank canvas.
  • Smart Layouts: AI automatically arranges elements for clarity, while traditional tools rely on manual alignment and distribution.
  • Contextual Suggestions: AI can suggest the next logical step or shape in a process, a feature absent in basic traditional tools.
In essence, AI tools shift the user's focus from 'how to draw' to 'what to represent'.

Who can benefit from using AI Diagramming tools?

A wide range of professionals can benefit from AI diagramming tools. Key users include:

  • Software Developers & Architects: For quickly creating UML diagrams, system architecture maps, and sequence diagrams from code or text.
  • Business Analysts: To automate the creation of process flowcharts (BPMN) and business models from requirements documents.
  • Project Managers: For generating mind maps from brainstorming notes or timelines from project plans.
  • Consultants & Educators: To rapidly visualize complex systems, theories, or workflows for clients and students.
  • DevOps & IT Professionals: For auto-generating and maintaining up-to-date diagrams of network and cloud infrastructure.

What types of diagrams can be created with AI?

AI diagramming tools support a wide variety of common diagram types, often excelling at those with logical structures. Common examples include:

  • Flowcharts: For visualizing processes and workflows.
  • UML Diagrams: Including sequence, class, and activity diagrams for software engineering.
  • Mind Maps: For brainstorming and organizing ideas.
  • Network & Infrastructure Diagrams: For mapping out cloud (AWS, Azure) or on-premise systems.
  • Entity-Relationship Diagrams (ERDs): For designing and documenting database schemas.
  • Organizational Charts: For representing company or team structures.
The specific types supported can vary by tool, so it's important to check if a tool meets your specific needs.

How to choose the right AI Diagramming tool?

To choose the right tool, evaluate your needs against these key factors:

  • Supported Diagram Types: Ensure the tool supports the specific charts you need (e.g., UML, BPMN, ERD).
  • Input Methods: Consider how you want to create diagrams. Do you need text-to-diagram, code-based generation (like Mermaid), data import, or integration with cloud providers?
  • Integration Capabilities: Check if it connects with your existing tools like Confluence, Jira, GitHub, or Slack to streamline your workflow.
  • Collaboration Features: If you work in a team, look for features like real-time editing, commenting, and version history.
  • Export & Customization: Verify that you can export diagrams in needed formats (PNG, SVG, PDF) and customize their appearance to match your standards.