Appsmith
Appsmith is an open-source, low-code platform designed for developers to build, ship, and maintain internal tools, dashboards, and …
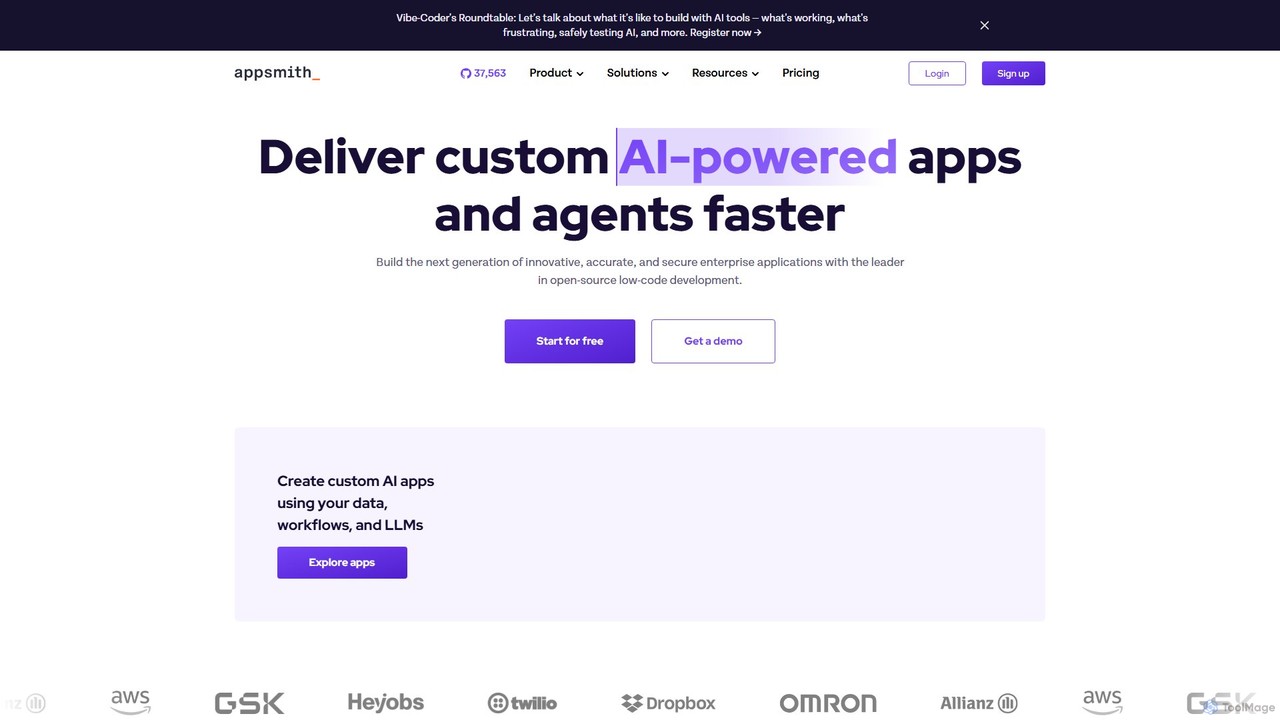
Appsmith is an open-source, low-code platform designed for developers to build, ship, and maintain internal tools, dashboards, and AI-powered applications rapidly. It connects to any data source, allows UI building via drag-and-drop or natural language, and offers full customization with JavaScript, empowering teams to create secure, scalable enterprise-grade applications with unprecedented speed.
Lemonado
Lemonado is an AI-powered data platform that connects to your real-time business data sources. It allows you to …
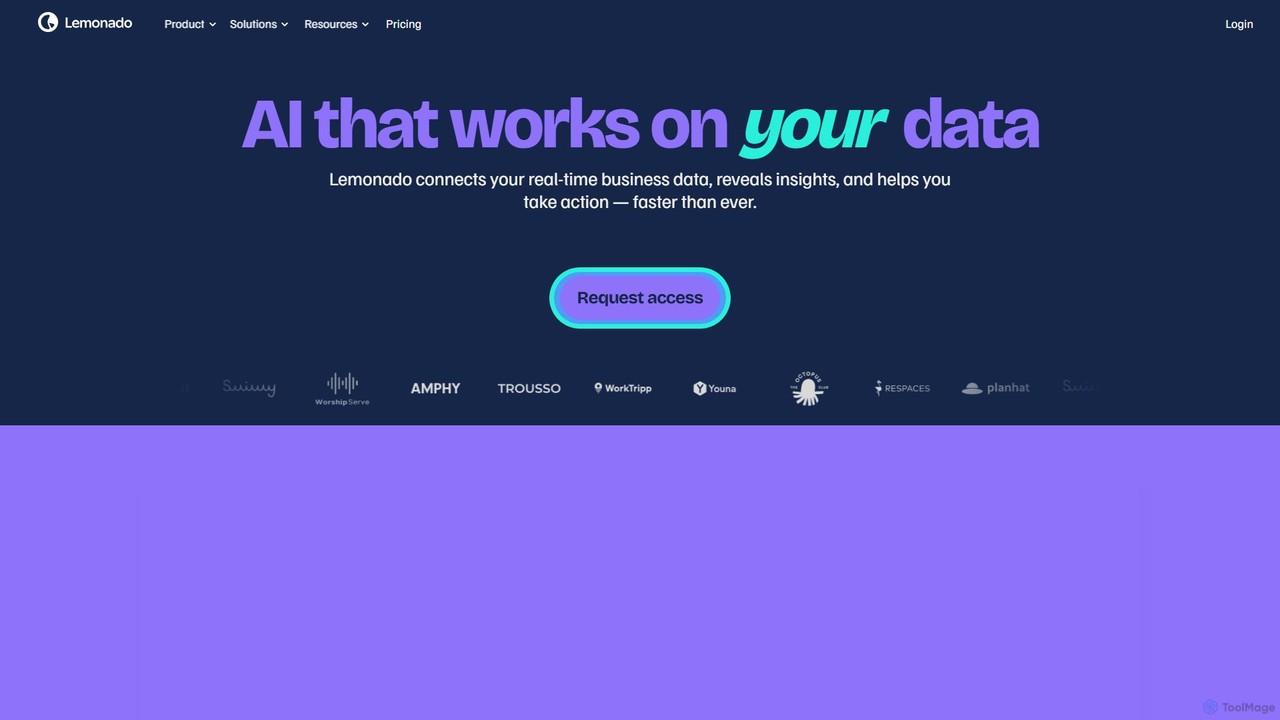
Lemonado is an AI-powered data platform that connects to your real-time business data sources. It allows you to build interactive dashboards, chat with your data using a natural language AI assistant, and automate insights without writing any code. It's designed to help sales, customer success, and operations teams make faster, data-driven decisions by unifying all their information in one accessible place.
About Dashboard
AI Dashboard tools are specialized applications for creating interactive, visual representations of data and key performance indicators (KPIs). They connect to various data sources to transform complex datasets into easily understandable charts, graphs, and reports in real-time. The primary value of these dashboards is enabling users to monitor business health, track goals, and uncover insights quickly without needing to sift through raw data. Many modern dashboards incorporate AI to provide predictive forecasts, detect anomalies, or allow for natural language queries.
Core Features
- Real-time Data Visualization: Automatically syncs with data sources to display the most current information through interactive charts and maps.
- Customizable Widgets & Layouts: Allows users to build personalized views by dragging and dropping different visualization elements to track specific metrics.
- AI-Powered Insights: Utilizes machine learning for features like trend forecasting, anomaly detection, and generating narrative summaries of data.
- Multi-Source Integration: Connects seamlessly with databases, cloud services, spreadsheets, and third-party applications to consolidate data in one place.
- Automated Reporting & Alerts: Schedules and distributes reports automatically and sends notifications when predefined data thresholds are met.
Use Cases
AI Dashboards are widely used by business intelligence analysts, marketing managers, sales teams, and executives. Common applications include monitoring marketing campaign performance, tracking sales pipeline velocity, visualizing website user engagement, and monitoring the performance of machine learning models in production environments.
How to Choose
When selecting an AI Dashboard tool, consider its data source compatibility and integration capabilities. Evaluate the level of customization and interactivity offered by its visualization widgets. Assess the sophistication of its AI features, such as predictive analytics. Finally, balance the tool's ease of use for non-technical users against its advanced capabilities for data analysts.
DashboardUse Cases
Monitoring E-commerce Sales Performance
An e-commerce manager uses an AI dashboard to get a real-time, consolidated view of business performance. By connecting data sources like Shopify, Google Analytics, and their ad platforms, the dashboard visualizes key metrics such as daily revenue, conversion rate, average order value (AOV), and customer acquisition cost (CAC). The manager can drill down into specific product categories or marketing channels to identify trends. AI features might automatically flag a sudden drop in conversion rate or forecast sales for the upcoming holiday season, enabling proactive decision-making.
Tracking Marketing Campaign ROI
A digital marketing team centralizes their campaign data into an AI dashboard. It pulls metrics from Google Ads, Facebook Ads, LinkedIn, and email marketing platforms. The dashboard displays a holistic view of spend, impressions, clicks, leads, and ultimately, return on investment (ROI) for each campaign. Users can compare the performance of different channels side-by-side. An AI-powered feature could analyze the data to suggest budget reallocations, identifying underperforming ads and recommending shifting funds to more effective campaigns to maximize overall ROI.
Visualizing SaaS Product Usage Metrics
A product manager for a SaaS company uses a dashboard to monitor user engagement and product health. Data is streamed from their product analytics platform (like Mixpanel or Amplitude) and database. The dashboard tracks Daily Active Users (DAU), feature adoption rates, user retention cohorts, and churn rate. Interactive filters allow the manager to segment users by subscription plan, signup date, or geography. This helps them understand which features are most valuable and identify friction points in the user journey, guiding priorities for the product roadmap.
Real-time Social Media Analytics
A social media manager connects their brand's social accounts (Twitter, Instagram, Facebook) to an AI dashboard. The tool visualizes key metrics like follower growth, engagement rate, reach, and top-performing posts in real-time. It can also perform sentiment analysis on mentions and comments, categorizing them as positive, negative, or neutral. This allows the manager to quickly gauge public perception of their brand, identify viral content, and respond to customer feedback promptly. AI-driven alerts can notify them of a sudden spike in negative sentiment, enabling rapid crisis management.
Operational Monitoring for Logistics
An operations manager in a logistics company uses a dashboard to track the entire supply chain. By integrating data from GPS trackers on vehicles, warehouse management systems, and order databases, the dashboard provides a live map of fleet locations, delivery statuses, and inventory levels at different warehouses. Key metrics like on-time delivery rate, average transit time, and fuel consumption are monitored. AI algorithms can predict potential delivery delays based on traffic patterns and weather data, allowing the manager to proactively reroute shipments and manage customer expectations.
Monitoring Machine Learning Model Performance
A data scientist or ML engineer uses a specialized dashboard to monitor the performance of AI models in production. The dashboard visualizes key model metrics like accuracy, precision, recall, and prediction latency over time. It also tracks data drift (changes in input data distribution) and concept drift (changes in the relationship between input and output). By setting up automated alerts for performance degradation or significant drift, the team can quickly intervene to retrain or update the model, ensuring its continued reliability and effectiveness in the real world.