Latta
Latta is an AI-powered coding assistant designed to be your 24/7 genius colleague for debugging. It integrates with …
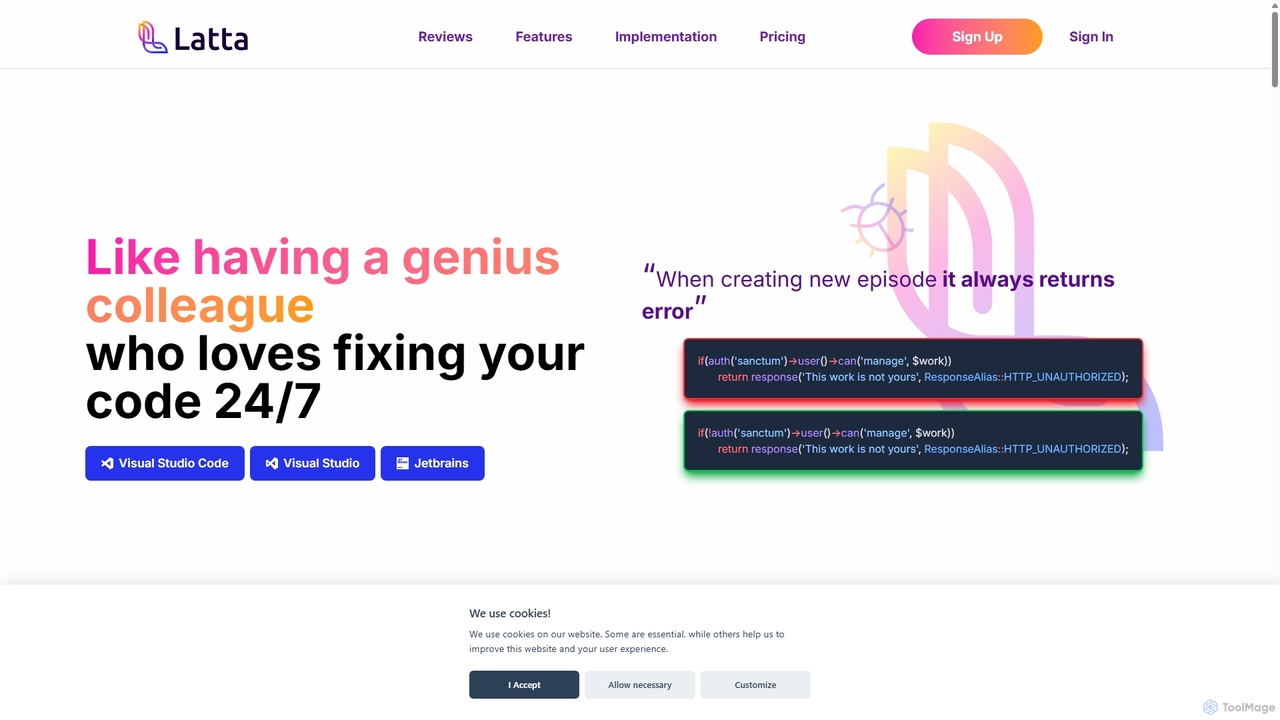
Latta is an AI-powered coding assistant designed to be your 24/7 genius colleague for debugging. It integrates with popular IDEs like VS Code and JetBrains to find and fix bugs across complex projects. With features like user session replay and Git integration, Latta streamlines bug reporting and resolution, saving developers significant time and effort.
About Error Monitoring
Error Monitoring tools are a specialized category of developer software designed to automatically detect, diagnose, and report application errors in real-time. These platforms capture unhandled exceptions and crashes, providing developers with detailed stack traces and contextual data. By intelligently grouping similar errors and providing instant alerts, they enable teams to proactively identify, prioritize, and resolve bugs before they significantly impact users. This focus on post-deployment stability makes them an essential component of modern software development and operations (DevOps).
Core Features
- Real-time Error Capture: Automatically intercepts and records exceptions, crashes, and other code-level errors as they happen in production or staging environments.
- Detailed Stack Traces: Provides the exact file, line number, and function call sequence leading to an error, pinpointing the root cause.
- Error Grouping & Aggregation: Intelligently groups identical or similar errors into single, actionable issues to reduce noise and simplify prioritization.
- Contextual Data Collection: Gathers valuable session information like user actions (breadcrumbs), browser version, OS, and network requests to help reproduce bugs.
- Alerting & Integrations: Sends instant notifications via email, Slack, or PagerDuty and integrates with issue trackers like Jira or GitHub to streamline workflows.
Use Cases
Error Monitoring tools are critical for any organization developing software. They are used extensively by software developers, DevOps engineers, and Site Reliability Engineers (SREs) to maintain application health. Common scenarios include monitoring live web applications for JavaScript errors, tracking crashes in mobile apps (iOS/Android), and ensuring the stability of backend microservices and APIs.
How to Choose
When selecting an Error Monitoring tool, consider its support for your specific programming languages and frameworks. Evaluate the depth of contextual data it provides, such as user breadcrumbs and performance metrics. Assess its integration capabilities with your existing toolchain (e.g., Jira, Slack, GitHub). Finally, examine the pricing model—whether it's based on error volume, users, or features—to ensure it aligns with your project's scale and budget.
Error MonitoringUse Cases
Proactive Bug Fixing in a Live SaaS Application
A DevOps engineer at a SaaS company is responsible for maintaining the stability of their production web application. They integrate an Error Monitoring tool into their JavaScript frontend and Python backend. When a user encounters a previously unseen bug during checkout, the tool instantly captures the exception, along with the user's browser details and the sequence of actions (breadcrumbs) leading to the error. The engineer receives a Slack alert with a link to the full error report, including the stack trace. This allows them to diagnose and deploy a fix within minutes, preventing further revenue loss and improving user trust without waiting for manual bug reports.
Diagnosing Mobile App Crashes
A mobile game developer launches a new update for their iOS and Android app. Soon after, they notice a spike in crashes reported by an Error Monitoring tool. The tool automatically groups crashes by root cause, revealing that a specific animation is causing a memory leak on older Android devices. The report includes device model, OS version, and memory usage at the time of the crash. Armed with this precise data, the development team can replicate the issue, fix the memory leak, and push a hotfix update to the app stores, significantly reducing negative reviews and user churn.
Improving Code Quality in Staging Environments
A Quality Assurance (QA) team uses an Error Monitoring tool in their staging environment to catch bugs before they reach production. During automated and manual testing cycles, any JavaScript error or backend exception is immediately logged and assigned to the responsible developer via a Jira integration. This process creates a tight feedback loop, allowing developers to fix issues while the code context is still fresh in their minds. As a result, the number of critical bugs deployed to production decreases by over 60%, leading to smoother releases and less emergency firefighting for the operations team.
Monitoring Backend API and Microservice Health
A Site Reliability Engineer (SRE) is tasked with ensuring the uptime and reliability of a complex microservices architecture. They configure an Error Monitoring tool to watch over dozens of services written in Go and Java. When a downstream service fails, causing a cascade of 5xx errors in an upstream API gateway, the tool groups all related errors into a single incident. The SRE is immediately paged and can see the exact service that failed first, along with the request payload that triggered the issue. This visibility allows for rapid incident response, preventing a minor service failure from escalating into a full-site outage.
Tracking Client-Side JavaScript Performance Issues
A frontend developer for an e-commerce site notices that some users are reporting slow page loads, but traditional analytics don't show the cause. By using an Error Monitoring tool that also tracks performance, they discover that a third-party marketing script is occasionally throwing silent exceptions and blocking the main thread. The tool correlates these errors with high 'Largest Contentful Paint' (LCP) metrics for affected users. The developer can then use this evidence to work with the marketing team to either defer the script's loading or replace it, directly improving the user experience and potentially boosting conversion rates.
Validating the Impact of a New Feature Release
A product team releases a major new feature and wants to monitor its stability closely. They use an Error Monitoring tool to create a specific dashboard and alert for errors tagged with the new feature's version number. This allows them to isolate issues related to the new code from the rest of the application's noise. In the first hour after release, they see a small number of non-critical errors related to an edge case they hadn't anticipated. Because the errors are caught and analyzed immediately, the team can quickly roll out a patch, ensuring the feature launch is successful and builds confidence in the release process.