Transluce
Transluce is an independent research lab developing open, scalable technology to understand AI systems. They build tools like …
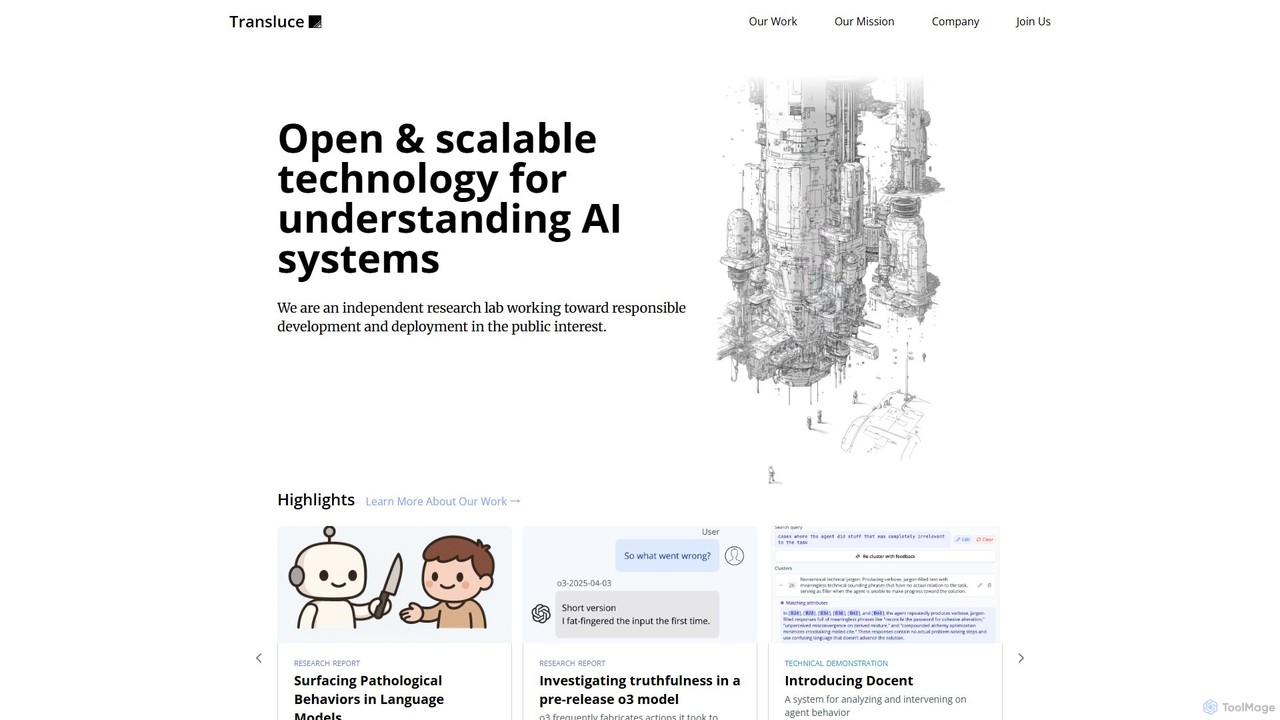
Transluce is an independent research lab developing open, scalable technology to understand AI systems. They build tools like Docent and Monitor to analyze, evaluate, and intervene in AI agent behavior, promoting responsible AI development through enhanced interpretability and safety.
About Model Debugging
Model Debugging tools are specialized platforms for diagnosing and resolving issues within machine learning models. Unlike traditional code debuggers, these tools delve into the model's internal workings, allowing developers to inspect activations, gradients, and weight distributions to understand *why* a model makes certain predictions. They are essential for improving model accuracy, fairness, and robustness by identifying hidden biases, data quality problems, or architectural flaws. This process moves beyond simple performance metrics to provide deep, actionable insights into model behavior.
Core Features
- Activation Visualization: Visually inspect which neurons or layers are activated by specific inputs to understand the model's focus.
- Explainable AI (XAI): Generate human-understandable explanations for individual predictions using techniques like SHAP or LIME.
- Data Slice Analysis: Automatically identify and evaluate model performance on critical subsets of data where it underperforms.
- Error Pattern Detection: Cluster and analyze incorrect predictions to uncover systematic failure modes and their root causes.
- Model Comparison: Conduct in-depth, side-by-side comparisons of different model versions on specific failure cases.
Use Cases
These tools are critical for data scientists, machine learning engineers, and AI researchers. They are frequently used in high-stakes domains like finance for auditing loan models for bias, in healthcare for verifying the reasoning of diagnostic models, and in autonomous systems to ensure safety and reliability by testing against edge cases.
How to Choose
When selecting a Model Debugging tool, consider its framework compatibility (e.g., TensorFlow, PyTorch), the range of supported model types (e.g., CNNs, Transformers), its integration with your MLOps pipeline, and the sophistication of its visualization and explanation features. Also, evaluate whether it operates on-premise or in the cloud to meet your data security requirements.
Model DebuggingUse Cases
Diagnosing Bias in Financial Credit Models
A risk analyst at a bank uses a model debugging tool to investigate why their new credit scoring model has a high rejection rate for a specific demographic. By applying XAI techniques, they discover the model is assigning disproportionately negative weight to certain postal codes correlated with that demographic. The tool's data slice analysis confirms this underperformance. This insight allows the team to retrain the model with fairer data representation, ensuring regulatory compliance and reducing discriminatory outcomes.
Improving Medical Image Classification Accuracy
A computer vision engineer is developing an AI model to detect tumors in medical scans but finds it often misidentifies benign cysts. Using an activation visualization feature, they see the model is focusing on the tissue surrounding the anomaly rather than the anomaly itself. The debugging tool helps them identify and label these ambiguous cases in the training data. After retraining, the model's accuracy and reliability improve significantly, making it a more trustworthy aid for radiologists.
Troubleshooting Hallucinations in a Customer Service Chatbot
An NLP developer notices their LLM-powered chatbot is occasionally inventing false information ('hallucinating') about company policies. They use a model debugging platform to trace the token-by-token generation process for problematic responses. The tool reveals that the model over-relies on patterns from its pre-training data when faced with ambiguous user queries. The developer uses this insight to refine the fine-tuning dataset and implement better guardrails, reducing the frequency of inaccurate answers.
Uncovering Failure Modes in an Autonomous Vehicle System
An AI safety engineer for an autonomous vehicle company needs to ensure a perception model is robust. They use a model debugging tool to analyze performance on edge cases, such as rainy nights or partially obscured traffic signs. The tool automatically clusters failure cases, revealing the model consistently fails to identify pedestrians carrying umbrellas. This specific, actionable feedback enables the team to augment the training data and improve model performance in critical adverse weather conditions.
Optimizing a Product Recommendation Engine
An MLOps team at an e-commerce company is A/B testing two versions of their recommendation algorithm. While overall metrics are similar, user engagement is down for one version. A model debugging tool allows them to compare the models' predictions for specific user segments. They find the new model performs poorly for users with sparse purchase history, creating a 'cold start' problem. This detailed comparison helps them choose the better model and informs future algorithm development.
Comparing Pre-production Models for Deployment
A machine learning engineer has two candidate models ready for deployment. Before making a final decision, they use a model debugging tool for a final 'bake-off'. The platform allows them to upload a curated dataset of known difficult cases and historical failures. By comparing the models' performance, error patterns, and prediction explanations on this specific dataset, they can confidently select the model that is not only more accurate overall but also more robust on the scenarios that matter most for business outcomes.