Plural
Plural is an AI-powered enterprise Kubernetes management platform designed to accelerate and simplify operations. It provides multi-cloud visibility, …
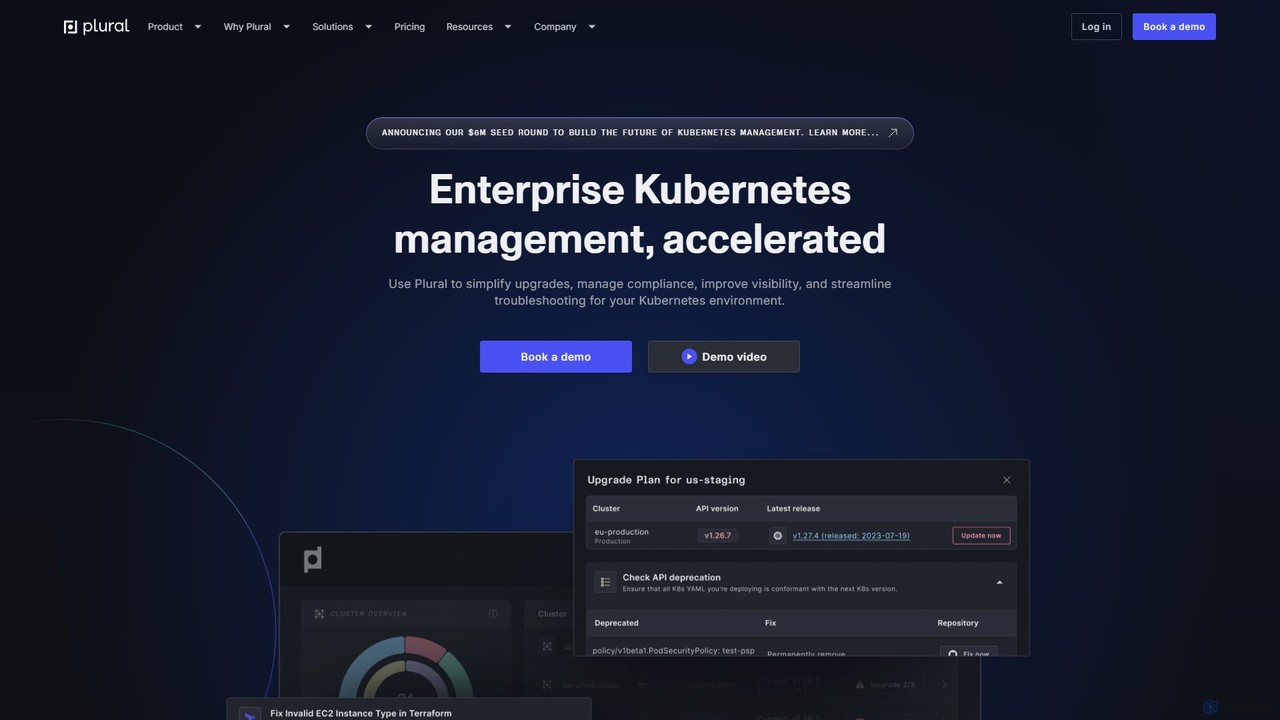
Plural is an AI-powered enterprise Kubernetes management platform designed to accelerate and simplify operations. It provides multi-cloud visibility, automates complex upgrades, offers AI-driven troubleshooting, and ensures robust security and compliance. Ideal for DevOps and platform engineering teams, Plural reduces operational costs and enhances developer velocity.
About Observability
Observability tools are AI-powered solutions designed to provide deep insights into the internal state of complex systems by analyzing their external outputs. These tools leverage logs, metrics, and traces to offer a comprehensive understanding of application and infrastructure behavior. They enable IT operations and development teams to proactively identify issues, troubleshoot incidents faster, and optimize system performance in modern distributed environments. By going beyond traditional monitoring, Observability helps uncover the root causes of problems and predict potential failures.
Core Features
- Log Management & Analysis: Centralized collection, parsing, searching, and correlation of log data from various sources.
- Metrics Monitoring & Alerting: Real-time aggregation, visualization, and alerting on key performance indicators (KPIs) and system health metrics.
- Distributed Tracing: End-to-end visibility into requests as they flow through microservices and distributed architectures, identifying latency and errors.
- Anomaly Detection: AI-driven identification of unusual patterns in data that may indicate emerging issues, often before they impact users.
- Dashboarding & Visualization: Customizable dashboards to present complex data in an intuitive, actionable format for quick insights.
Use Cases
Observability tools are essential for DevOps, SRE, and IT operations teams managing cloud-native applications, microservices, and complex infrastructure. They are used to diagnose production issues, optimize resource utilization, and ensure service reliability. Developers also leverage these tools to understand application behavior in real-world scenarios and improve code performance.
How to Choose
When selecting an Observability platform, consider its integration capabilities with your existing tech stack, its scalability to handle your data volume, and the granularity of insights it provides. Evaluate the cost model, data retention policies, and the platform's ease of use. Look for features like AI-driven anomaly detection, robust alerting, and customizable visualization options to meet your specific operational needs.
ObservabilityUse Cases
Accelerate Root Cause Analysis for Production Incidents
DevOps engineers use Observability tools to quickly pinpoint the source of application errors or performance degradation in production. By correlating logs, metrics, and distributed traces across microservices, they can identify the exact component or code change causing the issue, significantly reducing mean time to resolution (MTTR) and minimizing service disruption.
Proactive Performance Optimization and Capacity Planning
SRE teams leverage Observability platforms to continuously monitor system performance metrics and identify trends. By analyzing historical data and real-time insights, they can proactively optimize resource allocation, detect potential bottlenecks before they impact users, and accurately plan for future capacity needs, ensuring the system scales efficiently with demand.
Enhance User Experience Monitoring and Impact Analysis
Product managers and development teams utilize Observability tools to gain insights into the actual user experience. By monitoring frontend performance metrics, tracing user journeys, and correlating them with backend system health, they can understand how infrastructure issues or application errors directly impact user satisfaction, conversion rates, and overall business outcomes.
Streamline Security Incident Detection and Investigation
Security analysts leverage Observability platforms for centralized log management and anomaly detection to identify suspicious activities or potential breaches. By correlating security events across various system components and tracing their origin, they can quickly investigate incidents, understand their scope, and implement effective countermeasures, enhancing overall system security posture.
Validate New Deployments and Feature Releases
Development and QA teams use Observability tools to monitor the health and performance of new code deployments and feature releases in real-time. By comparing metrics and logs before and after a deployment, they can quickly detect regressions, performance bottlenecks, or unexpected errors, enabling rapid rollback or hotfixes and ensuring the stability of the production environment.
Monitor Cloud Infrastructure Health and Cost Efficiency
Cloud operations teams utilize Observability platforms to gain comprehensive visibility into their dynamic cloud infrastructure. They monitor resource utilization, network performance, and service availability across various cloud providers. This enables them to identify underutilized resources, optimize cloud spending, and ensure the resilience and efficiency of their cloud-native applications and services.