Amarsia
Amarsia is an intuitive platform designed to help teams effortlessly build, deploy, and monitor custom AI features as …
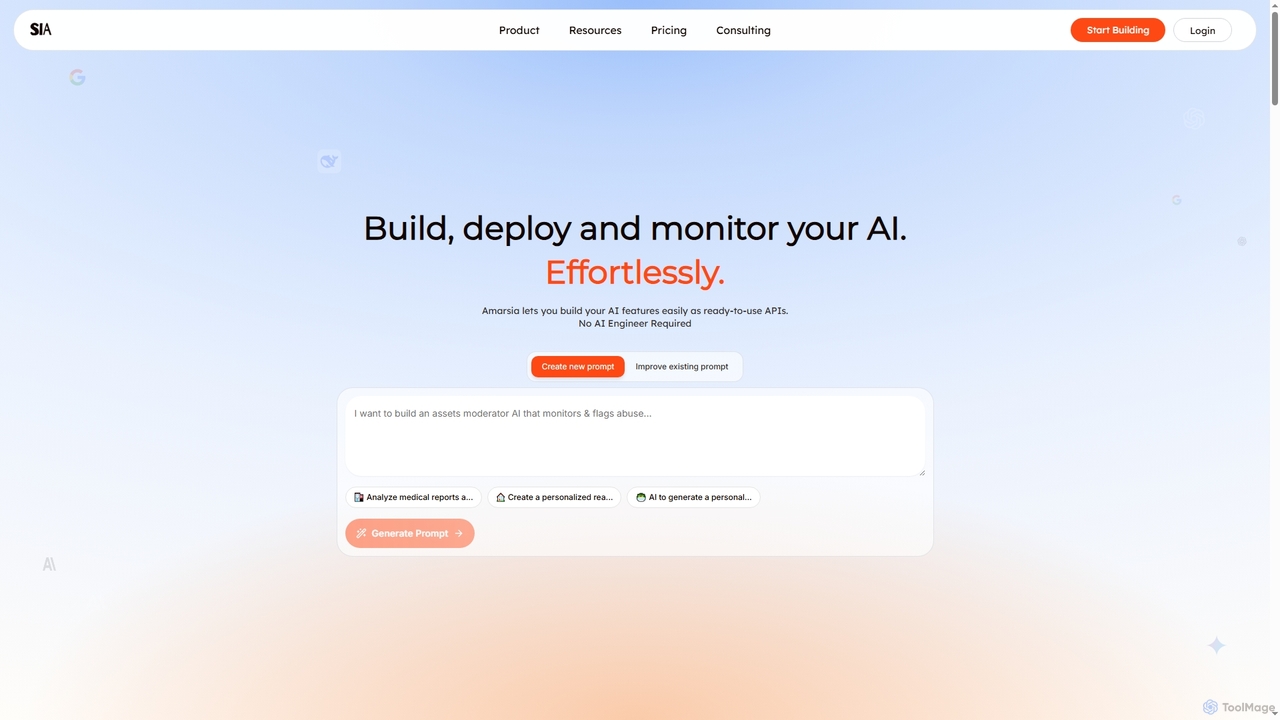
Amarsia is an intuitive platform designed to help teams effortlessly build, deploy, and monitor custom AI features as ready-to-use APIs. It eliminates the need for extensive coding or AI engineering expertise, enabling rapid development of intelligent workflows, knowledge bases, and multimodal AI solutions with built-in version control and performance monitoring.
About Performance Analytics
Performance Analytics tools are a specialized class of software that uses AI to interpret operational data and diagnose system inefficiencies. These tools go beyond simple data collection by processing metrics, logs, and traces to uncover the root causes of performance issues like latency, errors, and resource bottlenecks. This enables development and operations teams to proactively optimize application speed, improve infrastructure stability, and enhance the end-user experience. Many leverage machine learning for advanced anomaly detection and predictive insights into future performance degradation.
Core Features
- Root Cause Analysis: Automatically correlates disparate data sources (logs, metrics, traces) to pinpoint the exact origin of a performance problem.
- AI-Powered Anomaly Detection: Uses machine learning to learn normal system behavior and proactively alerts on deviations without manual threshold setting.
- Resource Usage Forecasting: Predicts future resource needs (CPU, memory, storage) based on historical trends, aiding in capacity planning.
- Code-Level Profiling: Drills down into application code to identify inefficient functions or slow database queries that impact performance.
- User Experience Monitoring: Connects system performance metrics to actual user journeys, quantifying the impact of slowdowns on user satisfaction.
Use Cases
Primarily used by DevOps engineers, Site Reliability Engineers (SREs), and software developers in tech-driven industries like SaaS, e-commerce, and finance. They are crucial for managing complex, distributed systems, such as microservices architectures or cloud-native applications, where manual analysis is impractical. Product managers also use these tools to understand how performance impacts user engagement and business KPIs.
How to Choose
When selecting a Performance Analytics tool, consider its integration capabilities with your existing monitoring stack (e.g., Prometheus, Datadog). Evaluate the sophistication of its AI and machine learning features—does it offer predictive analysis or just basic anomaly detection? Assess the granularity of the data it provides and its ability to scale with your application's traffic. Finally, consider the user interface's intuitiveness for quick problem diagnosis during critical incidents.
Performance AnalyticsUse Cases
Diagnosing Application Latency Spikes
A Site Reliability Engineer (SRE) for a SaaS platform receives an alert for a sudden increase in API response times. Instead of manually combing through logs, they use a Performance Analytics tool. The platform's AI automatically correlates application traces with infrastructure metrics, identifying a specific database query that has become inefficient under load. The tool highlights the exact line of code and the query execution plan, allowing developers to deploy a fix in minutes instead of hours, restoring service performance and preventing customer churn.
Optimizing Cloud Infrastructure Costs
A DevOps team aims to reduce their monthly cloud computing bill. They deploy a Performance Analytics tool that analyzes resource utilization patterns across their entire server fleet. The tool's forecasting feature identifies several oversized virtual machines that are consistently underutilized. It also highlights services that can be safely scaled down during off-peak hours. Based on these actionable recommendations, the team adjusts its resource allocation, resulting in a 25% reduction in infrastructure costs without impacting application performance.
Proactively Preventing System Outages
A financial services company cannot afford downtime. Their operations team uses a Performance Analytics tool with predictive capabilities. The tool analyzes long-term trends and detects a subtle, slow memory leak in a critical transaction processing service. It forecasts that this leak will cause a system crash within 48 hours. This proactive alert gives the development team ample time to identify the faulty code, test a patch, and deploy it during a scheduled maintenance window, completely avoiding a service outage and potential financial losses.
Improving E-commerce User Experience
A product manager for an e-commerce site notices a high cart abandonment rate on their mobile app. They use a Performance Analytics tool that links user session data with backend performance. The analysis reveals that users in specific geographic regions experience a 5-second delay when loading the payment page. The tool traces this latency to a poorly configured Content Delivery Network (CDN) for that region. By reconfiguring the CDN, the page load time drops to under a second, leading to a measurable decrease in cart abandonment and an increase in sales.
Validating Performance of New Code Releases
A software developer is about to merge a new feature into the main application. Before deployment, they use a Performance Analytics tool in a staging environment to compare the performance profile of the new code against the current version. The tool's code-level profiling feature flags a new function that makes excessive database calls. The developer refactors the code to be more efficient, re-runs the analysis to confirm the issue is resolved, and then proceeds with the deployment, preventing a performance regression from ever reaching production users.
Analyzing Microservices Communication Bottlenecks
An engineering team managing a complex microservices architecture struggles to identify why certain user actions are slow. They implement a Performance Analytics tool with distributed tracing capabilities. The tool visualizes the entire request flow across dozens of services. It quickly reveals that a single, downstream authentication service is creating a bottleneck for multiple upstream services. By focusing their optimization efforts on this one service—perhaps by adding a cache or scaling it up—the team resolves a widespread performance issue that was previously difficult to diagnose.