Supadash
Supadash is an AI-powered, no-code platform that instantly generates visual dashboards from your database. Connect your data source, …
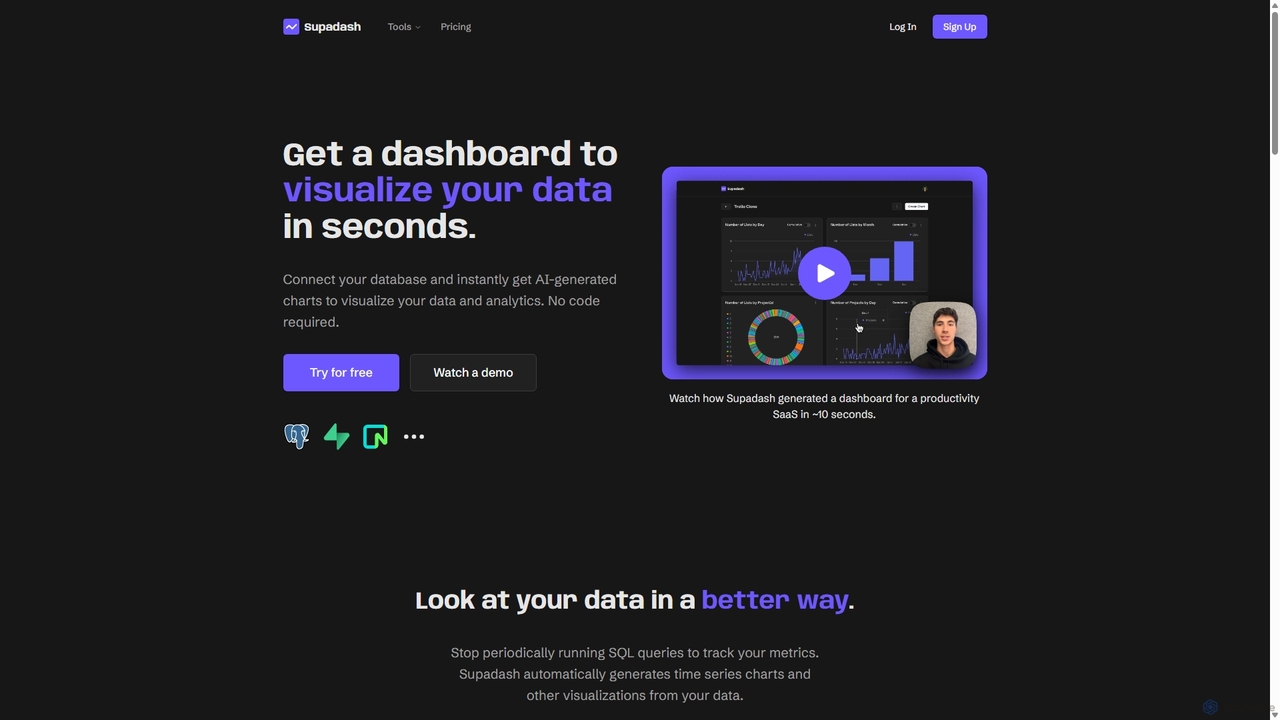
Supadash is an AI-powered, no-code platform that instantly generates visual dashboards from your database. Connect your data source, and within seconds, Supadash's AI analyzes your tables and creates insightful charts and analytics. It's designed for developers, startups, and teams who need to track key metrics without writing complex SQL queries, transforming raw data into actionable insights effortlessly.
About Dashboard Builder
Dashboard Builders are a type of no-code platform for creating interactive, data-driven dashboards without writing code. They connect to various data sources like databases, APIs, and spreadsheets, providing a drag-and-drop interface to build visualizations such as charts, tables, and graphs. This allows teams to monitor key performance indicators (KPIs), track business metrics in real-time, and share insights across an organization. Many AI-powered dashboard builders can also automatically suggest visualizations or identify data trends.
Core Features
- Drag-and-Drop Interface: Visually construct dashboards by arranging pre-built components, making it accessible for non-technical users.
- Multiple Data Connectors: Natively integrate with SQL/NoSQL databases, SaaS applications, APIs, and file uploads.
- Real-time Data Sync: Automatically refresh data at set intervals to ensure dashboards display the most current information.
- Interactive Visualizations: Offer a library of configurable charts, graphs, tables, and maps that users can filter and explore.
- Role-Based Access Control: Securely manage permissions, controlling who can view or edit specific dashboards and data.
Use Cases
These tools are widely used by operations teams to build internal admin panels, marketing departments to track campaign performance, and sales teams to monitor pipelines. They are also ideal for product managers analyzing user engagement and executives requiring a high-level overview of business health.
How to Choose
When selecting a Dashboard Builder, evaluate the range of available data connectors to ensure they match your tech stack. Assess the customization options for visualizations, the platform's scalability to handle data growth, its security features, and the pricing model (e.g., per-user vs. usage-based).
Dashboard BuilderUse Cases
Building a Real-time Sales Performance Dashboard
A sales manager needs to track daily team performance using data from Salesforce and a separate SQL database. Using a dashboard builder, they connect both data sources without code. They then use the drag-and-drop interface to create charts for 'Deals Closed by Rep,' 'Pipeline Value by Stage,' and a real-time sales leaderboard. The resulting dashboard automatically updates, replacing manual daily reports and providing immediate insights for team meetings, saving hours of administrative work each week.
Monitoring Marketing Campaign KPIs
A digital marketing specialist runs campaigns across Google Ads, Facebook Ads, and Google Analytics. To get a unified view, they use a dashboard builder to integrate all three platforms. They create widgets to display Cost Per Acquisition (CPA), Click-Through Rate (CTR), and Conversion Rate side-by-side for each channel. This consolidated dashboard allows for quick comparison of channel effectiveness and helps optimize budget allocation in real-time without having to log into multiple advertising platforms.
Creating a Customer Support Ticket Tracker
A customer support manager wants to monitor team workload and performance metrics from their helpdesk software like Zendesk. They use a dashboard builder to connect to the Zendesk API. Within minutes, they build a dashboard showing 'New Tickets Today,' 'Average First Response Time,' and 'Customer Satisfaction (CSAT) Score Trend.' This provides an at-a-glance overview of support operations, helping to identify performance bottlenecks and allocate resources more effectively during peak hours.
Developing an Internal Admin Panel for Operations
An operations manager needs a simple interface for their team to view and update customer order statuses stored in a database, without granting direct database access. Using a dashboard builder, they create a tool that displays a table of recent orders. They add interactive buttons that, when clicked, trigger API calls to update the order status in the backend. This secure, user-friendly internal tool is built in hours instead of weeks, streamlining the fulfillment process and reducing the risk of manual data entry errors.
Visualizing Product Usage Analytics
A product manager needs to understand user engagement with a new feature by analyzing data from an analytics tool like Mixpanel. They connect Mixpanel to a dashboard builder to create custom visualizations. They build funnels to track user conversion, retention charts to monitor long-term engagement, and graphs showing daily active users for the specific feature. This dashboard provides clear, shareable insights into user behavior, helping the product team validate hypotheses and prioritize future development efforts more effectively.
Building an Executive Business Overview
A CEO requires a high-level summary of key business metrics from different departments. Instead of compiling multiple reports, they use a dashboard builder to pull key metrics into a single view. This includes Monthly Recurring Revenue (MRR) from Stripe, New Leads from HubSpot, and Website Traffic from Google Analytics. The resulting executive dashboard provides a consolidated, real-time view of business health, facilitating strategic planning and board reporting without manual data aggregation.