Draftnrun
Draftnrun is an open-source AI agent platform that empowers developers, product teams, and agencies to design, deploy, and …
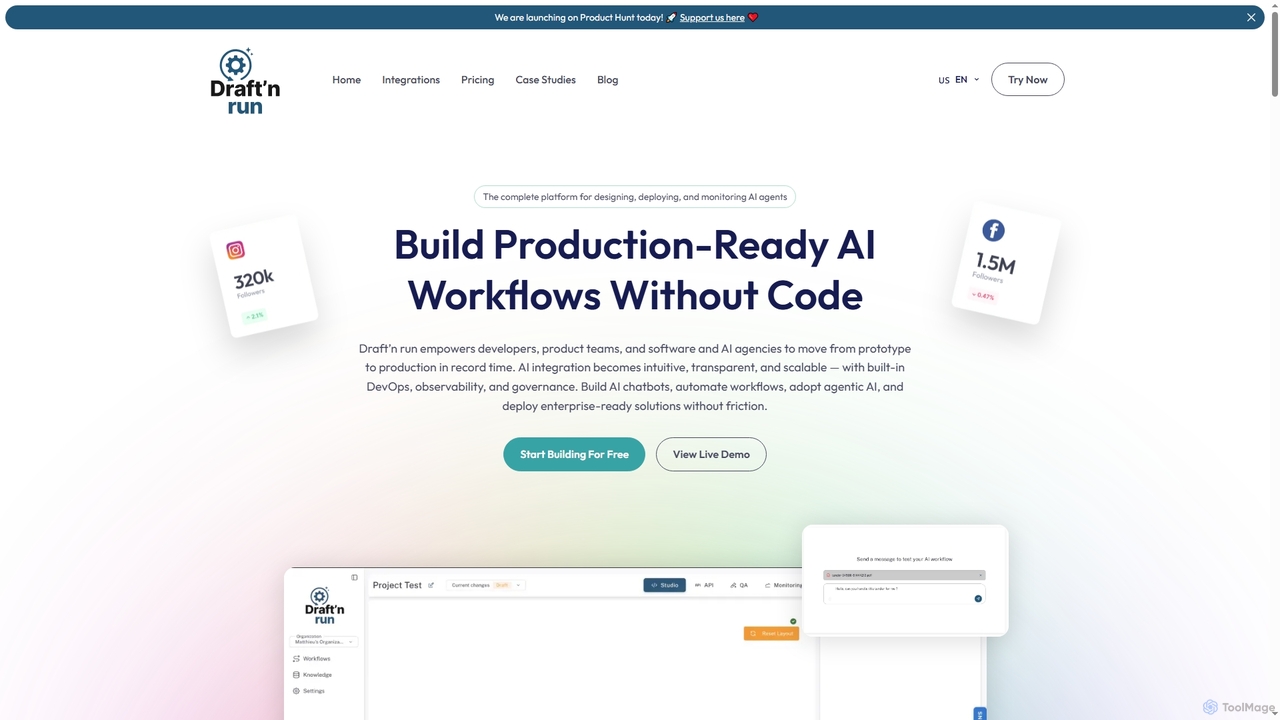
Draftnrun is an open-source AI agent platform that empowers developers, product teams, and agencies to design, deploy, and monitor production-ready AI workflows without code. It offers a visual builder, comprehensive observability, and flexible deployment options, accelerating AI integration and ensuring full control.
Starbase
Starbase by Metorial is a comprehensive platform designed to centralize the browsing, exploration, and management of various popular …
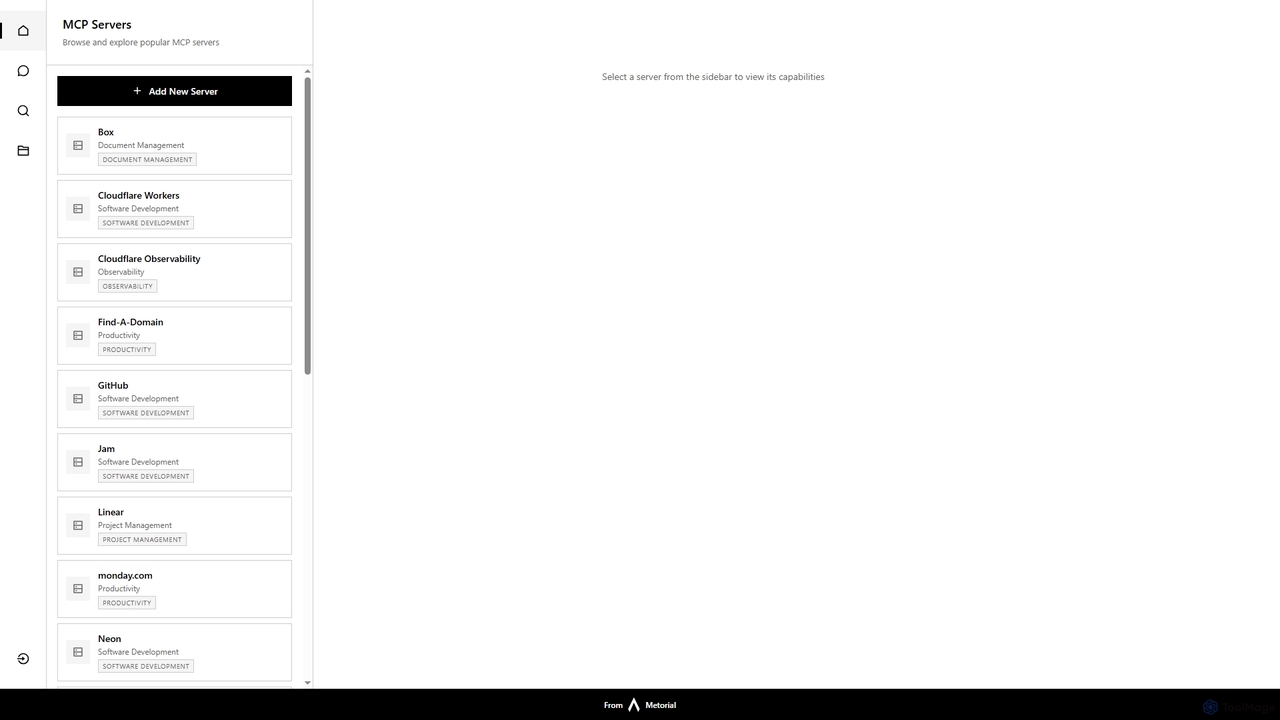
Starbase by Metorial is a comprehensive platform designed to centralize the browsing, exploration, and management of various popular software services. It integrates a wide array of tools across software development, project management, productivity, and infrastructure, offering a unified dashboard to view and interact with their capabilities.
About Monitoring
Monitoring tools are a core component of observability that systematically collect, measure, and track predefined metrics and logs from systems. They operate based on known conditions and thresholds, alerting teams when specific performance indicators are met or exceeded. This proactive approach helps maintain system health, ensure performance, and quickly identify known issues before they escalate. Unlike broader observability which focuses on exploring unknowns, monitoring excels at tracking the knowns—the critical health indicators of an application or infrastructure.
Core Features
- Metric Collection: Gathers quantitative data points like CPU utilization, memory usage, and application latency over time.
- Log Aggregation: Centralizes event logs from various sources into a single, searchable platform for analysis and troubleshooting.
- Alerting & Notification: Triggers automated alerts via channels like email, Slack, or PagerDuty when predefined thresholds are breached.
- Dashboarding & Visualization: Presents complex data through customizable graphs, charts, and dashboards for at-a-glance analysis.
- Health Checks: Performs regular, automated checks on endpoints and services to verify their availability and responsiveness.
Use Cases
Monitoring tools are essential for DevOps engineers, Site Reliability Engineers (SREs), and IT operations teams. They are used to track cloud infrastructure performance, monitor application response times, ensure database health, and verify network stability. For example, an e-commerce platform would use monitoring to track checkout service latency and server resource usage during a sales event.
How to Choose
When selecting a monitoring tool, consider its integration capabilities with your existing tech stack (e.g., AWS, Kubernetes, PostgreSQL). Evaluate the flexibility of its alerting system and the customization options for dashboards. Also, assess the data retention policies and the pricing model, which is often based on data volume, hosts, or users. Finally, consider the tool's scalability to grow with your system's complexity.
MonitoringUse Cases
Proactive Infrastructure Health Tracking
A DevOps team manages a large-scale cloud infrastructure powering a SaaS application. They use a monitoring tool to track key metrics like CPU utilization, memory usage, and disk I/O across all virtual machines. They configure alerts to automatically notify the on-call engineer via PagerDuty if CPU usage exceeds 90% for more than five minutes on any critical server. This setup allows for the early detection of potential resource bottlenecks, enabling the team to scale resources proactively and prevent system-wide slowdowns or outages before they impact customers.
Application Performance Monitoring (APM)
A software development team for an e-commerce site needs to ensure their checkout service is fast and reliable. Using an APM-focused monitoring tool, they track application-level metrics such as API response times, database query latency, and error rates (e.g., HTTP 500 errors). They create a dashboard that visualizes the entire transaction flow, from a user adding an item to their cart to completing a payment. If the average checkout latency exceeds 500ms, an alert is sent to the team's Slack channel, allowing them to quickly investigate and resolve performance degradation in specific code paths or services.
Website Uptime and Availability Checks
An IT operations manager is responsible for the 24/7 availability of the company's public website. They configure a synthetic monitoring service to perform uptime checks every minute from multiple geographic locations (e.g., North America, Europe, Asia). These checks simulate a user visiting the homepage and verify that it loads correctly and returns an HTTP 200 status code. If any location detects a failure, an immediate alert is triggered. This ensures the manager is the first to know about an outage, allowing for immediate incident response and minimizing downtime and potential revenue loss.
Database Performance Analysis
A Database Administrator (DBA) needs to maintain the health of a critical PostgreSQL database. They use a monitoring tool to collect key metrics like query throughput, slow query counts, active connections, and replication lag. By creating a dashboard that visualizes these metrics over time, the DBA can identify trends, such as a gradual increase in slow queries. This allows them to proactively analyze and optimize inefficient queries or adjust database configurations before they lead to significant performance degradation for the applications relying on the database.
Network Traffic and Bandwidth Monitoring
A network engineer at a large corporation is tasked with managing network capacity and security. They deploy monitoring agents on key switches and routers to track metrics like network bandwidth usage, packet loss, and latency. Dashboards are set up to visualize traffic patterns between different network segments. The system is configured to send an alert if bandwidth utilization on the main internet link exceeds 85% of capacity, or if unusual traffic patterns emerge that could indicate a DDoS attack. This allows for timely capacity planning and rapid detection of network-related security threats.
Log Analysis for Security and Compliance
A security analyst at a financial institution uses a monitoring tool to aggregate and analyze security logs from servers, firewalls, and applications. They create rules to detect suspicious activities, such as multiple failed login attempts from a single IP address within a short period or unauthorized access attempts to sensitive directories. When a rule is triggered, an alert is sent to the security operations center (SOC). This centralized log monitoring helps the institution meet compliance requirements like PCI DSS and enables faster detection of and response to potential security breaches.