
ToolMage
Sign in
ChartAI
Visualization · 29.5K monthly visits

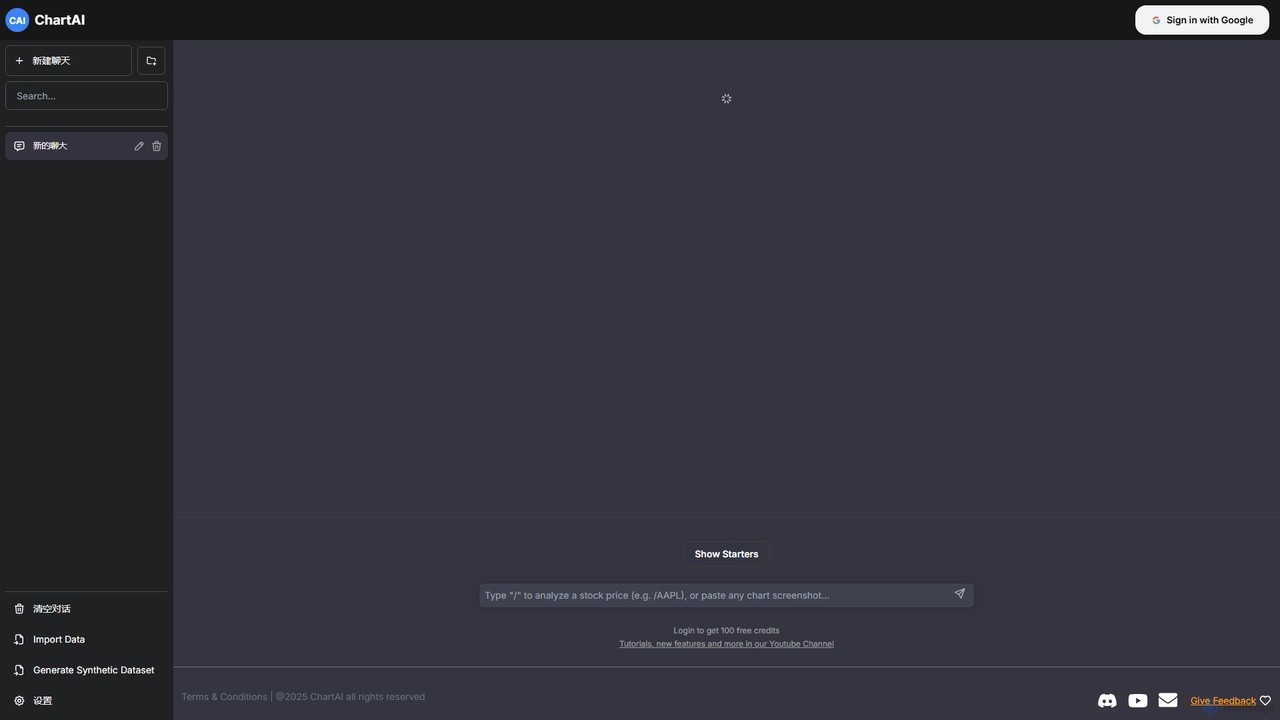
ChartAI is an AI-powered data visualization tool that transforms natural language prompts into stunning charts and graphs. Import your own data or generate synthetic datasets, then simply chat with the AI to analyze information and create visualizations instantly. Ideal for analysts, researchers, and anyone needing to quickly understand and present data without writing code.

VS
chat2csv
Business Intelligence · 358 monthly visits

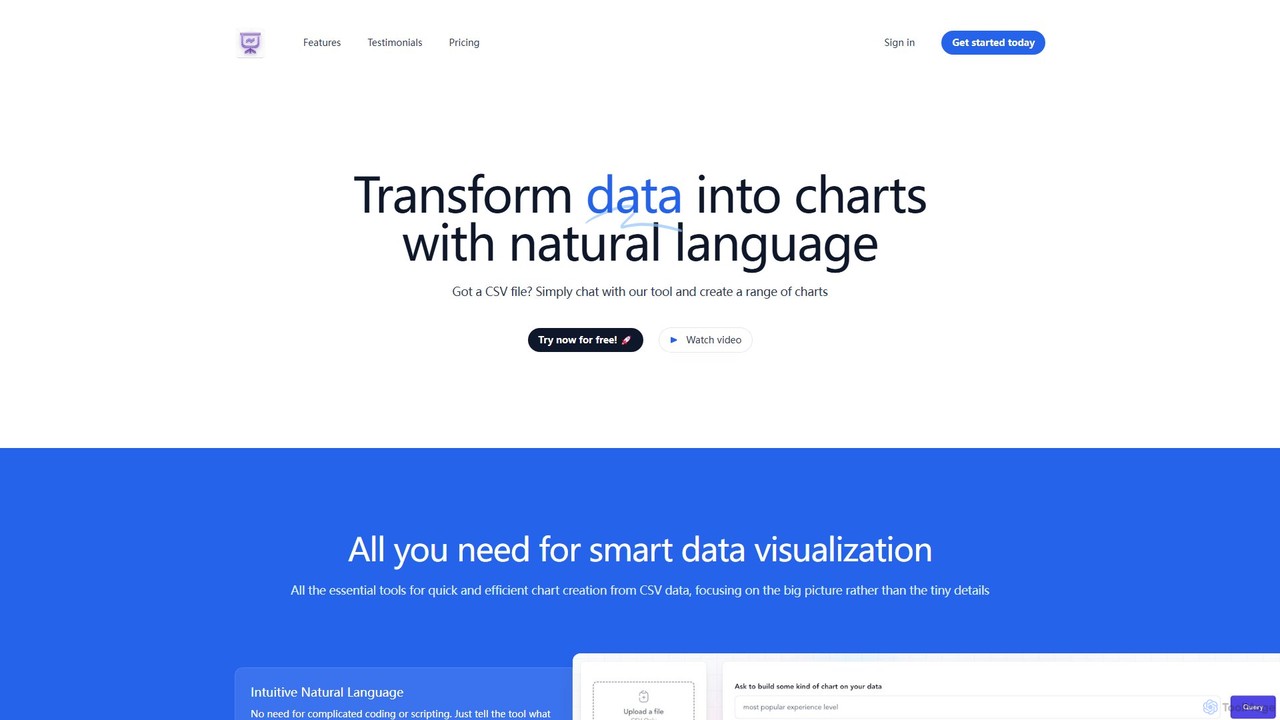
chat2csv is an AI-powered data visualization tool that transforms CSV files into various charts using simple, natural language commands. No coding is required. Just upload your data, chat with the AI, and instantly generate bar charts, pie charts, line graphs, and more. It's designed for quick, intuitive analysis while prioritizing user data privacy.

ChartAI vs chat2csv: pricing, features, traffic, and use cases

Compare ChartAI and chat2csv across positioning, pricing, traffic, and user feedback using structured factual data.

Updated Aug 5, 2026

Product overview

ChartAI Product overview

ChartAI is an AI-powered data visualization tool that transforms natural language prompts into stunning charts and graphs. Import your own data or generate synthetic datasets, then simply chat with the AI to analyze information and create visualizations instantly. Ideal for analysts, researchers, and anyone needing to quickly understand and present data without writing code.
Preview

chat2csv Product overview

chat2csv is an AI-powered data visualization tool that transforms CSV files into various charts using simple, natural language commands. No coding is required. Just upload your data, chat with the AI, and instantly generate bar charts, pie charts, line graphs, and more. It's designed for quick, intuitive analysis while prioritizing user data privacy.

Preview

Detailed feature comparison

FeatureChartAIchat2csv
Primary categoryVisualizationBusiness Intelligence
Added2025-08-092025-08-15
PricingFreemiumFreemium
Official websitechartai.iochat2csv.com
Product typeWebsiteWebsite
Performance data
User ratingNot verifiedNot verified
Comments00
Monthly visits29.5K358
Monthly growth7.1%-78.5%
Favorites13798
DetailsView detailsView details

ChartAI vs chat2csv monthly traffic

Compare ChartAI and chat2csv by monthly reach, traffic trend, visit depth, top regions, and acquisition sources.

How to interpret the traffic data

In the ChartAI vs chat2csv monthly traffic comparison, ChartAI currently shows 29.5K visits and chat2csv shows 358; ChartAI has about 82.4 times the visible traffic of chat2csv, an absolute difference of about 29.1K visits. This reflects visible reach, not feature quality or paid users.

Both tools provide verified traffic details, so monthly trends, visit depth, regions, and acquisition sources can be compared on the same basis.

ChartAI is registered at the chartai.io/zh subpage. Because the current data does not state whether other host pages are excluded, treat this as domain-level context rather than independent traffic for one product or project.

ChartAI monthly traffic:

Latest traffic

Monthly visits
29.5K
Avg. visit duration
0:29
Pages per visit
2
Bounce rate
41.81%
Data updated 2026-06-15

Monthly traffic trend

  • 2026/1: 29.6K Monthly visits
  • 2026/2: 26K Monthly visits
  • 2026/3: 28.4K Monthly visits
  • 2026/4: 27.5K Monthly visits
  • 2026/5: 29.5K Monthly visits

Top regions

Top 5 countries/regions
Country/regionPercentageTraffic
🇺🇸United States31.98%9.4K
🇮🇳India26.97%8K
🇹🇷Turkey20.25%6K
🇧🇷Brazil10.79%3.2K
🇷🇴Romania10.01%3K

Traffic sources

Source typePercentageTraffic
Referral84.7%25K
Direct14.82%4.4K
Email0.48%142

Search keywords

ai chartaichartchartchart aichart ia

chat2csv monthly traffic:

Latest traffic

Monthly visits
358
Avg. visit duration
0:00
Pages per visit
1.06
Bounce rate
38.96%
Data updated 2026-06-11

Monthly traffic trend

  • 2025/9: 1.9K Monthly visits
  • 2026/1: 1.3K Monthly visits
  • 2026/2: 666 Monthly visits
  • 2026/3: 922 Monthly visits
  • 2026/4: 1.7K Monthly visits
  • 2026/5: 358 Monthly visits

Top regions

Top 5 countries/regions
Country/regionPercentageTraffic
🇺🇸United States100%358

Search keywords

chat csvchatcsvchatwithcsvcsv to charttool csv to chart svg cli -online
Traffic-based selection guidance: ChartAI is registered under a chartai.io subpath, so its large visible total may include the host platform. The current data does not justify choosing ChartAI for traffic alone; shortlist by unique taxonomy and use case, then validate with the same tasks.

Usage comparison

Compare the core capabilities of ChartAI and chat2csv

ChartAI Core features

Visualization
Code Generation
Analytics

chat2csv Core features

Visualization
Business Intelligence
Builders
Data Analysis

Use cases

ChartAI Use cases

AI chart
business intelligence
chart generator
data analysis
data visualization
natural language processing
CSV to chart
report generation
synthetic data

chat2csv Use cases

AI chart
business intelligence
chart generator
data analysis
data visualization
natural language processing
csv
NLP
no-code
report generator

ChartAI vs chat2csv:In-depth comparison and selection guidance

First decide whether the products solve the same kind of need

This in-depth ChartAI vs chat2csv comparison uses only the product records, taxonomy, audience, traffic, and community signals available on this page. ChartAI is primarily listed under “Visualization”, while chat2csv is primarily listed under “Business Intelligence”, so the first decision is whether your actual task matches their recorded scope.

The structured fields currently show these decision-relevant differences: Primary category (ChartAI: Visualization; chat2csv: Business Intelligence); Monthly visits (ChartAI: 29.5K; chat2csv: 358); Monthly growth (ChartAI: 7.1%; chat2csv: -78.5%); Favorites (ChartAI: 137; chat2csv: 98); Website (ChartAI: chartai.io; chat2csv: chat2csv.com). These facts are more useful for selection than brand visibility alone.

What market visibility and monthly traffic mean

In the ChartAI vs chat2csv monthly traffic comparison, ChartAI currently shows 29.5K visits and chat2csv shows 358; ChartAI has about 82.4 times the visible traffic of chat2csv, an absolute difference of about 29.1K visits. This reflects visible reach, not feature quality or paid users.

Both tools provide verified traffic details, so monthly trends, visit depth, regions, and acquisition sources can be compared on the same basis.

ChartAI is registered at the chartai.io/zh subpage. Because the current data does not state whether other host pages are excluded, treat this as domain-level context rather than independent traffic for one product or project.

ChartAI is registered under a chartai.io subpath, so its large visible total may include the host platform. The current data does not justify choosing ChartAI for traffic alone; shortlist by unique taxonomy and use case, then validate with the same tasks.

Product positioning, use cases, and roles

ChartAI and chat2csv currently overlap in shared categories: Visualization; shared tags: AI chart, business intelligence, chart generator, data analysis, data visualization, and natural language processing. This can place both on the same shortlist, but it does not prove equal implementation, depth, or cost.

ChartAI's unique categories/tags are Code Generation, Analytics, CSV to chart, report generation, and synthetic data; chat2csv's are Business Intelligence, Builders, Data Analysis, csv, NLP, no-code, and report generator. These unique fields are the strongest differentiators: validate the product whose recorded scope matches the task instead of following traffic alone.

What ratings, comments, and favorites can tell you

ChartAI has no verified rating, 0 comments, 137 favorites, and 126 likes;chat2csv has no verified rating, 0 comments, 98 favorites, and 102 likes。

Neither product has enough rating or comment samples for a credible reputation ranking.

Selection guidance by actual need

When to evaluate ChartAI first

Put ChartAI on the priority trial list when the task aligns with “Visualization” and especially Code Generation, Analytics, CSV to chart, report generation, and synthetic data. This follows recorded positioning and does not imply unlisted capabilities are absent.

ChartAI also currently records: pricing is freemium, product type is website, 29.5K monthly visits shown for the registered host (subpage scope unknown), no verified user rating. Verify any hard requirement around price, platform, or reach before trial, and do not let sparse review data substitute for testing.

When to evaluate chat2csv first

Put chat2csv on the priority trial list when the task aligns with “Business Intelligence” and especially Business Intelligence, Builders, Data Analysis, csv, NLP, and no-code. This follows recorded positioning and does not imply unlisted capabilities are absent.

chat2csv also currently records: pricing is freemium, product type is website, 358 verified monthly visits, no verified user rating. Verify any hard requirement around price, platform, or reach before trial, and do not let sparse review data substitute for testing.

How to validate the recommendation before deciding

The available data describes positioning, public visibility, and community signals, but it cannot prove output quality, speed, integration effort, privacy, or long-term cost in your workflow. Before deciding, run the same representative tasks in ChartAI and chat2csv, then record completion time, accuracy, manual corrections, and the real paid threshold. A like-for-like trial turns this comparison into a defensible adoption decision.

Comparison FAQ

How should I choose between ChartAI and chat2csv?
Compare positioning, pricing, taxonomy, and traffic maturity, then verify the latest details on each official website.
Where does this comparison data come from?
The factual baseline is derived from product, taxonomy, traffic, and community data. Reviewed editorial conclusions show their source and verification date.
What do unknown fields mean?
Unknown means there is not enough reliable evidence; the page does not fill gaps with assumptions.