

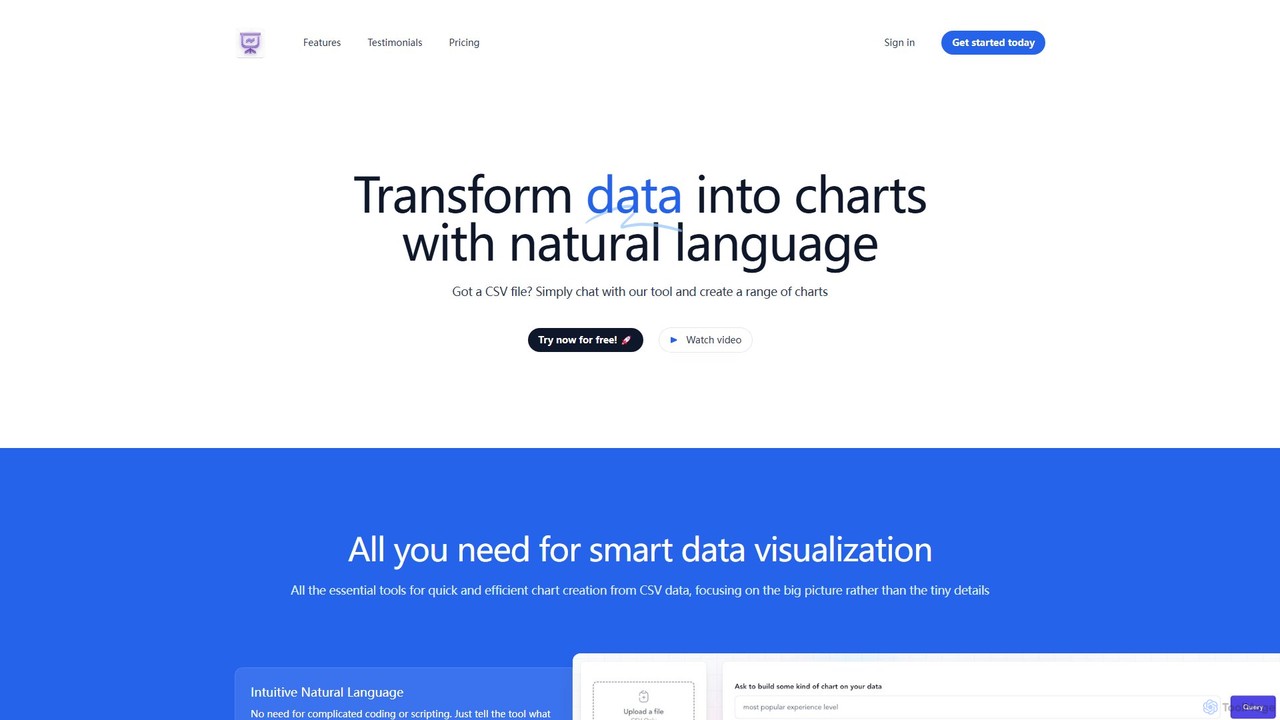
chat2csv Overview
chat2csv is a revolutionary AI-driven platform designed to simplify and democratize data visualization. It empowers users to convert raw data from CSV files into insightful and professional-looking charts simply by using natural language. The core philosophy of chat2csv is to eliminate the steep learning curve and technical barriers associated with traditional data analysis software. Instead of writing complex code or navigating intricate menus, you can simply 'talk' to your data, making the process of generating visualizations as easy as having a conversation.
The platform is built for speed and efficiency, catering to a wide range of users, from business analysts and marketers to students and researchers. It focuses on providing a streamlined experience, allowing you to focus on the insights from your data rather than the technicalities of chart creation. With a strong emphasis on data security, chat2csv ensures that your sensitive information remains private, processing only the necessary metadata on its servers while the actual data stays on your local machine.
How to use chat2csv
Using chat2csv is an incredibly straightforward three-step process designed for maximum simplicity and efficiency:
- Upload Your CSV File: Begin by dragging and dropping your CSV file onto the platform or selecting it from your computer. The tool is optimized to handle various CSV formats, provided they include headers for data recognition.
- Chat with the AI: Once your file is uploaded, use the chat interface to issue commands in plain English. For example, you can type requests like "Create a bar chart of sales by region," "Show me a pie chart of my expenses by category," or "Generate a line graph of user sign-ups over the last month."
- Generate and Refine: The AI will instantly interpret your command and generate the corresponding chart. You can then continue the conversation to refine the visualization, change chart types, or explore different aspects of your data without starting over. The AI can also provide suggestions for the most effective chart types for your specific dataset.
Core Features of chat2csv
- Intuitive Natural Language Interface: The standout feature is the ability to use plain English to command the tool. This eliminates the need for any coding or scripting knowledge, making data visualization accessible to everyone.
- Smart AI Support: The platform's AI does more than just follow commands. It intelligently analyzes your data and can suggest the most suitable chart types to uncover hidden patterns and enhance your insights.
- Wide Variety of Charts: chat2csv supports a diverse range of chart types to meet any visualization need, including bar charts, line graphs, pie charts, scatter plots, area charts, and more.
- Secure and Privacy-Focused: Your data's security is a top priority. The architecture is designed so that your actual data is processed in your browser and never leaves your computer. Only non-sensitive metadata is sent to the servers for processing.
- No-Code Platform: The entire experience is 100% code-free. It's a purely visual and conversational tool, saving you time and effort that would otherwise be spent on learning complex software.
Use Cases for chat2csv
chat2csv is versatile and can be applied in numerous professional and academic scenarios:
- Business Analysts: Quickly visualize sales figures, track key performance indicators (KPIs), and create reports for stakeholder meetings without relying on complex BI tools.
- Marketing Professionals: Analyze marketing campaign performance, visualize customer segmentation data, and track website traffic trends from exported CSVs.
- Students and Researchers: Effortlessly chart survey results, experimental data, and research findings for papers and presentations.
- Small Business Owners: Gain a clear view of revenue, expenses, inventory, and customer data to make informed business decisions.
- Product Managers: Analyze user engagement metrics, feature adoption rates, and feedback data to guide product development.
Advantages of chat2csv
The primary advantage of chat2csv is its unparalleled simplicity and speed. It dramatically reduces the time it takes to get from raw data to a clear visualization. Its accessibility empowers non-technical team members to perform their own data analysis, fostering a more data-driven culture. The AI-powered suggestions help users discover more effective ways to present their data, leading to deeper and more meaningful insights. Finally, its commitment to privacy provides peace of mind when working with sensitive information.
Pricing and Plans
chat2csv offers a simple and accessible pricing structure:
- Free Access: This plan is perfect for getting started and handling smaller tasks. It includes 15 queries per hour, the ability to work with 1 CSV file at a time, a 1MB file size limit, and 5 AI prompts per file.
- Premium Plan (Coming Soon): For more demanding users, the upcoming premium plan will offer significantly higher limits and advanced features. For a pre-sale price of $15/month, users will get 120 queries per hour, support for multiple CSV files, a 5MB file limit, 100 AI prompts per file, and secure cloud storage for charts and data history.
Traffic
Latest traffic
Status
Monthly traffic trend
- 2025-9: 1.9K
- 2026-1: 1.3K
- 2026-2: 666
- 2026-3: 922
- 2026-4: 1.7K
- 2026-5: 358
Geography
Top 5 countries / regions
- 🇺🇸United States100.0%
Top keywords
| Keyword | Cost per click |
|---|---|
| chat csv | $0.00 |
| chatcsv | $0.00 |
| chatwithcsv | $0.00 |
| csv to chart | $0.00 |
| tool csv to chart svg cli -online | $0.00 |
chat2csv Alternatives
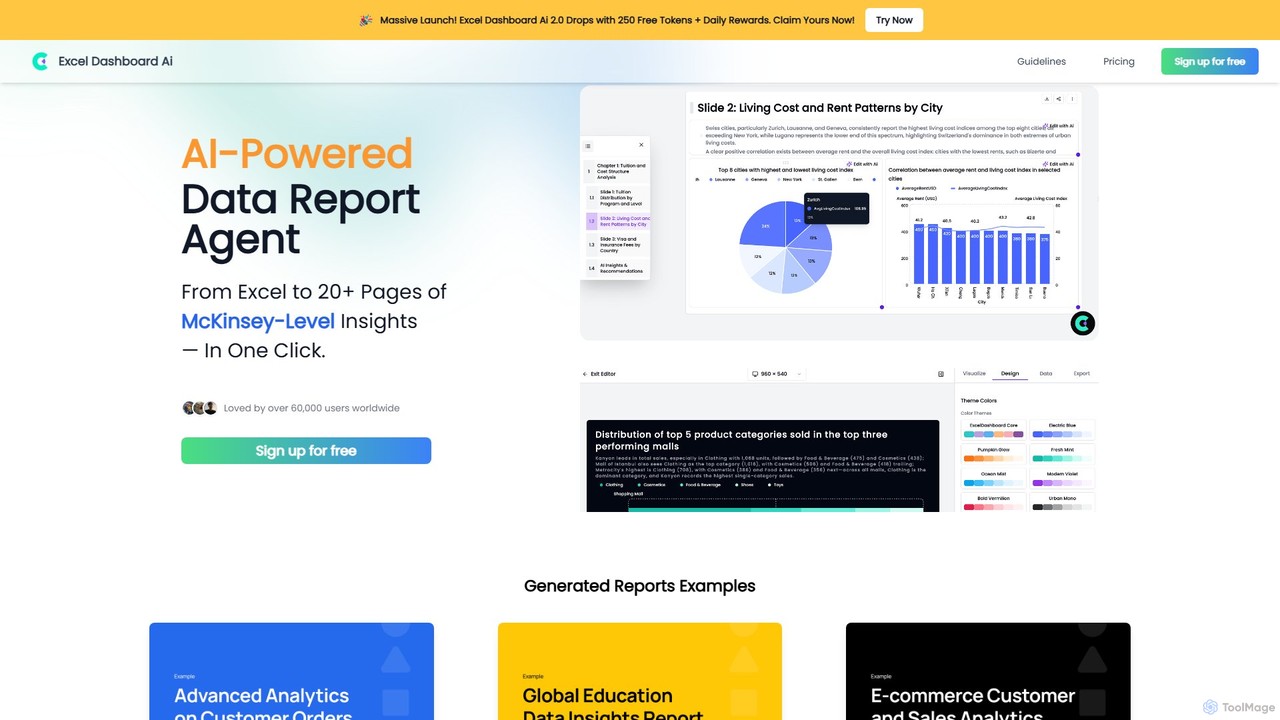
ExcelDashboard.ai
ExcelDashboard.ai is an AI-powered data analysis tool that instantly transforms raw Excel or CSV files into interactive dashboards and comprehensive, multi-page reports. With a single click, it generates deep, McKinsey-level insights, visualizes data, and allows users to explore information using natural language commands. It's designed for users of all skill levels to make data-driven decisions without needing programming expertise.
Business Intelligence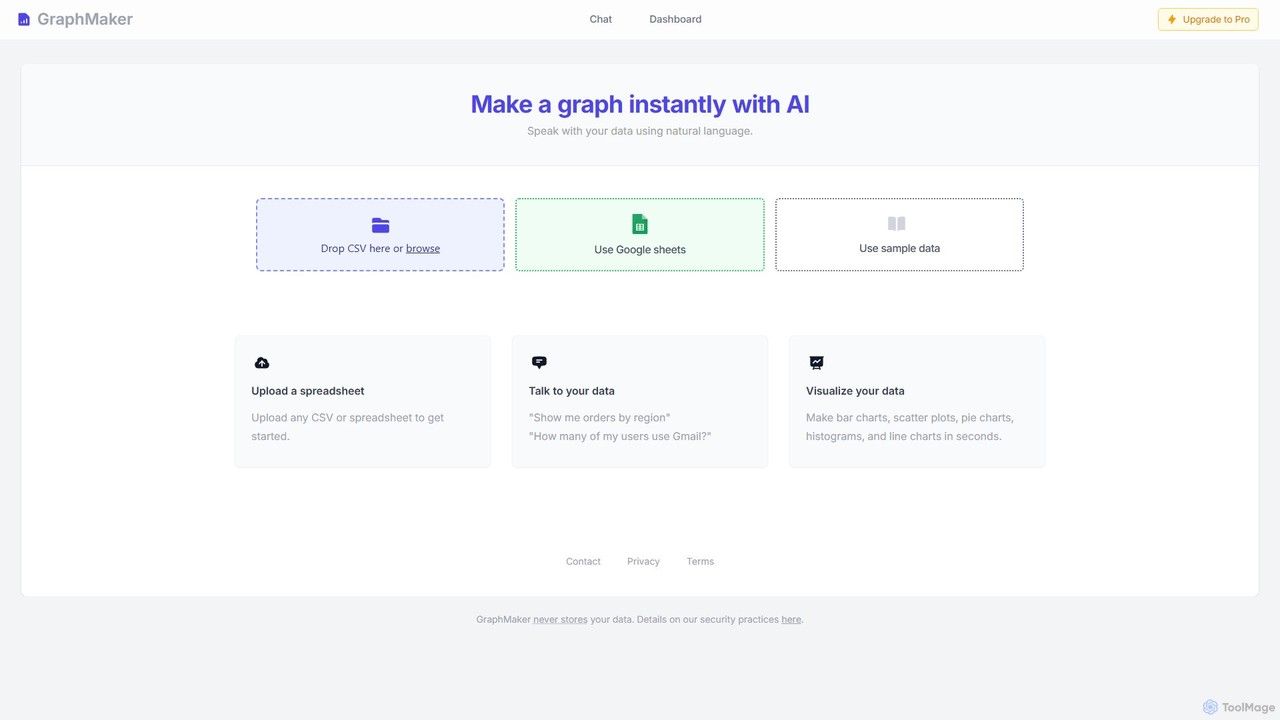
GraphMaker
GraphMaker is an AI-powered data visualization tool that allows you to create various charts and graphs in seconds. Simply upload your data from a CSV file or Google Sheets, and use natural language commands to generate insightful visualizations like bar charts, pie charts, and histograms. It's designed for speed, simplicity, and security, as it never stores your data.
Business Intelligence
Viewit Ai Chatbot
An AI-powered chatbot that transforms your data into insightful visualizations and summaries through simple, natural language conversations. Upload your dataset, ask questions, and instantly receive charts, graphs, and key metrics, making data analysis accessible to everyone without needing complex software or coding skills.
Business Intelligence
Othor AI
Othor AI is a no-code business intelligence platform that transforms your data into actionable insights in seconds. It automatically generates narrative-driven reports, smart charts, and predictive analytics, enabling anyone in your organization to make faster, data-driven decisions without technical expertise. Connect your data sources and get instant dashboards and executive summaries.
Business Intelligence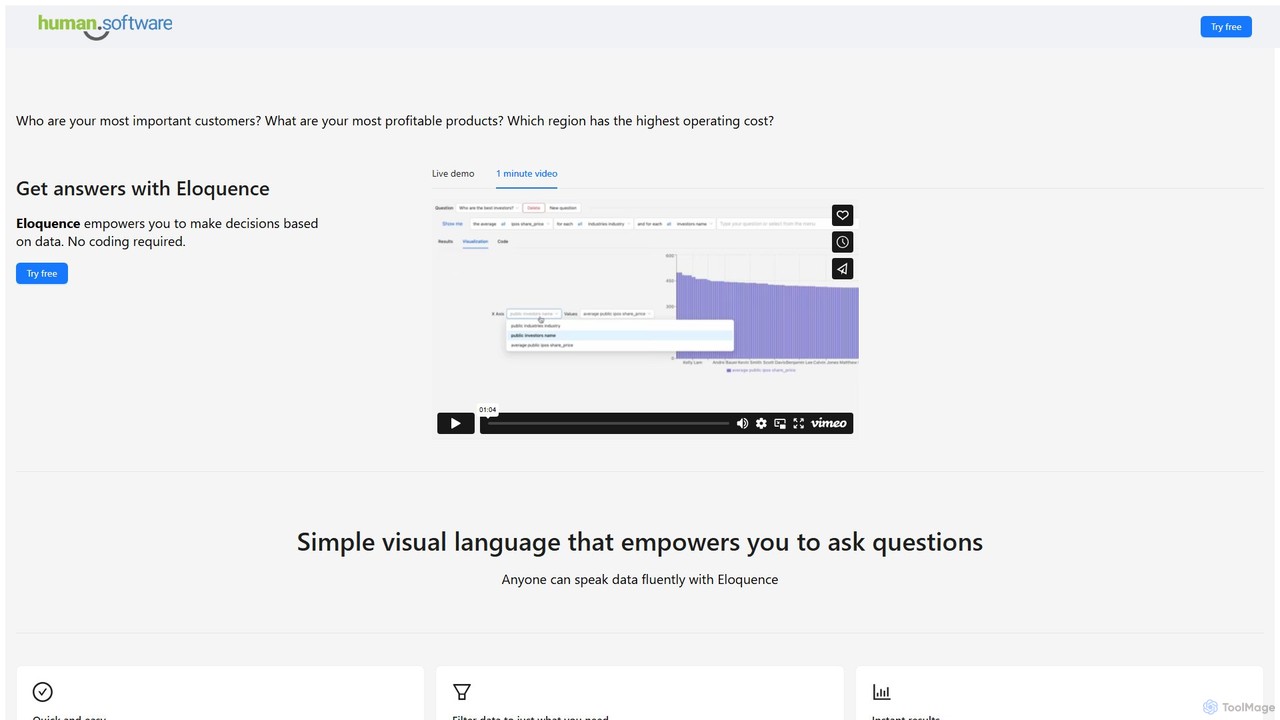
Eloquence
Eloquence is a no-code business intelligence platform that empowers anyone to query databases using structured natural language. Connect your data, ask complex questions without writing code, and get instant answers to make data-driven decisions. It prioritizes security with robust encryption and a strict no-data-saved policy.
Business Intelligencechat2csv Categories
chat2csv Embed Widget
Copy this embed code to place the badge on your blog, article, or product site and send readers directly to this ToolMage detail page.

Related AI tools
ExcelDashboard.ai
ExcelDashboard.ai is an AI-powered data analysis tool that instantly transforms raw Excel or CSV files into interactive dashboards and comprehensive, multi-page reports. With a single click, it generates deep, McKinsey-level insights, visualizes data, and allows users to explore information using natural language commands. It's designed for users of all skill levels to make data-driven decisions without needing programming expertise.
Business Intelligence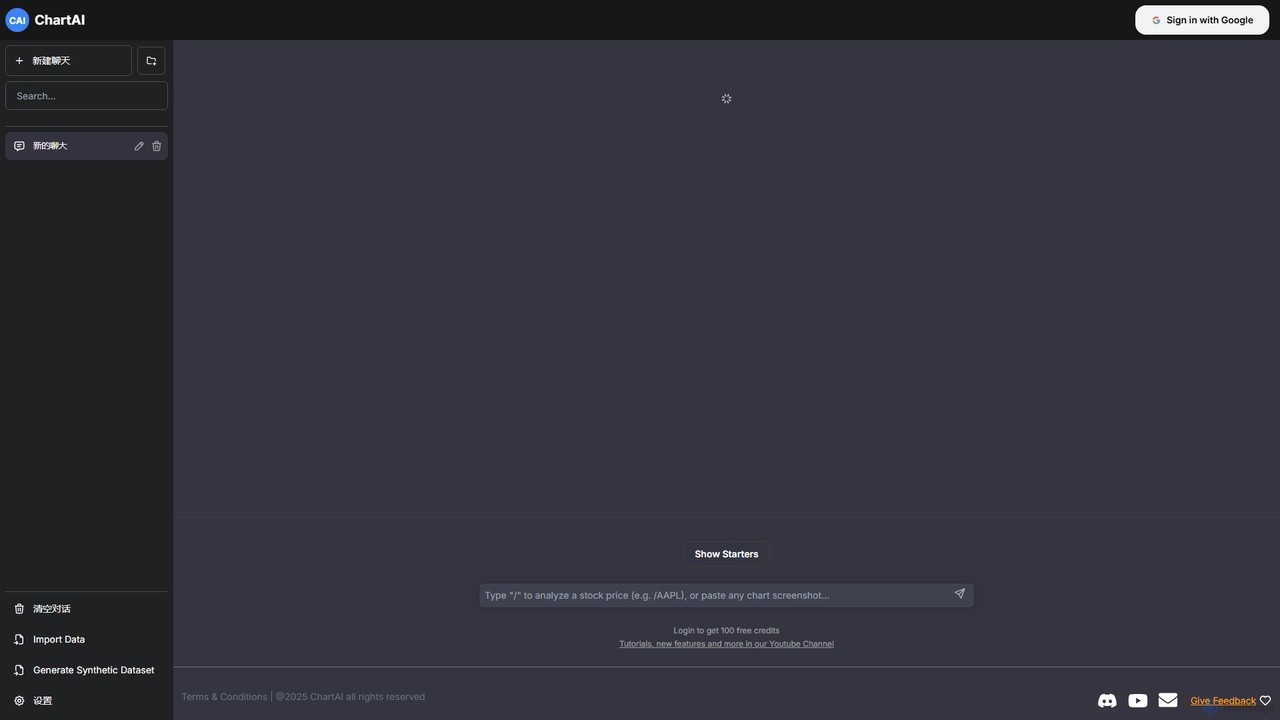
ChartAI
ChartAI is an AI-powered data visualization tool that transforms natural language prompts into stunning charts and graphs. Import your own data or generate synthetic datasets, then simply chat with the AI to analyze information and create visualizations instantly. Ideal for analysts, researchers, and anyone needing to quickly understand and present data without writing code.
Visualization
DatViz AI
DatViz AI is an advanced analytics platform that uses natural language to transform complex datasets into insightful, visually appealing charts and graphs. Powered by OpenAI's LLM, it simplifies data analysis, calculates key statistics, and generates visualizations like bar charts, heatmaps, and geomaps without any coding required.
Business IntelligenceGraphMaker
GraphMaker is an AI-powered data visualization tool that allows you to create various charts and graphs in seconds. Simply upload your data from a CSV file or Google Sheets, and use natural language commands to generate insightful visualizations like bar charts, pie charts, and histograms. It's designed for speed, simplicity, and security, as it never stores your data.
Business IntelligenceViewit Ai Chatbot
An AI-powered chatbot that transforms your data into insightful visualizations and summaries through simple, natural language conversations. Upload your dataset, ask questions, and instantly receive charts, graphs, and key metrics, making data analysis accessible to everyone without needing complex software or coding skills.
Business Intelligence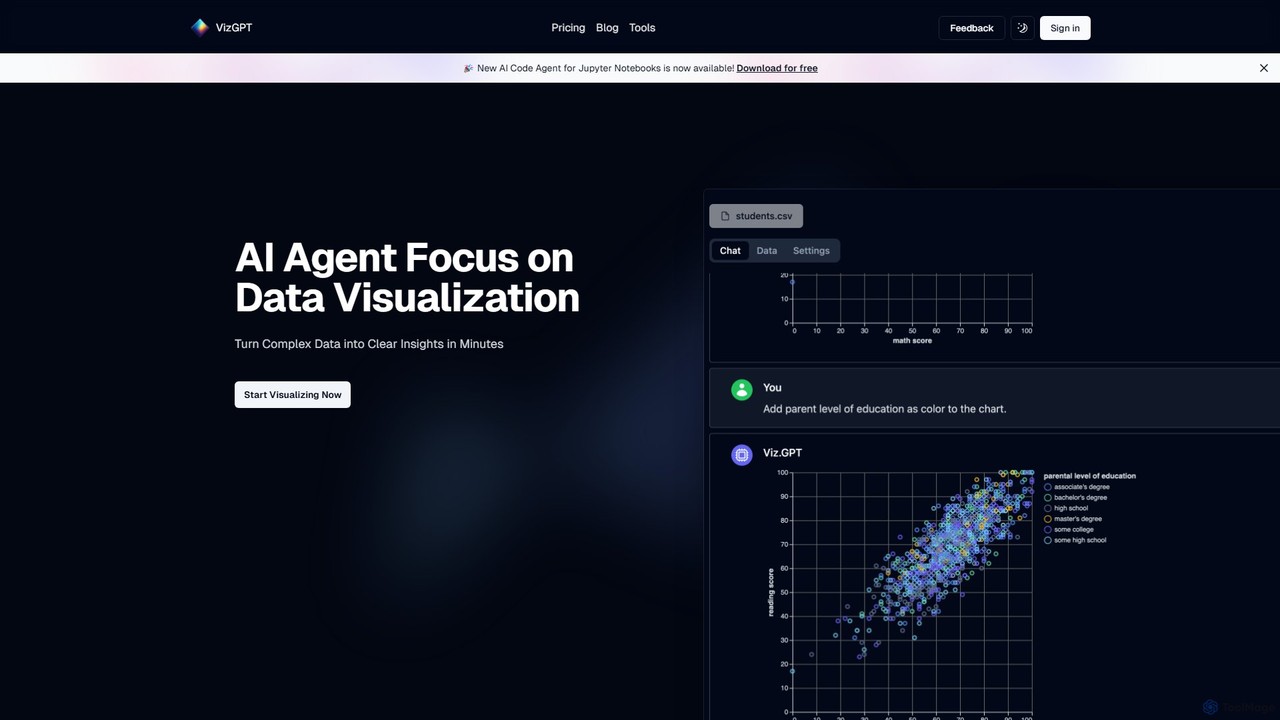
vizGPT
vizGPT is an AI-powered data visualization tool that transforms complex data into clear insights using natural language. Simply ask questions in plain English to generate charts and graphs instantly, without any coding. It supports various data sources and offers both a conversational interface and a no-code drag-and-drop editor, making data analysis accessible to everyone.
Jupyter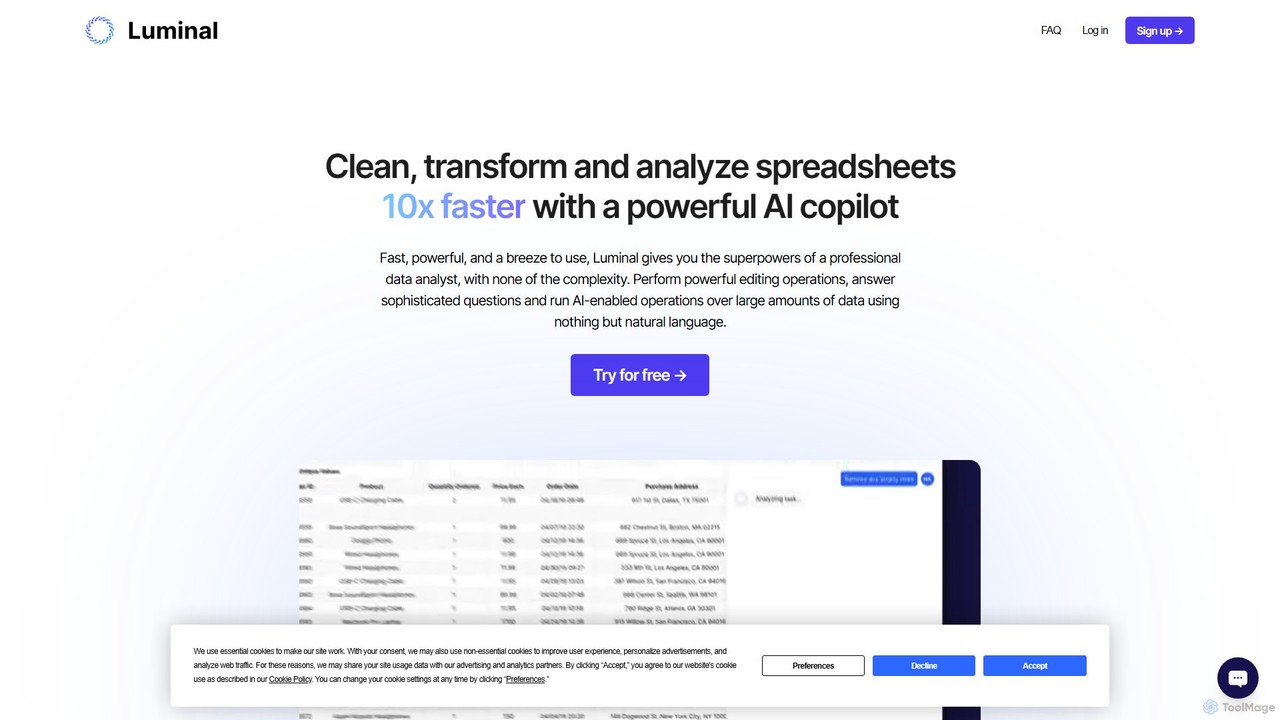
Luminal
Luminal is a powerful AI copilot that revolutionizes spreadsheet management. It allows users to clean, transform, analyze, and visualize data up to 10x faster using simple, natural language commands. Eliminate complex formulas and manual data processing, saving hours of work on large datasets.
Data Management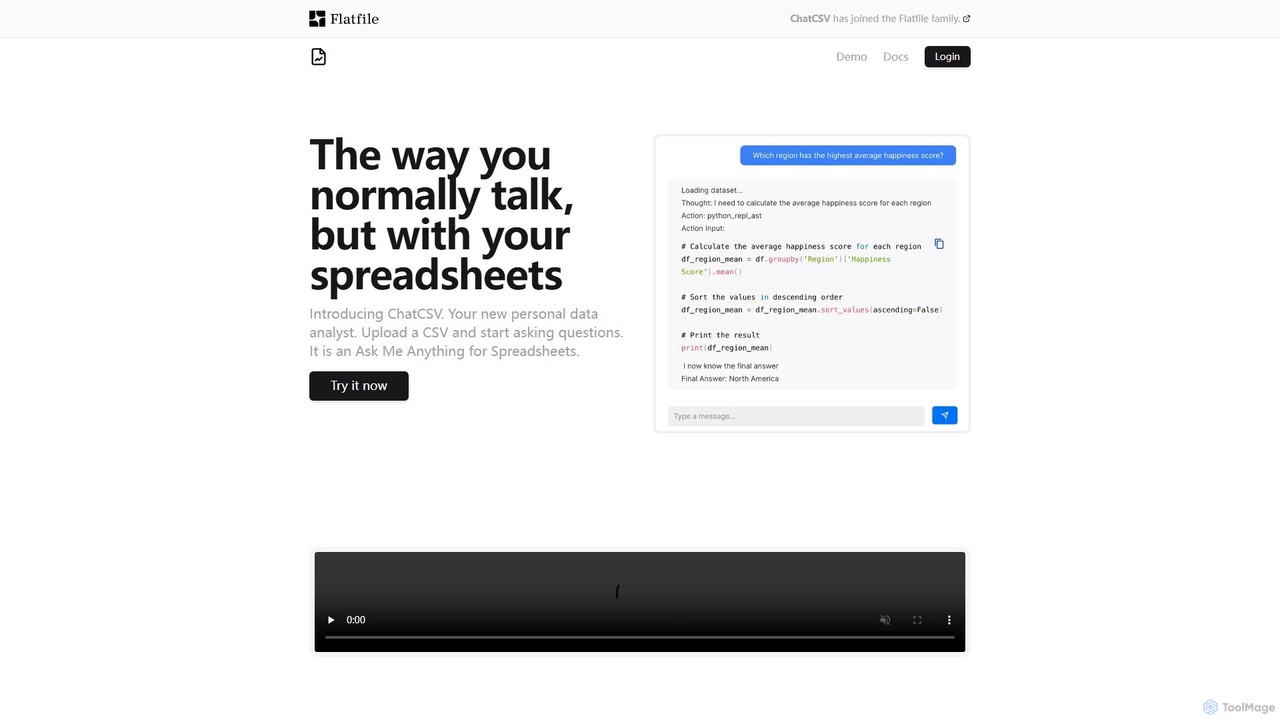
ChatCSV
ChatCSV is an AI-powered data analyst that allows you to interact with your CSV files using natural language. Upload your spreadsheet and ask questions to get instant insights, analysis, and data visualizations without writing any code or complex formulas.
Business Intelligence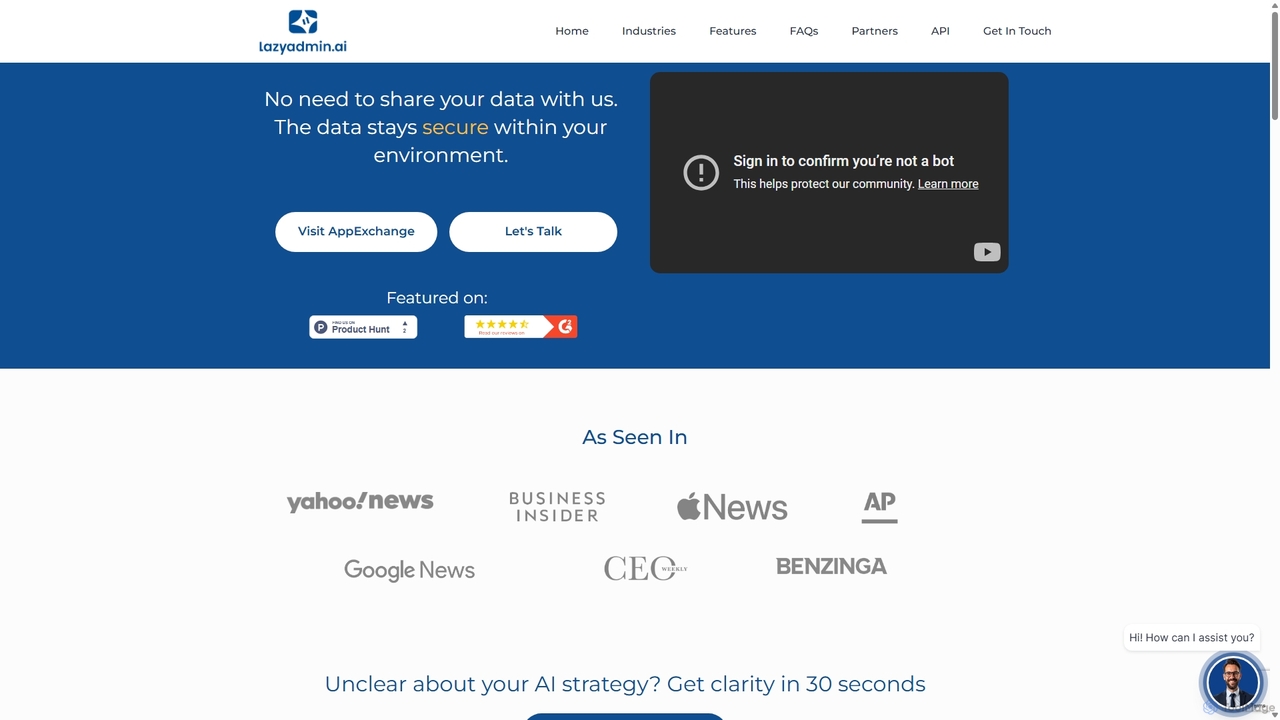
Lazy Admin
Lazy Admin is an AI-powered data analysis and reporting solution designed primarily for Salesforce. It enables users to query data, generate charts, and create dashboards using natural language. The tool emphasizes security by keeping all data within your environment and can be personalized to understand your specific business terminology, making data insights accessible to everyone on your team.
Business Intelligence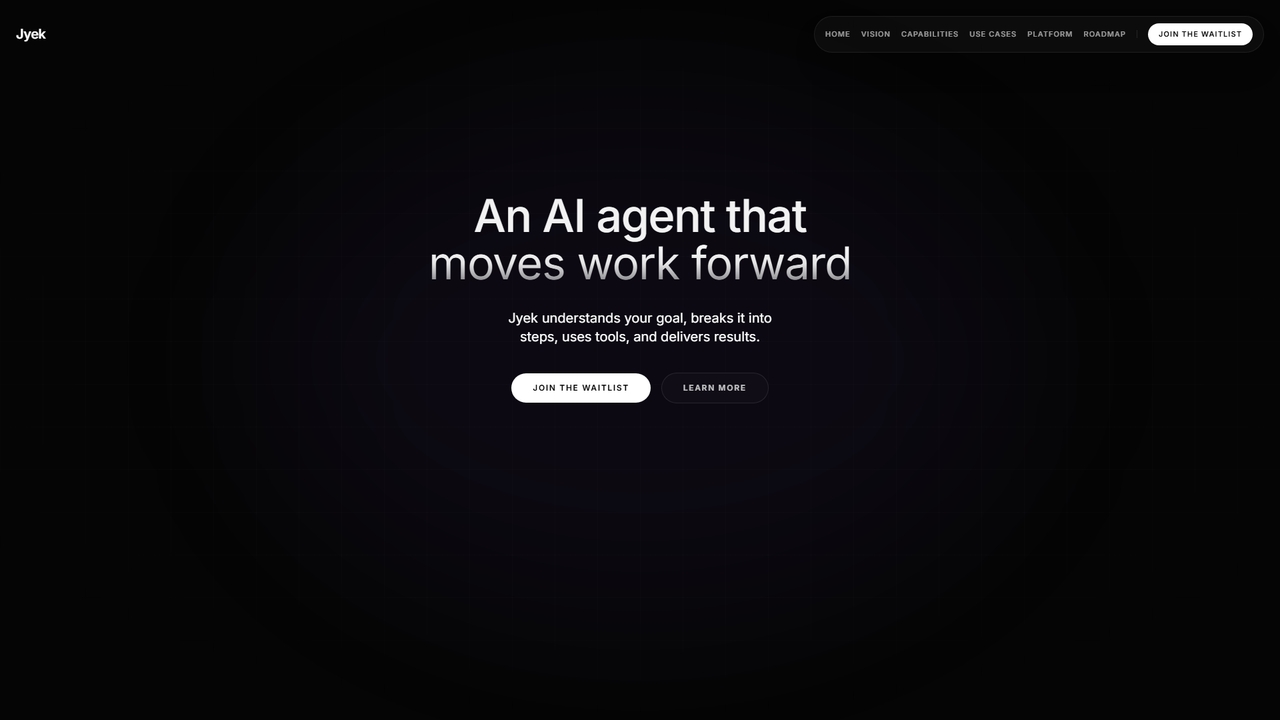
Jyek
Jyek is an AI agent platform that understands objectives, creates execution plans, uses tools, and delivers verifiable results for complex, multi-step tasks.
Automation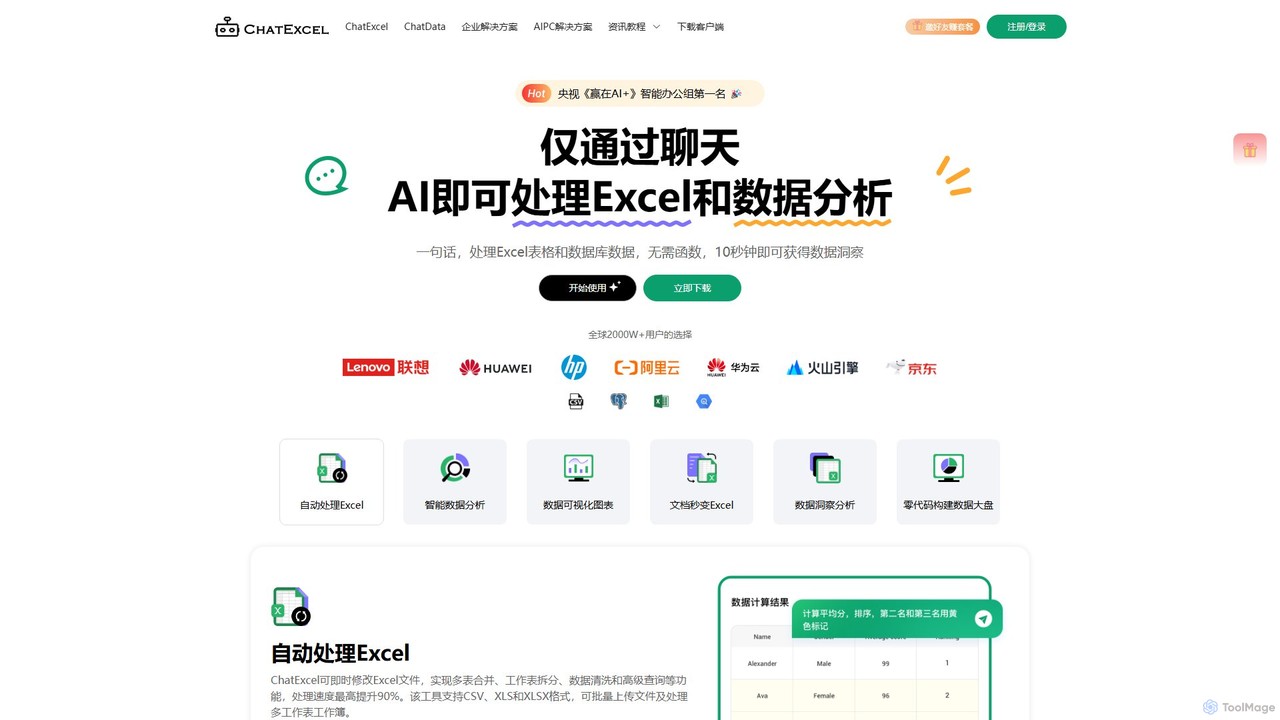
ChatExcel
ChatExcel is an AI-powered data analysis tool that allows users to process spreadsheets and analyze data through a simple chat interface. It automates tasks like data cleaning, merging, and analysis, and generates over 100 types of charts and visualizations from natural language commands. No coding or complex formulas required, boosting productivity by up to 90%.
Business Intelligence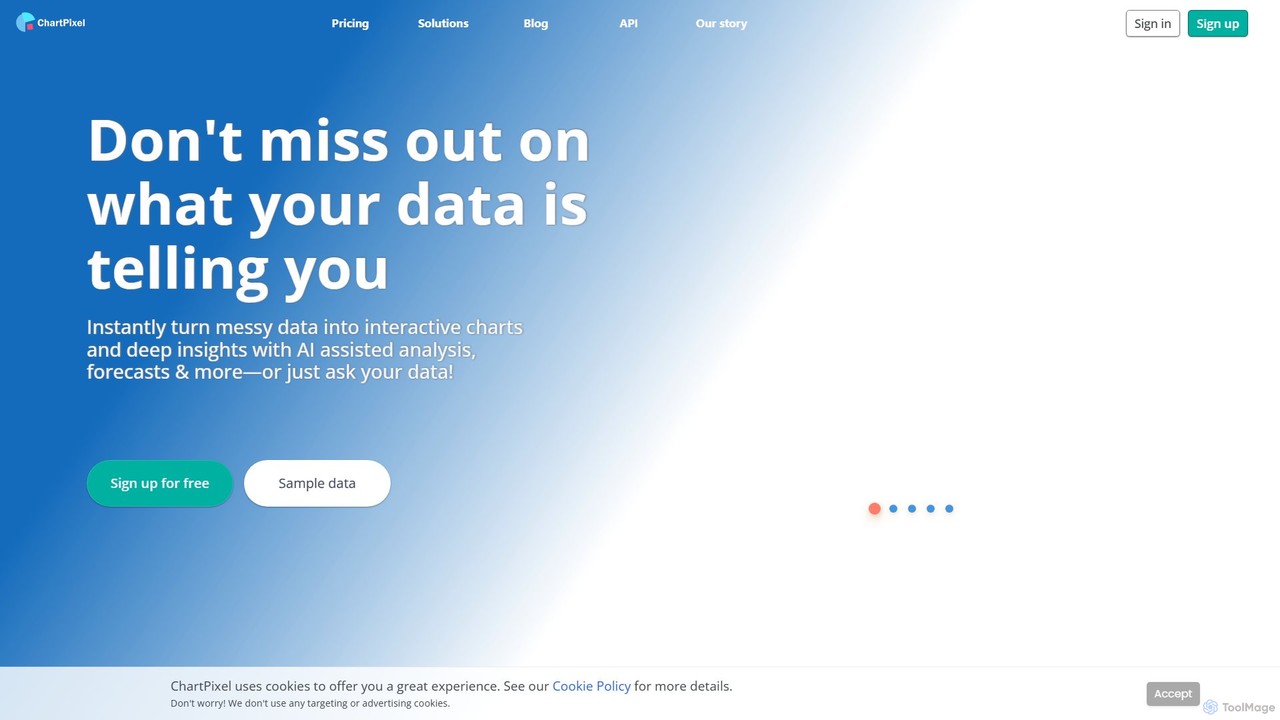
ChartPixel
ChartPixel is an AI-powered data analysis and visualization platform that instantly transforms raw, messy data into interactive charts and actionable insights. With a no-code interface, it allows users to chat with their data, generate forecasts, and uncover statistical patterns effortlessly. It's designed for everyone from students and researchers to business professionals, ensuring secure and reliable data-driven decision-making.
Business Intelligence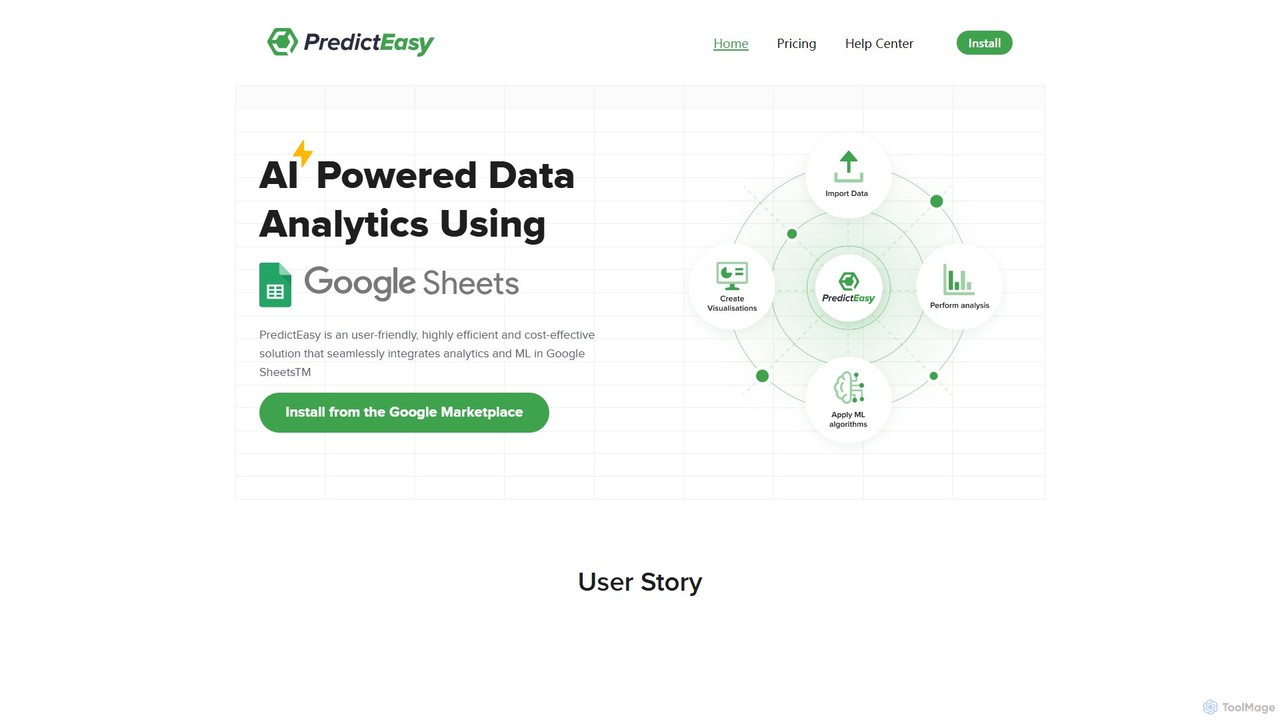
PredictEasy
PredictEasy is a powerful no-code AI add-on for Google Sheets that democratizes data analytics. It allows users to perform advanced tasks like predictive modeling, time-series forecasting, NLP, and statistical analysis with just a few clicks. Ideal for business professionals, researchers, and data analysts, it transforms your spreadsheet into a sophisticated data science tool, enabling data-driven decisions without writing any code.
Business Intelligence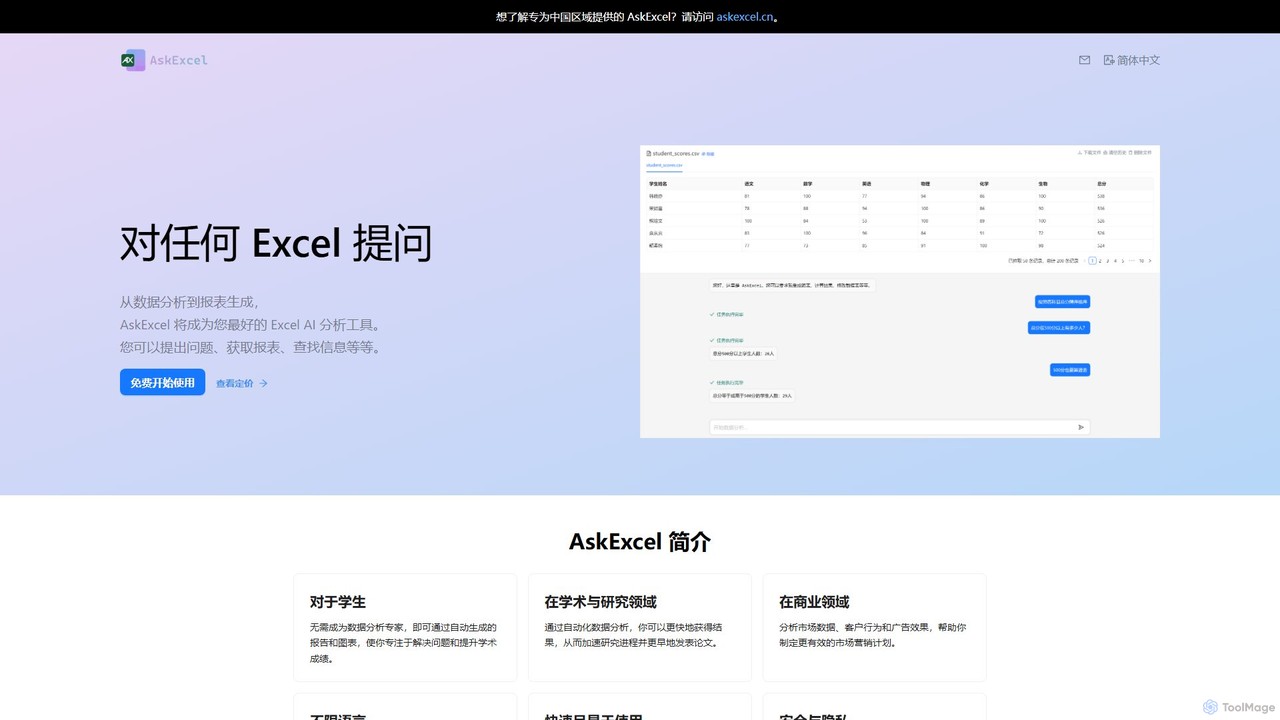
AskExcel
AskExcel is an AI-powered data analysis tool that transforms your Excel spreadsheets into interactive conversations. Simply upload your file, ask questions in natural language, and instantly receive data analysis, reports, and visualizations without writing any formulas or code.
Business Intelligence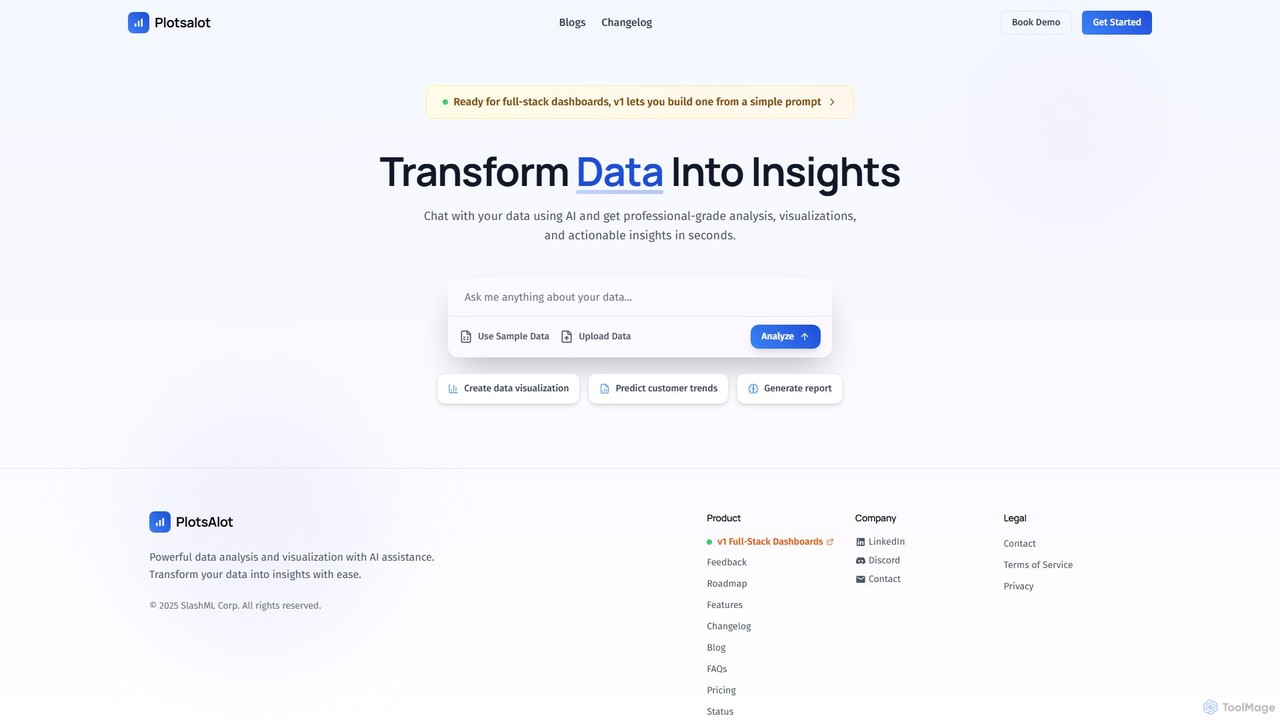
PlotsAlot
PlotsAlot is an AI-powered data analysis and visualization platform that transforms raw data into professional-grade charts, dashboards, and actionable insights. Simply upload your data and use natural language prompts to chat with it, perform advanced analysis, and predict trends in seconds.
Business Intelligence
chat2csv Comments (0)
Sign in to comment.
Sign inNo comments yet.