ChartPixel
Visit WebsiteChartPixel Overview
ChartPixel is a revolutionary AI-driven platform designed to make data analysis and visualization accessible and effortless for everyone. It empowers users to instantly convert complex and messy datasets, spreadsheets, or even webpage tables into a gallery of interactive, insightful charts. By blending the power of artificial intelligence with robust statistical methods, ChartPixel automates the entire process from data cleaning to insight generation, allowing you to focus on making informed, data-driven decisions.
The platform's core philosophy is to eliminate the steep learning curve associated with traditional data analysis tools. With its no-code, user-friendly interface, you don't need to be a data scientist to uncover the stories hidden in your data. ChartPixel intelligently handles missing values, formats data correctly, and automatically selects the most appropriate chart types to reveal trends, correlations, and patterns. Furthermore, its unique 'Chat with Data' feature allows you to ask questions in natural language and receive immediate answers, making data exploration intuitive and conversational.
How to use ChartPixel
Using ChartPixel is a simple, streamlined process: 1. **Upload Your Data:** Start by uploading your data file (e.g., a spreadsheet) or pasting data directly. 2. **AI-Powered Analysis:** ChartPixel's AI engine immediately gets to work. It automatically cleans the data, handling issues like missing values, inconsistent formatting, and country codes. 3. **Instant Visualization:** The platform automatically generates a variety of relevant, interactive charts and visualizations, such as maps, bar charts, scatter plots, and more. Each chart comes with AI-generated titles, descriptions, and key takeaways. 4. **Explore and Interact:** Dive deeper using the 'Chat with Data' feature to ask specific questions. Use the guided exploration mode to discover new perspectives and insights. 5. **Customize and Export:** Customize your charts with different colors and styles. When you're ready, export your charts and insights directly into a PowerPoint presentation with a single click or share your entire project with a public link.
Core Features of ChartPixel
- AI-Assisted Data Analysis: Automatically cleans data, identifies patterns, and generates insights backed by statistical analysis.
- Interactive Chart Generation: Creates over 20 different types of interactive charts, maps, and animations, automatically selecting the best visualization for your data.
- Chat with Data: A conversational AI feature that lets you ask questions about your data in plain English and get instant answers.
- Automated Data Cleaning: Intelligently handles missing values, country codes, units, currencies, and other data inconsistencies to save you hours of manual work.
- No-Code Platform: A fully guided and intuitive interface that requires no programming or complex formula knowledge.
- Forecasting and Trend Analysis: Apply data science models with one click to generate forecasts and analyze trends.
- Secure and Reliable: Your data is secure. ChartPixel does not train its models on your data or send raw data to external LLMs, ensuring privacy and trustworthy results.
- One-Click Export & Sharing: Easily export charts and insights to PowerPoint or share your interactive project dashboard via a link for seamless collaboration.
Use Cases for ChartPixel
ChartPixel is a versatile tool trusted by a wide range of professionals and enthusiasts: For Students and Educators: It serves as an excellent educational tool to teach data analysis without the barrier of coding. For Business Owners and Analysts: Quickly analyze performance metrics, understand key business drivers, and generate forecasts to make strategic decisions. For Researchers: Accelerate the research process by quickly exploring datasets, identifying significant patterns, and validating hypotheses with statistical backing. For Journalists and Editors: Effortlessly create compelling, data-driven stories and visualizations to enhance articles and reports. For Hobby Analysts: Make sense of personal datasets, from analyzing sports statistics to tracking personal finances.
Advantages of ChartPixel
ChartPixel stands out by making sophisticated data analysis incredibly simple. It saves valuable time by automating tedious tasks like data cleaning and chart formatting. Its AI-driven insights are backed by real statistics, providing reliable and actionable information. The platform democratizes data science, empowering non-technical users to perform complex analyses and make better decisions. Its commitment to data security provides peace of mind, a critical factor when handling sensitive information.
Pricing and Plans
ChartPixel offers a flexible pricing structure to suit different needs:
- Free Plan: $0/month. Ideal for small projects, it includes 5 file uploads (up to 5MB, 1,000 rows), automated data cleaning, 5 stored projects, and limited chat prompts and customization.
- Silver Subscription: $11.99/month (billed annually). Perfect for most users, offering unlimited file uploads (up to 20MB, 10,000 rows), 20 projects, 1,000 chat prompts/month, and unlimited downloads, exports, and customizations without attribution.
- Gold Subscription: $39.99/month (billed annually). Best for larger projects and teams, this plan includes support for up to 5 team members, files up to 100,000 rows, unlimited storage, unlimited chat prompts, priority support, and API access (10,000 calls/month).
ChartPixel Comments (0)
Log in to post comments
Log in nowChartPixelWebsite Traffic Analysis
Latest Traffic
Status
Monthly Traffic Trend
Geography
Top 5 Countries/Regions
-
🇺🇸 United States35.55%
-
🇮🇳 India28.49%
-
🇦🇷 Argentina16.42%
-
🇭🇺 Hungary11.79%
-
🇵🇰 Pakistan7.75%
Popular Keywords
| Keyword | Cost Per Click |
|---|---|
|
$2.13
|
|
|
$0.00
|
|
|
$0.00
|
|
|
$0.00
|
|
|
$0.00
|
ChartPixel Alternatives
View All
ChatExcel
ChatExcel is an AI-powered data analysis tool that allows users to process spreadsheets and analyze data through a …
ChatExcel is an AI-powered data analysis tool that allows users to process spreadsheets and analyze data through a simple chat interface. It automates tasks like data cleaning, merging, and analysis, and generates over 100 types of charts and visualizations from natural language commands. No coding or complex formulas required, boosting productivity by up to 90%.
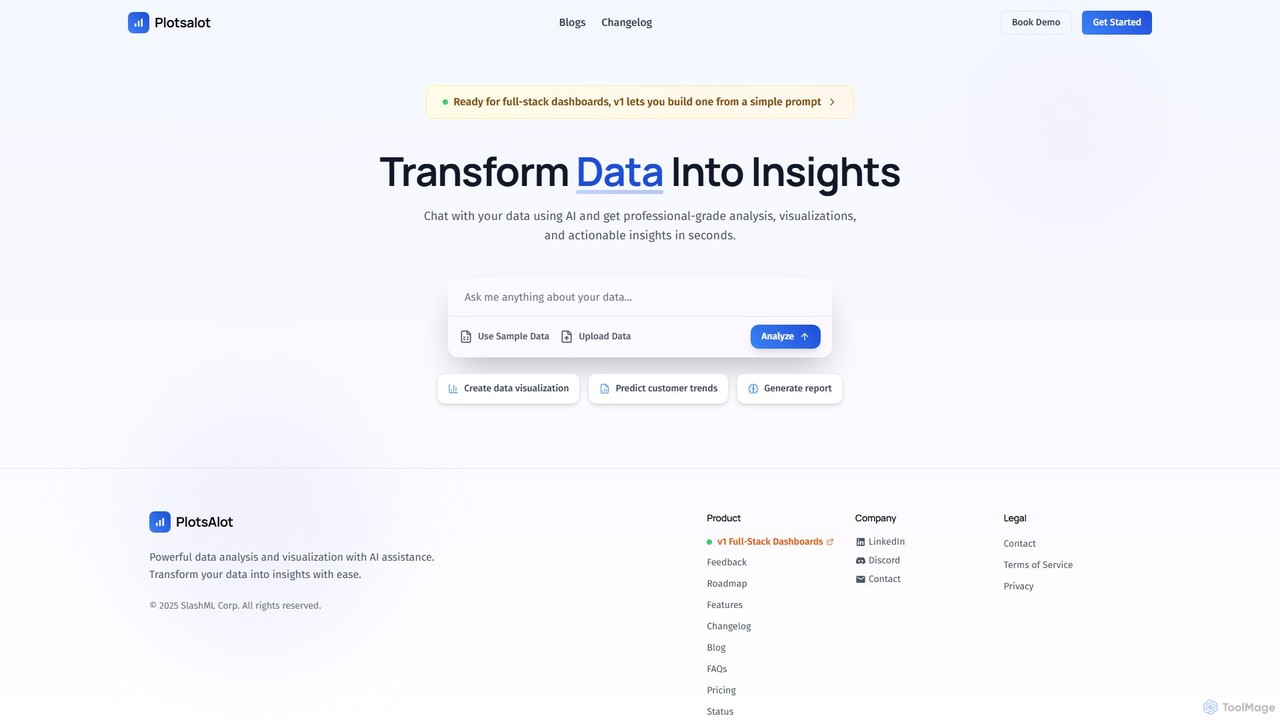
PlotsAlot
PlotsAlot is an AI-powered data analysis and visualization platform that transforms raw data into professional-grade charts, dashboards, and …
PlotsAlot is an AI-powered data analysis and visualization platform that transforms raw data into professional-grade charts, dashboards, and actionable insights. Simply upload your data and use natural language prompts to chat with it, perform advanced analysis, and predict trends in seconds.
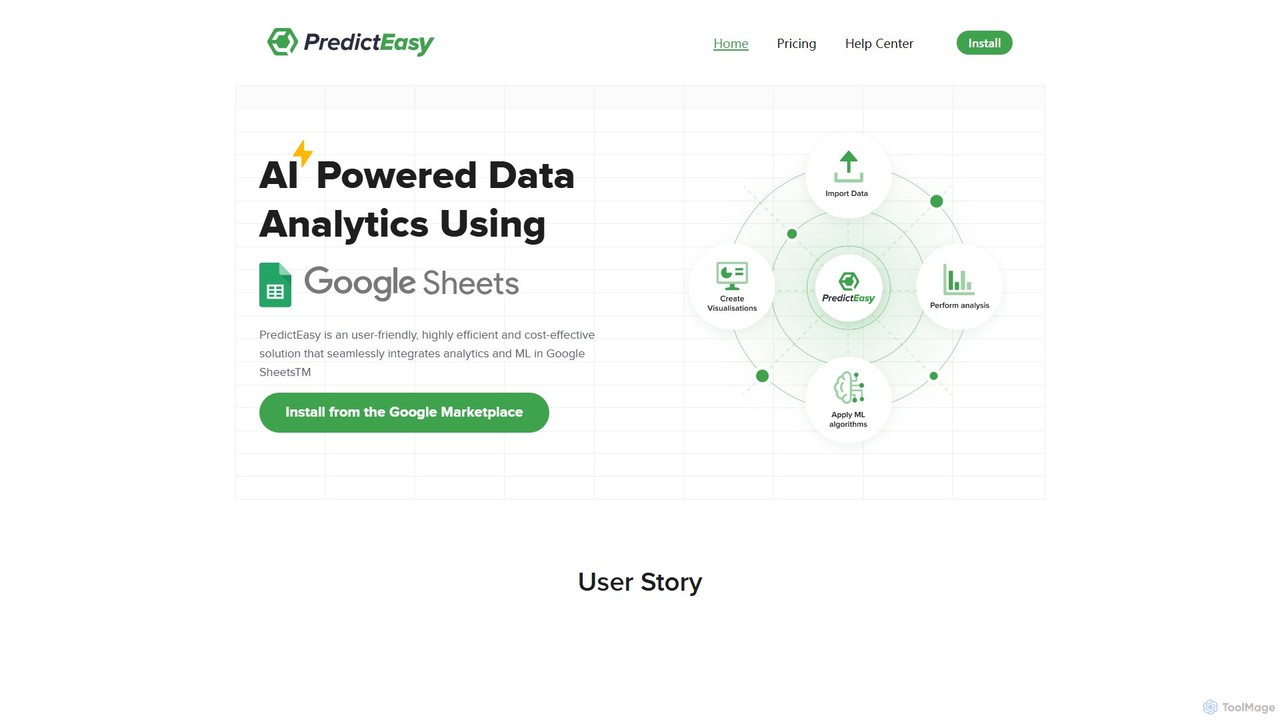
PredictEasy
PredictEasy is a powerful no-code AI add-on for Google Sheets that democratizes data analytics. It allows users to …
PredictEasy is a powerful no-code AI add-on for Google Sheets that democratizes data analytics. It allows users to perform advanced tasks like predictive modeling, time-series forecasting, NLP, and statistical analysis with just a few clicks. Ideal for business professionals, researchers, and data analysts, it transforms your spreadsheet into a sophisticated data science tool, enabling data-driven decisions without writing any code.
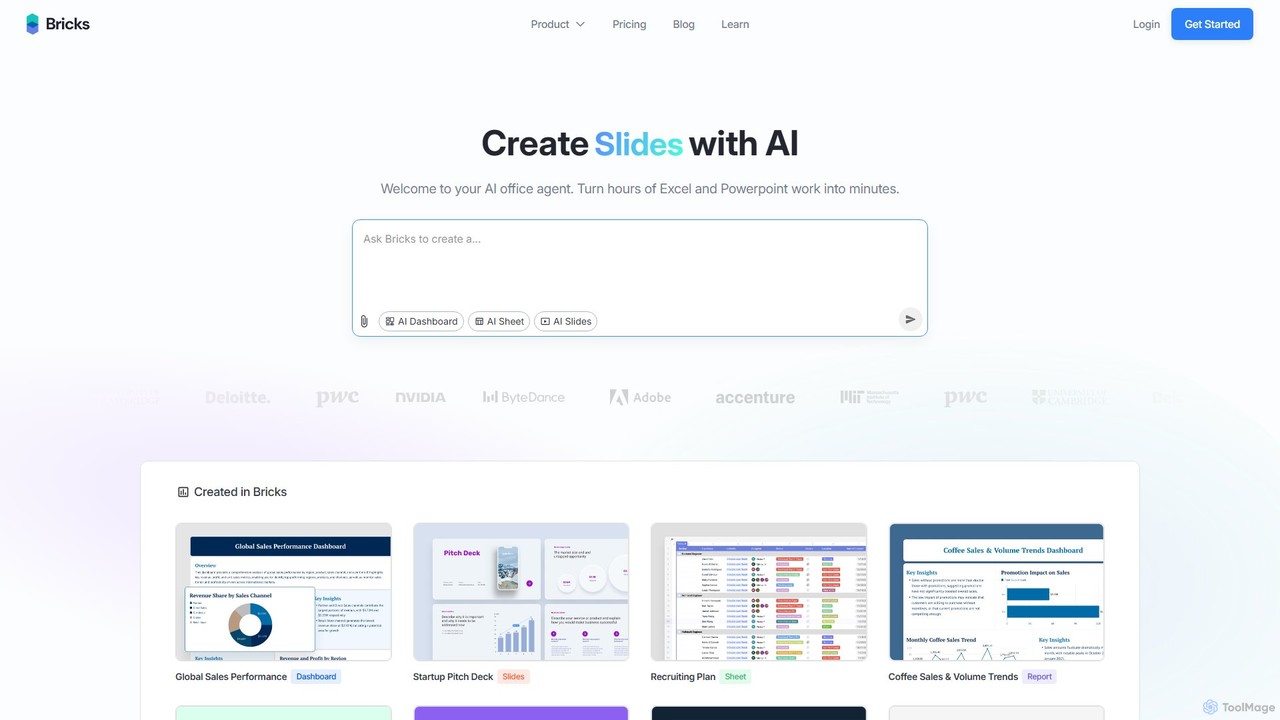
thebricks
thebricks is an AI-powered workspace that transforms data analysis and reporting. It allows users to create interactive dashboards, …
thebricks is an AI-powered workspace that transforms data analysis and reporting. It allows users to create interactive dashboards, dynamic spreadsheets, and professional slides using simple natural language prompts. Turn hours of manual work in Excel and PowerPoint into minutes, streamlining your workflow and boosting productivity.

Ajelix
Ajelix is an AI-powered suite of tools designed to enhance productivity for Excel and Google Sheets users. It …
Ajelix is an AI-powered suite of tools designed to enhance productivity for Excel and Google Sheets users. It acts as an AI data analyst, automating tasks, generating formulas and VBA scripts, creating insightful reports, and providing advanced data analysis through a simple chat interface.
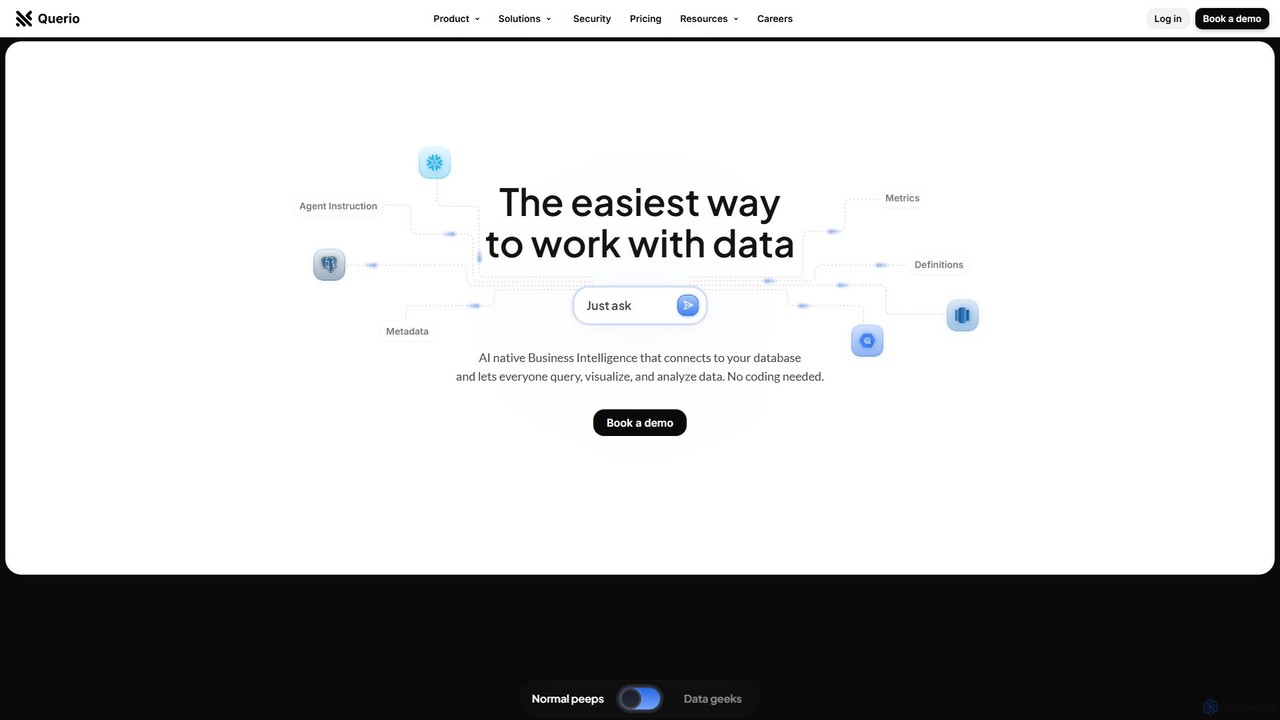
Querio
Querio is an AI-native Business Intelligence (BI) platform that allows teams to analyze their data using natural language. …
Querio is an AI-native Business Intelligence (BI) platform that allows teams to analyze their data using natural language. Connect directly to your database and ask questions to generate queries, visualizations, and reports without writing any code. It's designed for both technical and non-technical users to make data-driven decisions quickly.
GRID
GRID is an AI-first platform that transforms your existing spreadsheets into powerful, interactive web applications and AI-driven tools. …
GRID is an AI-first platform that transforms your existing spreadsheets into powerful, interactive web applications and AI-driven tools. It leverages the logic and data within your Excel and Google Sheets files to build reliable calculators, dashboards, and models that can be queried using natural language, eliminating AI hallucinations.
Supaboard
Supaboard is an AI-powered business intelligence platform that connects all your data sources into a unified hub. It …
Supaboard is an AI-powered business intelligence platform that connects all your data sources into a unified hub. It transforms raw data into actionable insights and live dashboards, allowing teams to make data-backed decisions quickly without needing to write code or wrangle spreadsheets.

Viewit Ai Chatbot
An AI-powered chatbot that transforms your data into insightful visualizations and summaries through simple, natural language conversations. Upload …
An AI-powered chatbot that transforms your data into insightful visualizations and summaries through simple, natural language conversations. Upload your dataset, ask questions, and instantly receive charts, graphs, and key metrics, making data analysis accessible to everyone without needing complex software or coding skills.

DatViz AI
DatViz AI is an advanced analytics platform that uses natural language to transform complex datasets into insightful, visually …
DatViz AI is an advanced analytics platform that uses natural language to transform complex datasets into insightful, visually appealing charts and graphs. Powered by OpenAI's LLM, it simplifies data analysis, calculates key statistics, and generates visualizations like bar charts, heatmaps, and geomaps without any coding required.
ChartPixel Category
ChartPixel Tag
ChartPixel AI Tool Comparison
ChartPixel Embed Feature
Just copy the embed code below and paste this beautiful badge on your blog, article, or official app website to drive traffic directly to this tool's detail page and quickly boost your exposure and user count!

No comments yet, be the first to comment!