ExcelDashboard.ai
Visit Website
ExcelDashboard.ai Overview
ExcelDashboard.ai is a revolutionary AI-powered data report agent designed to bridge the gap between raw data and actionable insights. It empowers users to convert standard Excel or CSV files into dynamic, interactive dashboards and extensive, professional-grade reports of over 20 pages with just a single click. Trusted by over 60,000 users, this tool automates the entire data analysis and visualization process, delivering what it describes as "McKinsey-Level Insights" without requiring any programming or data science skills.
The platform's core philosophy is to simplify data exploration. Instead of manually creating charts and pivot tables, users can upload their data and let the AI automatically explore various analytical dimensions. It suggests different perspectives and angles to analyze the data, which users can then refine or customize using simple natural language commands. This interactive process makes data analysis more intuitive and accessible to a broader audience, from business analysts to marketers and students.
How to use ExcelDashboard.ai
Using ExcelDashboard.ai is a straightforward, three-step process designed for maximum efficiency:
- Upload Your Data: Begin by uploading your data file in Excel (.xlsx) or CSV format. For best results, ensure your data is clean and well-structured. This means having a single data table per sheet, clear and descriptive column headers in the first row, no blank rows or columns within the data, and using common, universal terms for field names. Avoid complex layouts like multi-section financial statements or invoices in a single sheet.
- AI-Powered Analysis & Generation: Once uploaded, the AI gets to work. It automatically analyzes your data and generates up to 10 different analytical dimensions or perspectives for you to explore. You can review these suggestions and use natural language to edit, lock in your preferred perspectives, or ask the AI to regenerate new ones. With your chosen dimension, generate the full interactive dashboard with a single click.
- Interact, Customize, and Export: The generated dashboard is fully interactive. You can ask the AI questions about the charts, and it will provide interpretations and highlight key information. Use natural language commands to generate new charts and add them to your dashboard. Finally, you can download the entire dashboard as a comprehensive, 20+ page data analysis report in an editable PPT format, allowing for further customization and presentation.
Core Features of ExcelDashboard.ai
- One-Click Dashboard Generation: Instantly converts raw data from Excel/CSV files into fully interactive dashboards.
- AI-Powered Insight Discovery: The AI automatically explores data to suggest multiple analysis dimensions and uncovers hidden patterns.
- Natural Language Interaction: Users can ask questions, refine analysis, and generate new charts using plain English commands.
- Automated Chart Interpretation: The AI explains the meaning of each chart and highlights key takeaways, saving time on manual interpretation.
- Comprehensive Report Export: Generates detailed, 20+ page reports in an editable PowerPoint (PPT) format, ready for presentation.
- Batch Analysis: Effortlessly explore diverse data dimensions to gain a holistic view of your information.
- No-Code Platform: Requires no programming or technical skills, making advanced data analysis accessible to everyone.
Use Cases for ExcelDashboard.ai
ExcelDashboard.ai is versatile and can be applied across various industries and roles:
- Business Analysts: Quickly analyze sales data, customer behavior, and operational metrics to create weekly or monthly reports.
- Marketers: Track campaign performance, analyze customer segmentation, and visualize e-commerce sales data to optimize marketing strategies.
- Financial Professionals: Convert structured financial statements into visual dashboards to analyze trends in revenue, expenses, and profitability.
- Educators and Researchers: Analyze research data, such as global education statistics, to identify trends and present findings effectively.
- Small Business Owners: Gain quick insights into their business performance without hiring a dedicated data analyst.
Advantages of ExcelDashboard.ai
The primary advantage of ExcelDashboard.ai is its combination of speed, simplicity, and power. It democratizes data analysis by eliminating technical barriers. Users can achieve in minutes what would typically take hours or days of manual work in Excel or other BI tools. The AI-driven insights provide a deeper level of analysis than standard reporting, while the natural language interface makes the platform incredibly user-friendly. The ability to export fully editable, professional-grade reports is a significant benefit for anyone needing to present their findings to stakeholders.
Pricing and Plans
ExcelDashboard.ai offers a freemium model with several tiers to suit different needs. Prices shown are for annual billing, which includes a 25% discount.
- Free Plan: $0/month. Includes 250 AI credits upon signup, 1 data file upload, and PPT export. Ideal for casual users.
- Standard Plan: $7.43/month (billed annually). Includes 600 AI credits per month, up to 30 data file uploads, PPT export, and removes the 'Made with ExcelDashboardAi' badge.
- Plus Plan: $14.25/month (billed annually). Includes 1500 AI credits per month, up to 30 data file uploads, and all features of the Standard plan.
- Pro Plan: $36.75/month (billed annually). Includes 6000 AI credits per month, up to 50 data file uploads, priority support, and all features of the Plus plan.
ExcelDashboard.ai Comments (0)
Log in to post comments
Log in nowExcelDashboard.aiWebsite Traffic Analysis
Latest Traffic
Status
Monthly Traffic Trend
Geography
Top 5 Countries/Regions
-
🇮🇳 India53.97%
-
🇨🇴 Colombia18.28%
-
🇵🇰 Pakistan12.01%
-
🇸🇦 Saudi Arabia7.91%
-
🇺🇸 United States7.83%
Popular Keywords
| Keyword | Cost Per Click |
|---|---|
|
$0.63
|
|
|
$0.00
|
|
|
$1.39
|
|
|
$0.00
|
|
|
$0.00
|
ExcelDashboard.ai Alternatives
View All
Othor AI
Othor AI is a no-code business intelligence platform that transforms your data into actionable insights in seconds. It …
Othor AI is a no-code business intelligence platform that transforms your data into actionable insights in seconds. It automatically generates narrative-driven reports, smart charts, and predictive analytics, enabling anyone in your organization to make faster, data-driven decisions without technical expertise. Connect your data sources and get instant dashboards and executive summaries.
chat2csv
chat2csv is an AI-powered data visualization tool that transforms CSV files into various charts using simple, natural language …
chat2csv is an AI-powered data visualization tool that transforms CSV files into various charts using simple, natural language commands. No coding is required. Just upload your data, chat with the AI, and instantly generate bar charts, pie charts, line graphs, and more. It's designed for quick, intuitive analysis while prioritizing user data privacy.
Tableau
Tableau is a leading AI-powered business intelligence and analytics platform that helps people see and understand data. It …
Tableau is a leading AI-powered business intelligence and analytics platform that helps people see and understand data. It enables users to create interactive dashboards, perform complex data analysis, and share insights across their organization, enhanced by AI features like Tableau Agent for accelerated decision-making.
GraphMaker
GraphMaker is an AI-powered data visualization tool that allows you to create various charts and graphs in seconds. …
GraphMaker is an AI-powered data visualization tool that allows you to create various charts and graphs in seconds. Simply upload your data from a CSV file or Google Sheets, and use natural language commands to generate insightful visualizations like bar charts, pie charts, and histograms. It's designed for speed, simplicity, and security, as it never stores your data.

Viewit Ai Chatbot
An AI-powered chatbot that transforms your data into insightful visualizations and summaries through simple, natural language conversations. Upload …
An AI-powered chatbot that transforms your data into insightful visualizations and summaries through simple, natural language conversations. Upload your dataset, ask questions, and instantly receive charts, graphs, and key metrics, making data analysis accessible to everyone without needing complex software or coding skills.
InsightJini
InsightJini is an AI-powered data analysis tool that lets you chat with your Excel and CSV files. Upload …
InsightJini is an AI-powered data analysis tool that lets you chat with your Excel and CSV files. Upload your data to instantly generate visualizations and insights without any coding. Its conversational interface, powered by ChatGPT, makes data exploration intuitive and accessible for everyone.
SheetBot
SheetBot is an AI-powered data analysis platform that enables users to analyze, visualize, and transform data without writing …
SheetBot is an AI-powered data analysis platform that enables users to analyze, visualize, and transform data without writing any code. Simply upload your dataset or connect a data source, ask questions in plain English, and receive instant insights, trends, and dynamic visualizations. Powered by advanced models like GPT-4o and Claude 3.5 Sonnet, it streamlines complex analyses, turning hours of work into minutes.

Athena
Athena is an AI-powered data analytics and business intelligence platform designed to simplify complex data. It connects to …
Athena is an AI-powered data analytics and business intelligence platform designed to simplify complex data. It connects to diverse data sources, provides advanced visualization tools, and delivers real-time, actionable insights through intuitive dashboards and automated reports, empowering businesses of all sizes to make smarter, data-driven decisions.
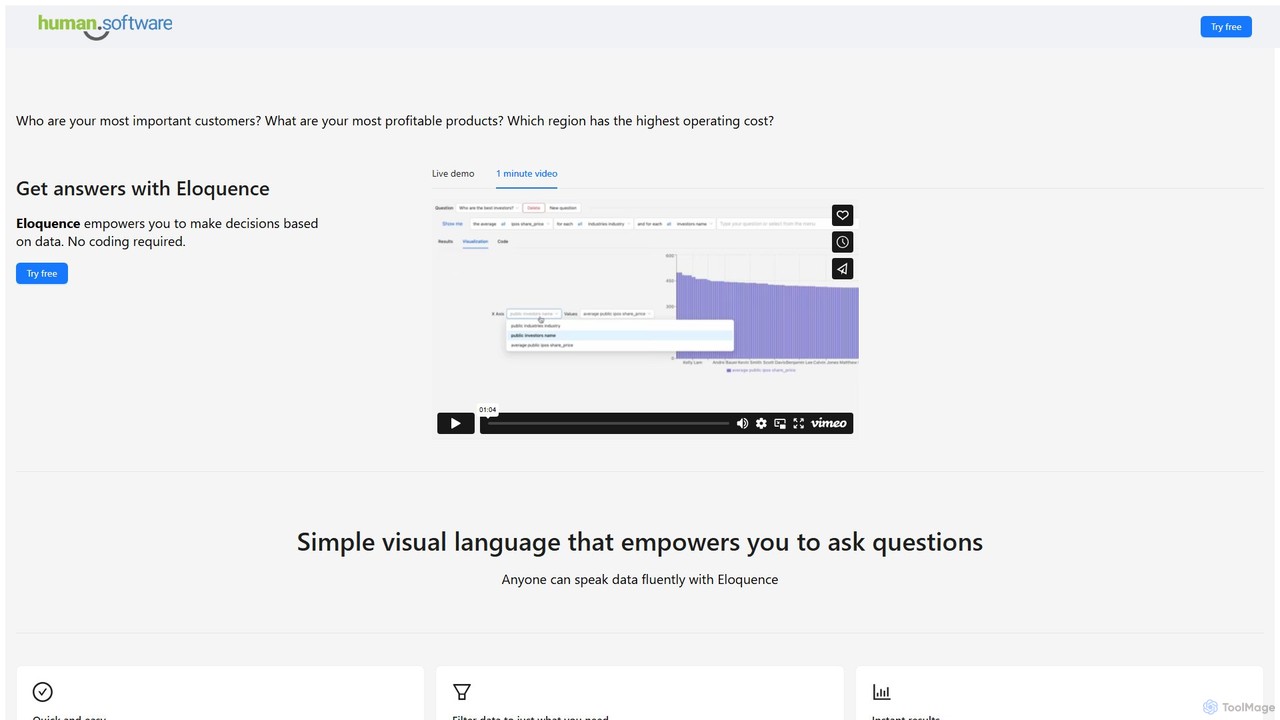
Eloquence
Eloquence is a no-code business intelligence platform that empowers anyone to query databases using structured natural language. Connect …
Eloquence is a no-code business intelligence platform that empowers anyone to query databases using structured natural language. Connect your data, ask complex questions without writing code, and get instant answers to make data-driven decisions. It prioritizes security with robust encryption and a strict no-data-saved policy.
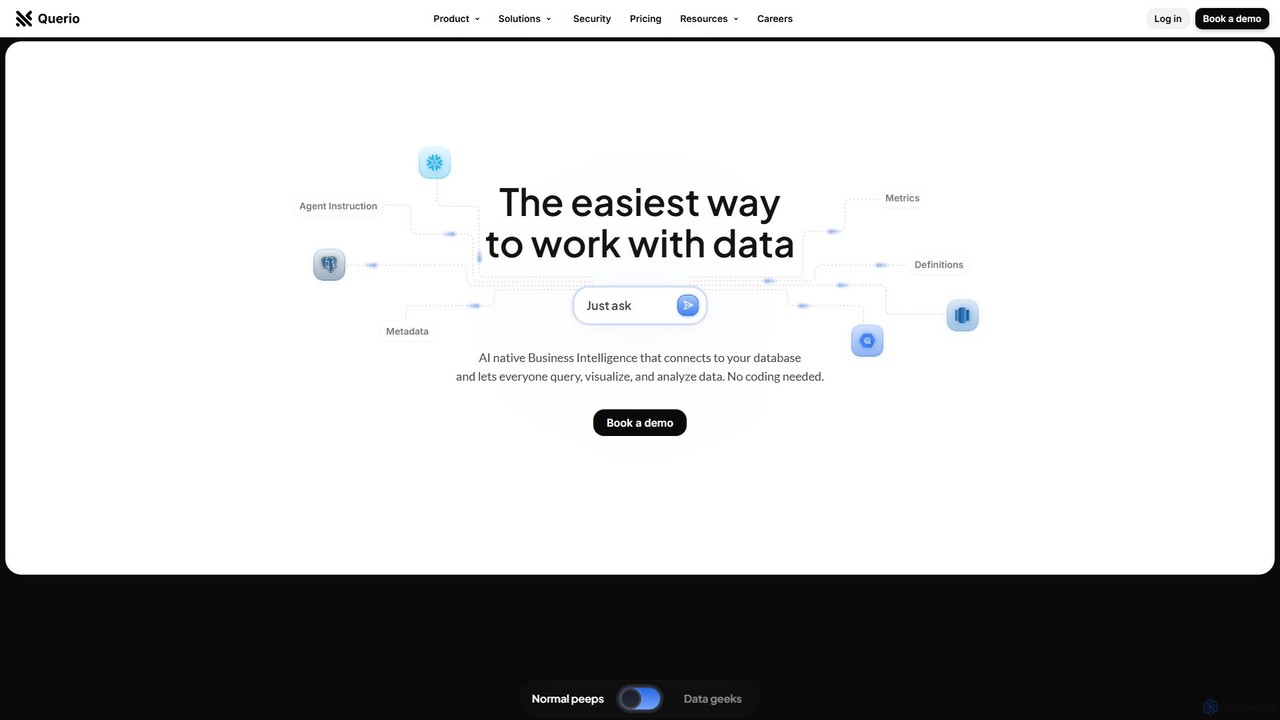
Querio
Querio is an AI-native Business Intelligence (BI) platform that allows teams to analyze their data using natural language. …
Querio is an AI-native Business Intelligence (BI) platform that allows teams to analyze their data using natural language. Connect directly to your database and ask questions to generate queries, visualizations, and reports without writing any code. It's designed for both technical and non-technical users to make data-driven decisions quickly.
ExcelDashboard.ai Category
ExcelDashboard.ai Tag
ExcelDashboard.ai AI Tool Comparison
ExcelDashboard.ai Embed Feature
Just copy the embed code below and paste this beautiful badge on your blog, article, or official app website to drive traffic directly to this tool's detail page and quickly boost your exposure and user count!

No comments yet, be the first to comment!