Tableau
Visit Website
Tableau Overview
Tableau, a Salesforce company, is a comprehensive and flexible analytics platform designed to empower individuals and organizations to make the most of their data. It provides a complete, end-to-end solution for data exploration, visualization, and sharing. At its core, Tableau is built on the belief that data analysis should be intuitive, allowing users to ask questions of their data and receive answers in a visual format. The platform has evolved to deeply integrate artificial intelligence, introducing Tableau Next and the Tableau Agent, an AI assistant that accelerates data-driven decisions by allowing users to interact with their data using natural language.
The Tableau platform is versatile, offering deployment options in the cloud (Tableau Cloud), on-premises (Tableau Server), or natively integrated with Salesforce CRM. This flexibility ensures that organizations of any size can implement a solution that fits their specific security, governance, and infrastructure needs. Tableau is designed to foster a 'Data Culture' within organizations, helping them accelerate innovation, improve operations, and better serve customers by making data accessible and actionable for everyone.
How to use Tableau
The workflow in Tableau is designed to be a seamless flow from data to insight:
- Connect to Data: Start by connecting to your data, wherever it resides. Tableau supports hundreds of data connectors, from simple spreadsheets like Excel to complex databases like SQL Server, and cloud data sources like Amazon Redshift and Google BigQuery.
- Prepare and Clean Data: Use Tableau Prep Builder to combine, shape, and clean your data. Its visual interface makes it easy to see the impact of your changes and automate data preparation flows, ensuring your analysis is based on accurate and well-structured data.
- Analyze and Explore: In Tableau Desktop or Tableau Cloud, use the drag-and-drop interface to explore data and create visualizations. Ask questions in natural language with Tableau Agent, which can suggest charts, generate insights, and help build complex calculations. There are no limits to the questions you can ask your data.
- Build and Share Dashboards: Combine multiple worksheets, visualizations, and text into a single interactive dashboard. These dashboards can be published to Tableau Server or Tableau Cloud, where they can be securely shared with colleagues, partners, or clients.
- Collaborate and Act: Users can interact with dashboards, filter data, and subscribe to updates. The collaborative features enable teams to work together, share findings, and make data-driven decisions collectively.
Core Features of Tableau
- AI-Powered Analytics (Tableau Agent): A trusted AI assistant that helps users build visualizations, ask questions in natural language, and receive automated insights, making data analysis more accessible.
- Interactive Visualizations: Create a wide range of stunning and interactive charts, graphs, and maps with a simple drag-and-drop interface.
- Comprehensive Data Connectivity: Connect to hundreds of data sources on-premises or in the cloud without needing to write code.
- Data Preparation (Tableau Prep Builder): A dedicated tool for visually combining, shaping, and cleaning data for analysis.
- Secure Collaboration and Sharing: Share visualizations and dashboards securely through Tableau Server (on-premises) or Tableau Cloud (fully-hosted).
- Robust Governance and Data Management: Maintain data quality, security, and compliance with centralized data source management, user permissions, and data certification.
- Embedded Analytics: APIs and developer tools to embed interactive analytics directly into your business applications, products, and web portals.
- Strong Community and Learning Resources: Access to a global community of over a million members, free training videos, eLearning paths, and extensive documentation.
Use Cases for Tableau
Tableau is used across various roles and industries to drive value from data:
- For Analysts: To perform deep data exploration, create ad-hoc reports, and build powerful dashboards that track key performance indicators.
- For Data and IT Leaders: To deliver a governed, scalable, and secure self-service analytics environment that empowers business users while maintaining control over data assets.
- For Business Leaders: To gain high-level, real-time insights into business performance, identify trends, and make strategic decisions with confidence.
- For Developers: To build custom data applications and embed rich, interactive analytics into their own products to enhance user value.
- Industry-Specific Solutions: Companies like JLR use it for business value realization, Keybank for employee empowerment, and Box for fighting cyber threats.
Advantages of Tableau
Tableau stands out for its user-centric design and powerful capabilities:
- Intuitive and Easy to Use: Its 'flow of analysis' philosophy minimizes the learning curve and allows users to focus on questions, not software.
- Powerful and Fast: Capable of handling massive datasets and performing complex calculations quickly, providing rapid insights.
- Flexible and Scalable: Deploys anywhere—on-premises, public cloud, or with Tableau's fully-hosted cloud solution.
- AI-Driven: Integrates AI to augment human intelligence, making sophisticated analysis accessible to a broader audience.
- Vibrant Community: Unmatched community support for learning, problem-solving, and inspiration.
Pricing and Plans
Tableau offers a 'freemium' model. It provides a comprehensive free trial that includes Tableau Desktop, Prep Builder, and Tableau Cloud. There are also free one-year licenses available for students and teachers. For commercial use, Tableau is a paid product with pricing typically structured around user roles:
- Creator: For users who discover insights and create data sources and dashboards.
- Explorer: For users who explore governed data and create their own dashboards from existing data sources.
- Viewer: For users who view and interact with published dashboards.
Pricing varies based on the deployment model (Tableau Cloud or Tableau Server). For detailed and customized pricing, it is recommended to contact the Tableau sales team directly through their website.
Tableau Comments (0)
Log in to post comments
Log in nowTableauWebsite Traffic Analysis
Latest Traffic
Status
Monthly Traffic Trend
Geography
Top 5 Countries/Regions
-
🇺🇸 United States57.82%
-
🇯🇵 Japan20.32%
-
🇮🇳 India9.96%
-
🇬🇧 United Kingdom7.74%
-
🇦🇺 Australia4.16%
Traffic source
| Source Type | Percentage |
|---|---|
|
Direct Access
|
82.51% |
|
Referral
|
14.21% |
|
Email
|
3.28% |
Popular Keywords
| Keyword | Cost Per Click |
|---|---|
|
$1.54
|
|
|
$2.36
|
|
|
$2.44
|
|
|
$2.40
|
|
|
$0.00
|
Tableau Alternatives
View All
Othor AI
Othor AI is a no-code business intelligence platform that transforms your data into actionable insights in seconds. It …
Othor AI is a no-code business intelligence platform that transforms your data into actionable insights in seconds. It automatically generates narrative-driven reports, smart charts, and predictive analytics, enabling anyone in your organization to make faster, data-driven decisions without technical expertise. Connect your data sources and get instant dashboards and executive summaries.
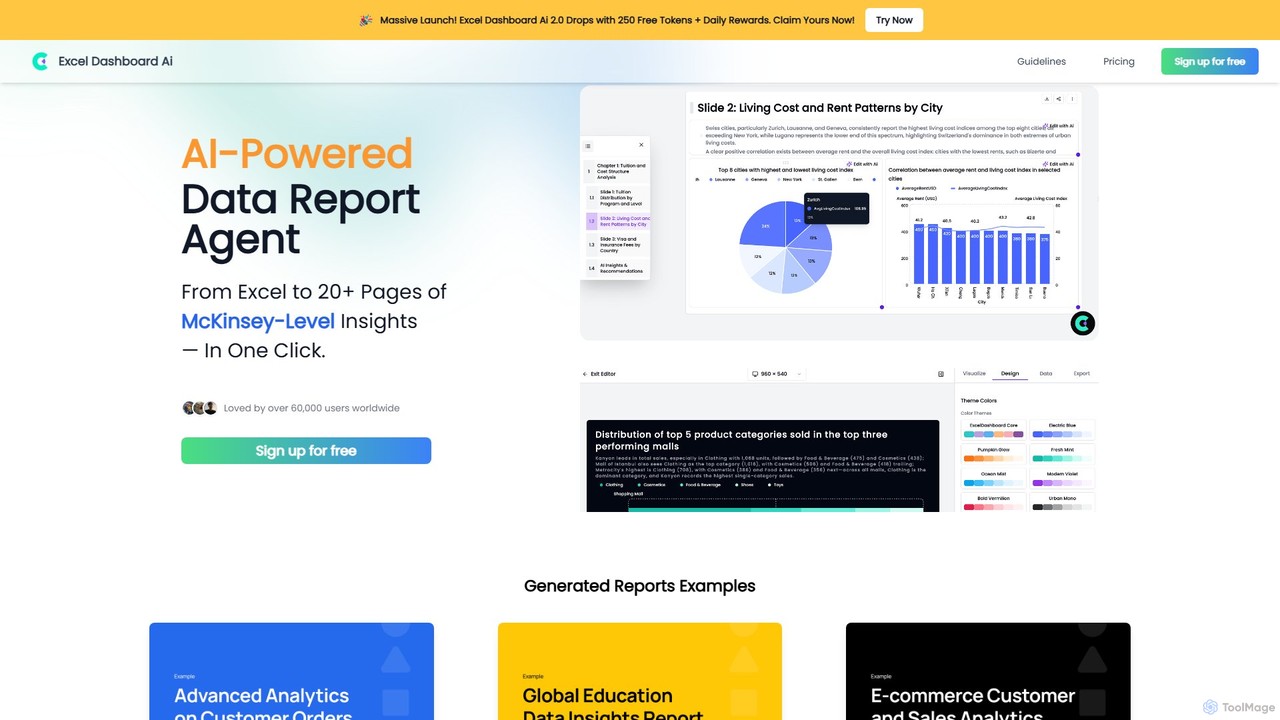
ExcelDashboard.ai
ExcelDashboard.ai is an AI-powered data analysis tool that instantly transforms raw Excel or CSV files into interactive dashboards …
ExcelDashboard.ai is an AI-powered data analysis tool that instantly transforms raw Excel or CSV files into interactive dashboards and comprehensive, multi-page reports. With a single click, it generates deep, McKinsey-level insights, visualizes data, and allows users to explore information using natural language commands. It's designed for users of all skill levels to make data-driven decisions without needing programming expertise.
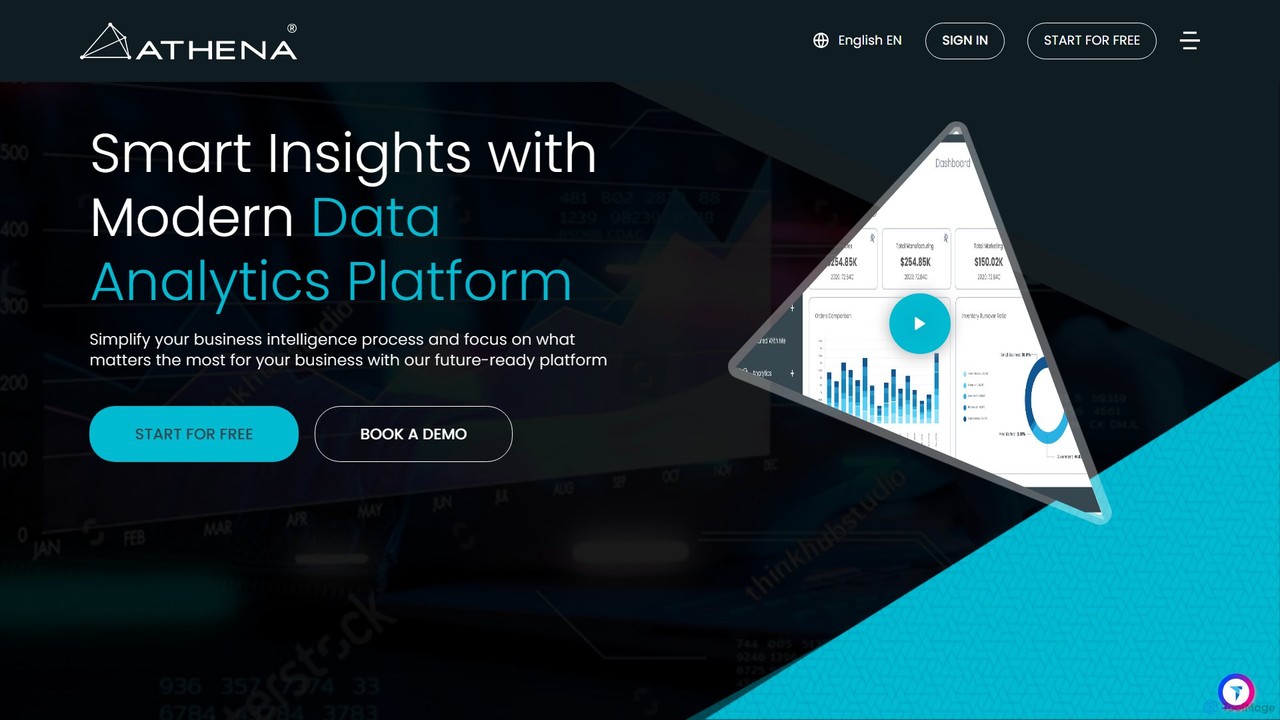
Athena
Athena is an AI-powered data analytics and business intelligence platform designed to simplify complex data. It connects to …
Athena is an AI-powered data analytics and business intelligence platform designed to simplify complex data. It connects to diverse data sources, provides advanced visualization tools, and delivers real-time, actionable insights through intuitive dashboards and automated reports, empowering businesses of all sizes to make smarter, data-driven decisions.

EzInsights
EzInsights is an AI-powered business intelligence platform that enables users to interact with their data using natural language. …
EzInsights is an AI-powered business intelligence platform that enables users to interact with their data using natural language. It combines generative AI with advanced analytics and visualization tools to provide instant, data-driven insights, automated reports, and predictive analytics, empowering teams to make smarter decisions without technical expertise.
alltum.io
alltum.io is an AI-powered business intelligence platform that unifies data from various sources, providing actionable insights through interactive …
alltum.io is an AI-powered business intelligence platform that unifies data from various sources, providing actionable insights through interactive dashboards, predictive analytics, and automated reporting. It empowers businesses of all sizes to make smarter, data-driven decisions effortlessly.
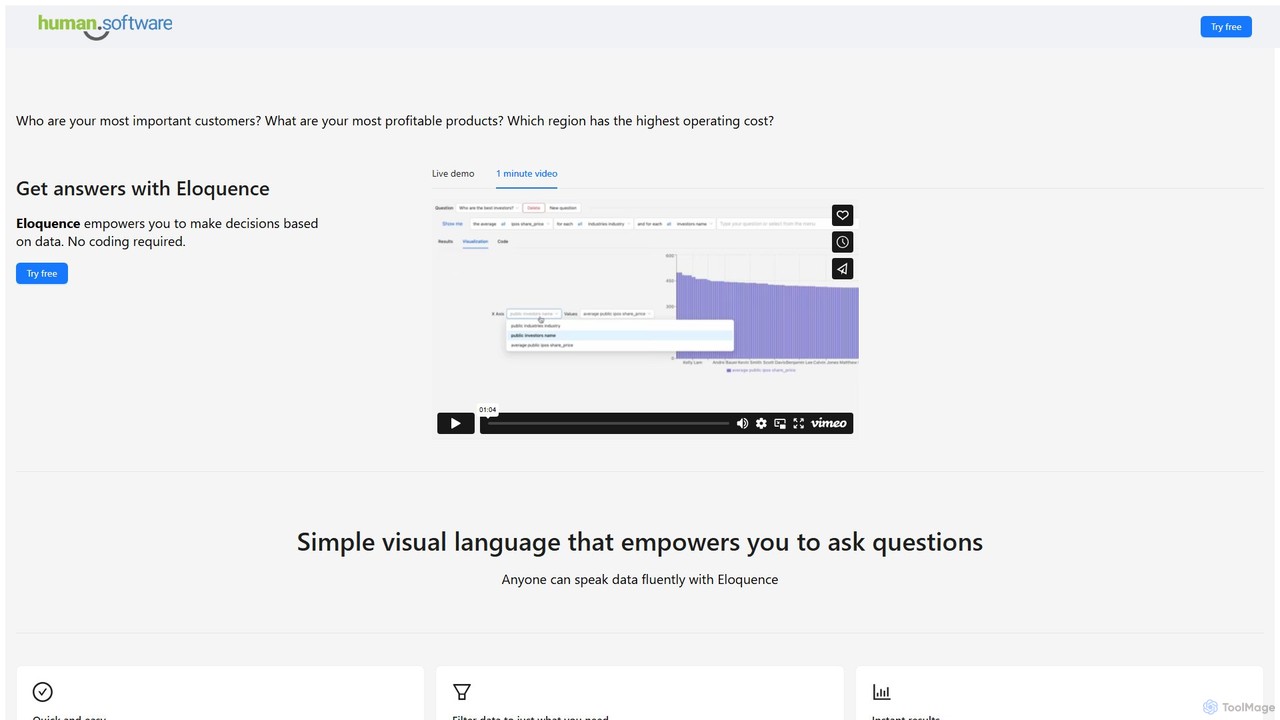
Eloquence
Eloquence is a no-code business intelligence platform that empowers anyone to query databases using structured natural language. Connect …
Eloquence is a no-code business intelligence platform that empowers anyone to query databases using structured natural language. Connect your data, ask complex questions without writing code, and get instant answers to make data-driven decisions. It prioritizes security with robust encryption and a strict no-data-saved policy.
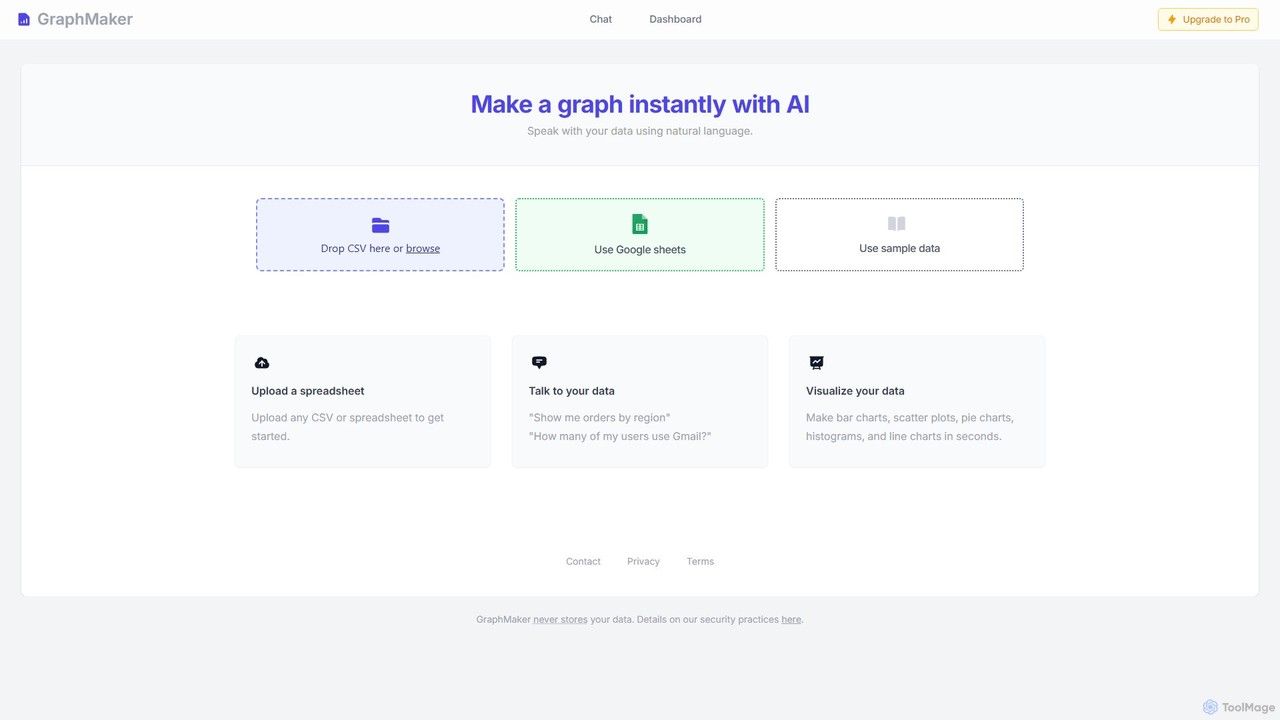
GraphMaker
GraphMaker is an AI-powered data visualization tool that allows you to create various charts and graphs in seconds. …
GraphMaker is an AI-powered data visualization tool that allows you to create various charts and graphs in seconds. Simply upload your data from a CSV file or Google Sheets, and use natural language commands to generate insightful visualizations like bar charts, pie charts, and histograms. It's designed for speed, simplicity, and security, as it never stores your data.

Viewit Ai Chatbot
An AI-powered chatbot that transforms your data into insightful visualizations and summaries through simple, natural language conversations. Upload …
An AI-powered chatbot that transforms your data into insightful visualizations and summaries through simple, natural language conversations. Upload your dataset, ask questions, and instantly receive charts, graphs, and key metrics, making data analysis accessible to everyone without needing complex software or coding skills.
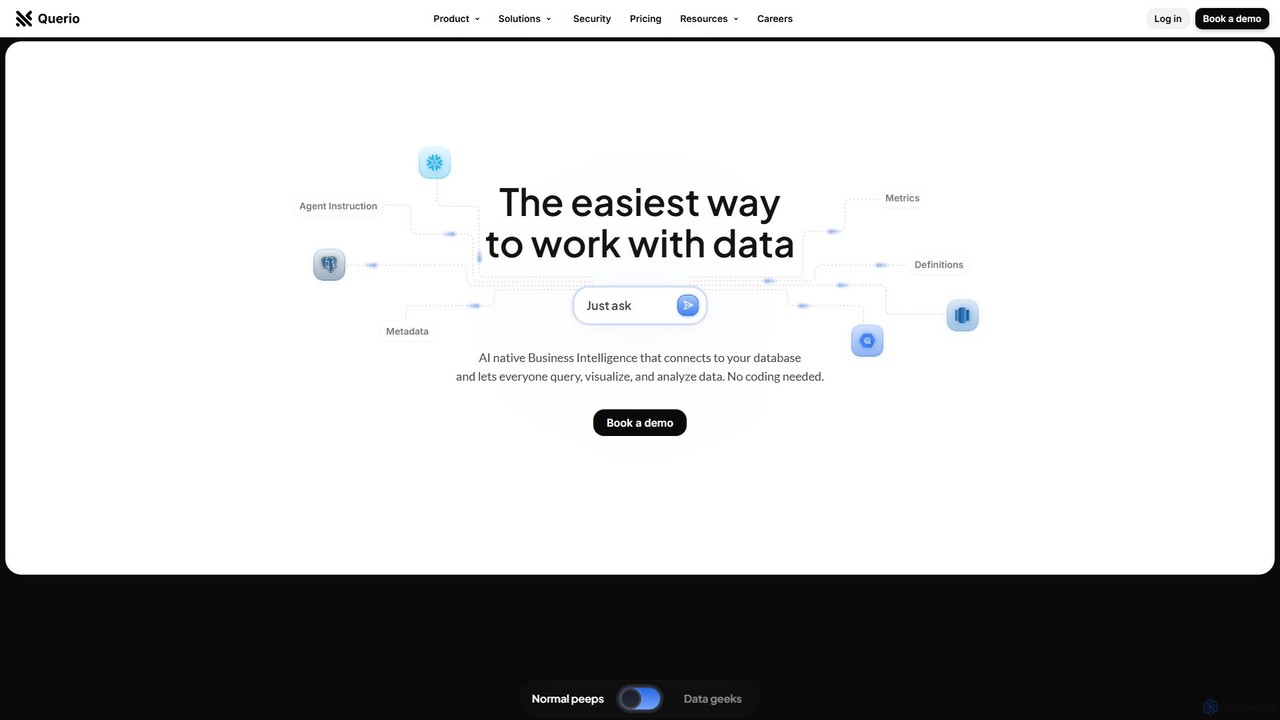
Querio
Querio is an AI-native Business Intelligence (BI) platform that allows teams to analyze their data using natural language. …
Querio is an AI-native Business Intelligence (BI) platform that allows teams to analyze their data using natural language. Connect directly to your database and ask questions to generate queries, visualizations, and reports without writing any code. It's designed for both technical and non-technical users to make data-driven decisions quickly.
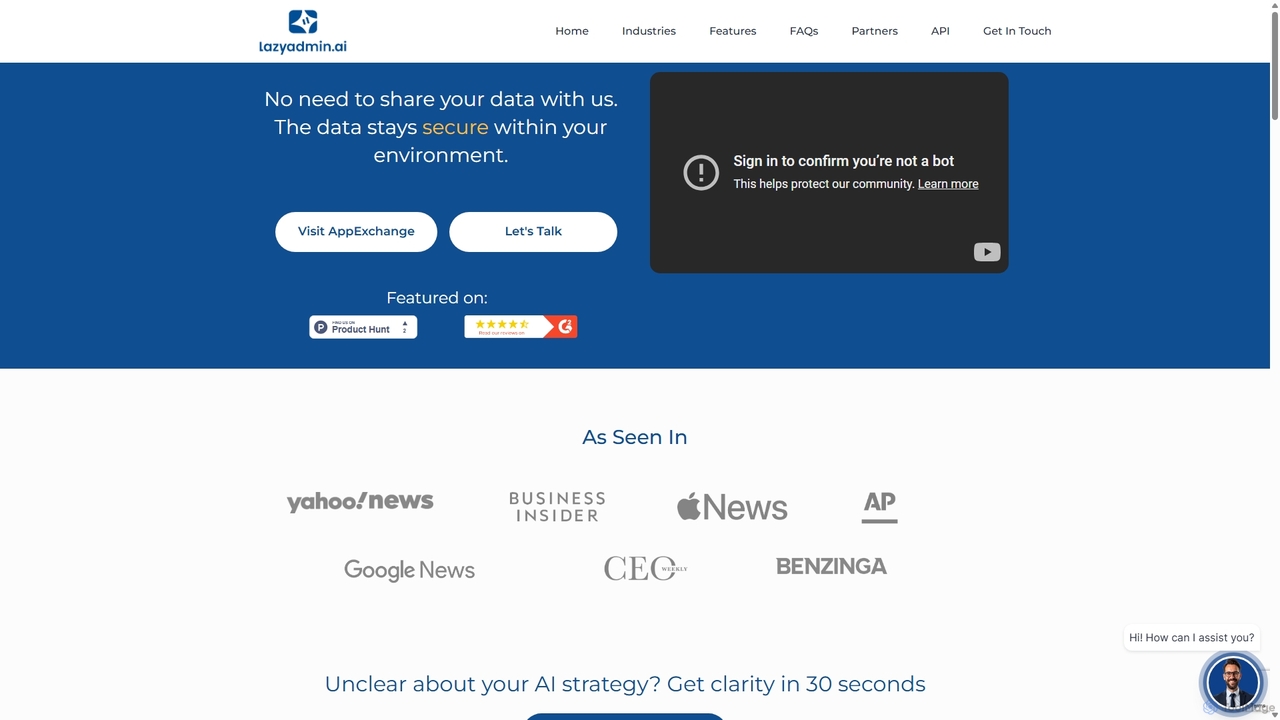
Lazy Admin
Lazy Admin is an AI-powered data analysis and reporting solution designed primarily for Salesforce. It enables users to …
Lazy Admin is an AI-powered data analysis and reporting solution designed primarily for Salesforce. It enables users to query data, generate charts, and create dashboards using natural language. The tool emphasizes security by keeping all data within your environment and can be personalized to understand your specific business terminology, making data insights accessible to everyone on your team.
Tableau Category
Tableau Tag
Tableau AI Tool Comparison
Tableau Embed Feature
Just copy the embed code below and paste this beautiful badge on your blog, article, or official app website to drive traffic directly to this tool's detail page and quickly boost your exposure and user count!

No comments yet, be the first to comment!