EzInsights
Visit Website
EzInsights Overview
EzInsights is a comprehensive, end-to-end platform designed to bridge the gap between business and technology. It empowers organizations to leverage their data through smart, search-driven analytics. By integrating powerful Generative AI capabilities, EzInsights allows users of all skill levels to interact with complex datasets using simple, natural language queries. The platform's vision is to democratize data access in a safe, governed, and collaborative environment, enabling businesses to derive high-quality value from their use cases in days, not months.
The platform is built to transform raw data, from both structured and unstructured sources, into actionable insights. It caters to various business functions, including sales, marketing, customer service, and operations, by providing tailored analytical tools and instant answers to critical business questions. With a focus on security and enterprise-readiness, EzInsights ensures that data exploration is both powerful and compliant.
How to use EzInsights
Using EzInsights is an intuitive process designed for both technical and non-technical users. The typical workflow is as follows:
- Connect Data Sources: Begin by securely connecting your data from various on-premise or cloud sources. The platform supports a mix of structured and unstructured data.
- Ask Questions in Natural Language: Interact with your data by simply asking questions in plain English, just as you would ask a colleague. For example, "What were our top-selling products last quarter?" or "Show me the customer satisfaction trend over the past year."
- Generate Dashboards and Reports: Use the Text-to-SQL feature to instantly generate interactive dashboards from your queries. For more customized reports, utilize the intuitive drag-and-drop report builder.
- Leverage AI Data Bots: Deploy specialized Data Bots for specific business Q&A, providing instant and accurate answers to frequently asked questions within your teams.
- Explore and Analyze: Dive deeper into the data with advanced visualization charts, statistical analysis tools, and exploratory data analysis features to uncover hidden patterns, trends, and anomalies.
- Collaborate and Share: Share your findings, dashboards, and reports with team members to foster a data-driven culture and collaborative decision-making.
Core Features of EzInsights
- Generative AI for Data Interaction: Ask questions in natural language to get instant insights, eliminating the need for complex SQL queries or technical skills.
- Text-to-SQL Dashboard Generation: Automatically create rich, interactive dashboards from simple text-based queries.
- Advanced RAG Technology: Utilizes multiple Retrieval-Augmented Generation models (Contextual, Elastic Search, GraphRAG) for more accurate and context-aware answers.
- Data Bots and Virtual Agents: Customizable AI agents that provide automated answers and perform analytical tasks for specific business functions.
- Comprehensive Visualization Tools: Includes dashboards, cards, ad hoc and advanced charts, and exploratory data analysis features to visualize trends and patterns.
- Drag-and-Drop Report Builder: Effortlessly create custom, professional-looking reports without any coding.
- Data Narratives: Automatically transforms complex data insights into clear, easy-to-understand stories and summaries.
- Enterprise-Grade STARGATE Platform: The underlying architecture is Scalable, Transparent, Accurate, RAG-driven, Guardrailed, Auditable, Token Friendly, and features full Eval & Traceability.
- Persona-Driven Analysis: Delivers tailored insights based on user roles (e.g., sales, marketing, IT), enhancing relevance and accuracy.
Use Cases for EzInsights
EzInsights is versatile and can be applied across various departments:
- Sales Teams: Analyze sales performance, track KPIs, identify top-performing regions or products, and forecast future sales trends.
- Marketing Departments: Measure campaign ROI, analyze customer behavior, segment audiences, and gain insights into market trends.
- Customer Service: Quickly access customer history, analyze support ticket trends, and identify common issues to improve customer satisfaction.
- Operations and Support: Monitor operational efficiency, detect anomalies in processes, and optimize resource allocation for better performance.
- Executive Leadership: Gain a high-level overview of business health through consolidated dashboards and receive instant answers to strategic questions.
Advantages of EzInsights
EzInsights offers a significant competitive edge by:
- Democratizing Data: Makes data analytics accessible to everyone in the organization, regardless of their technical background.
- Accelerating Decision-Making: Provides instant insights, reducing the time from data to decision from months to days.
- Unifying Business and IT: Creates a single, collaborative platform where business users can get answers and IT can ensure governance and security.
- Enhancing Productivity: Automates reporting and data analysis tasks, freeing up teams to focus on strategic initiatives.
- Providing Trust and Transparency: Built with guardrails, auditability, and traceability to ensure reliable and high-quality outputs.
Pricing and Plans
EzInsights offers enterprise-focused solutions with pricing tailored to the specific needs of each organization. As there are no standard plans listed on the website, interested parties are encouraged to contact the EzInsights sales team directly to request a demo and receive a custom quote based on their use case, data volume, and user requirements.
EzInsights Comments (0)
Log in to post comments
Log in nowEzInsights Alternatives
View All
alltum.io
alltum.io is an AI-powered business intelligence platform that unifies data from various sources, providing actionable insights through interactive …
alltum.io is an AI-powered business intelligence platform that unifies data from various sources, providing actionable insights through interactive dashboards, predictive analytics, and automated reporting. It empowers businesses of all sizes to make smarter, data-driven decisions effortlessly.
Othor AI
Othor AI is a no-code business intelligence platform that transforms your data into actionable insights in seconds. It …
Othor AI is a no-code business intelligence platform that transforms your data into actionable insights in seconds. It automatically generates narrative-driven reports, smart charts, and predictive analytics, enabling anyone in your organization to make faster, data-driven decisions without technical expertise. Connect your data sources and get instant dashboards and executive summaries.
Athena
Athena is an AI-powered data analytics and business intelligence platform designed to simplify complex data. It connects to …
Athena is an AI-powered data analytics and business intelligence platform designed to simplify complex data. It connects to diverse data sources, provides advanced visualization tools, and delivers real-time, actionable insights through intuitive dashboards and automated reports, empowering businesses of all sizes to make smarter, data-driven decisions.
Tableau
Tableau is a leading AI-powered business intelligence and analytics platform that helps people see and understand data. It …
Tableau is a leading AI-powered business intelligence and analytics platform that helps people see and understand data. It enables users to create interactive dashboards, perform complex data analysis, and share insights across their organization, enhanced by AI features like Tableau Agent for accelerated decision-making.
Veezoo
Veezoo is an AI-powered, agentic analytics platform that enables users to get trusted insights from their data by …
Veezoo is an AI-powered, agentic analytics platform that enables users to get trusted insights from their data by asking questions in natural language. It combines a ChatGPT-like interface with a robust semantic layer (Knowledge Graph) to ensure data governance, accuracy, and consistency, democratizing data analytics for everyone in an organization.
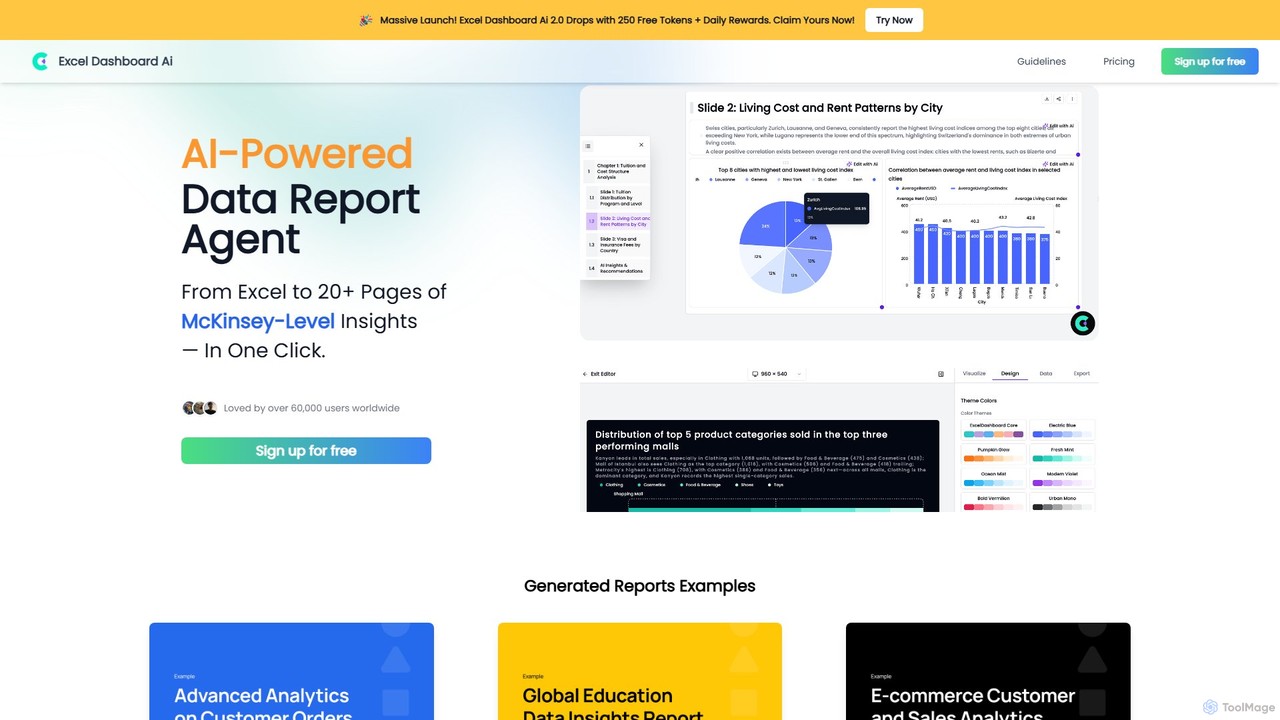
ExcelDashboard.ai
ExcelDashboard.ai is an AI-powered data analysis tool that instantly transforms raw Excel or CSV files into interactive dashboards …
ExcelDashboard.ai is an AI-powered data analysis tool that instantly transforms raw Excel or CSV files into interactive dashboards and comprehensive, multi-page reports. With a single click, it generates deep, McKinsey-level insights, visualizes data, and allows users to explore information using natural language commands. It's designed for users of all skill levels to make data-driven decisions without needing programming expertise.
Eloquence
Eloquence is a no-code business intelligence platform that empowers anyone to query databases using structured natural language. Connect …
Eloquence is a no-code business intelligence platform that empowers anyone to query databases using structured natural language. Connect your data, ask complex questions without writing code, and get instant answers to make data-driven decisions. It prioritizes security with robust encryption and a strict no-data-saved policy.
prisms.ai
Prisms.ai is an AI-powered data analytics and visualization platform that transforms complex data into clear, interactive dashboards. It …
Prisms.ai is an AI-powered data analytics and visualization platform that transforms complex data into clear, interactive dashboards. It allows users to ask questions in natural language and receive instant, AI-generated insights, charts, and reports, making data-driven decision-making accessible to everyone in an organization.
insyte
insyte is an AI-powered business intelligence platform that transforms complex data into clear, actionable insights. Ask questions in …
insyte is an AI-powered business intelligence platform that transforms complex data into clear, actionable insights. Ask questions in natural language, create interactive dashboards, and uncover hidden trends to drive business growth without needing a data scientist.
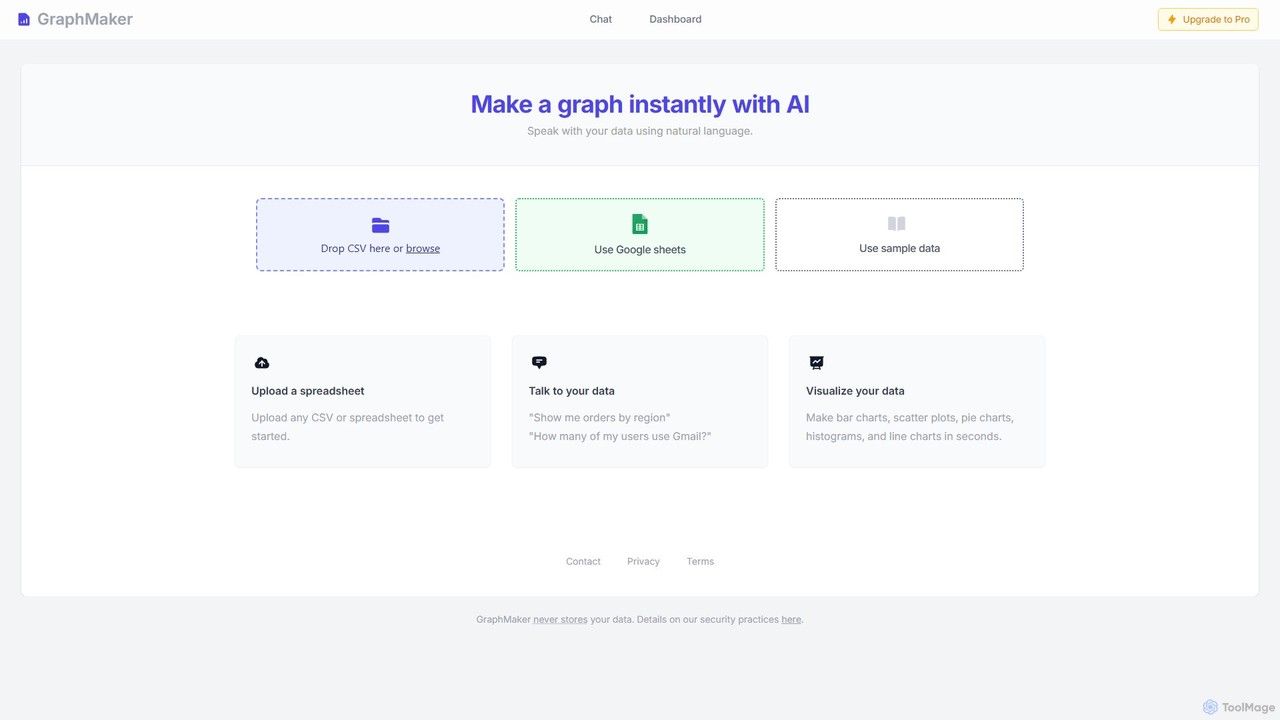
GraphMaker
GraphMaker is an AI-powered data visualization tool that allows you to create various charts and graphs in seconds. …
GraphMaker is an AI-powered data visualization tool that allows you to create various charts and graphs in seconds. Simply upload your data from a CSV file or Google Sheets, and use natural language commands to generate insightful visualizations like bar charts, pie charts, and histograms. It's designed for speed, simplicity, and security, as it never stores your data.
EzInsights Category
EzInsights Tag
EzInsights AI Tool Comparison
EzInsights Embed Feature
Just copy the embed code below and paste this beautiful badge on your blog, article, or official app website to drive traffic directly to this tool's detail page and quickly boost your exposure and user count!

No comments yet, be the first to comment!