Microsoft Power BI
Visit Website
Microsoft Power BI Overview
Microsoft Power BI is a unified, scalable platform for self-service and enterprise business intelligence (BI). As a core part of the Microsoft Power Platform (and now Microsoft Fabric), it enables users to connect to and visualize any data, creating a single source of truth for their organization. Power BI stands out by integrating powerful AI capabilities, making advanced analytics accessible to everyone, from business analysts to C-level executives. It transforms raw data from hundreds of sources into beautiful, interactive, and easy-to-understand dashboards and reports, fostering a data-driven culture.
How to use Microsoft Power BI
The workflow in Power BI is designed to be intuitive, following a logical progression from data to insights:
- Connect to Data: Start with Power BI Desktop (a free authoring tool). Connect to a vast array of data sources, including Excel files, SQL databases, Azure services, Salesforce, Google Analytics, and many more.
- Transform and Model Data: Use the integrated Power Query Editor to clean, shape, and transform your raw data. You can merge tables, change data types, and pivot columns. Then, build a data model by creating relationships between tables, which is crucial for accurate analysis.
- Create Visualizations and Reports: In the report view, drag and drop fields onto the canvas to create stunning visualizations. Choose from a wide range of charts, graphs, maps, and tables. Arrange these visuals across multiple pages to build a comprehensive report.
- Leverage AI Features: Enhance your analysis with AI. Use the Q&A visual to ask questions in natural language (e.g., "show top 10 products by sales last year"). Employ AI visuals like 'Key Influencers' to understand what drives your metrics or 'Anomaly Detection' to automatically find outliers in time-series data.
- Publish and Share: Once your report is ready, publish it to the Power BI Service (the cloud-based component). From there, you can assemble dashboards, share them with colleagues, set up automated data refreshes, and collaborate in workspaces.
- Access Insights Anywhere: View and interact with your reports and dashboards on the web or through the Power BI mobile app for iOS and Android.
Core Features of Microsoft Power BI
- AI-Powered Insights: Includes features like Natural Language Q&A, Quick Insights which automatically surfaces patterns, and AI visuals like Key Influencers and Decomposition Tree for deep-dive analysis.
- Comprehensive Data Connectivity: Natively connects to hundreds of on-premises and cloud-based data sources.
- Power Query Editor: A powerful and intuitive tool for data ingestion, transformation, and preparation (ETL).
- DAX (Data Analysis Expressions): A formula language used to create custom calculations and measures, enabling sophisticated data modeling.
- Interactive and Customizable Visualizations: A rich library of built-in visuals, with access to a marketplace (AppSource) for hundreds more custom visuals.
- Real-time Dashboards: Ability to display and update data in real-time from streaming sources.
- Seamless Microsoft Integration: Deeply integrated with Excel, Teams, SharePoint, Azure Synapse Analytics, and the entire Microsoft Fabric ecosystem.
- Enterprise-Grade Security and Governance: Features like row-level security (RLS), data sensitivity labels, and centralized management ensure data is secure and governed.
Use Cases for Microsoft Power BI
Power BI is versatile and can be applied across all departments:
- Sales and Marketing: Analyzing sales funnels, tracking campaign ROI, monitoring social media sentiment, and segmenting customers.
- Finance: Creating financial statements, performing budget vs. actual analysis, forecasting revenue, and monitoring key financial KPIs.
- Operations: Optimizing supply chains, monitoring manufacturing floor performance, managing inventory levels, and tracking quality control metrics.
- Human Resources: Analyzing employee turnover rates, tracking recruitment pipelines, visualizing workforce demographics, and managing compensation data.
- IT: Monitoring system uptime and performance, analyzing helpdesk ticket trends, and managing IT project budgets.
Advantages of Microsoft Power BI
Power BI offers a compelling value proposition through its unique strengths:
- Accessibility: Its user-friendly interface empowers business users to perform complex analyses without needing to be data scientists.
- Cost-Effective: The 'freemium' model, with a free Desktop version and an affordable Pro license, makes it accessible to individuals and small businesses, while the Premium tier scales for enterprise needs.
- Powerful Ecosystem: Unmatched integration with the Microsoft stack (Office 365, Azure, Dynamics 365) creates a seamless workflow for many organizations.
- Continuous Innovation: Microsoft consistently invests in Power BI, regularly releasing updates with new features, particularly in the AI and machine learning space.
- Strong Community: A large and active global community provides extensive support, tutorials, and custom solutions.
Pricing and Plans
Power BI offers a flexible pricing structure to suit different needs:
- Power BI Desktop: Free. For individual users to create reports and perform data analysis on their local machine.
- Power BI Pro: A per-user monthly subscription (typically around $10/user/month). It is required for sharing reports, collaborating with other users, and publishing content to workspaces.
- Power BI Premium: Offered on a per-user or per-capacity basis. The per-user plan (around $20/user/month) includes Pro features plus larger model sizes and advanced AI. The per-capacity plan is for large enterprises, providing dedicated resources for better performance, larger datasets, and distribution of content to free users.
- Microsoft Fabric: Power BI is now integrated into Microsoft Fabric, an all-in-one analytics solution. Pricing can also be based on Fabric capacity, which includes Power BI Premium capabilities.
Microsoft Power BI Comments (0)
Log in to post comments
Log in nowMicrosoft Power BIWebsite Traffic Analysis
Latest Traffic
Status
Monthly Traffic Trend
Geography
Top 5 Countries/Regions
-
🇺🇸 United States46.55%
-
🇧🇷 Brazil27.05%
-
🇮🇳 India11.14%
-
🇬🇧 United Kingdom8.79%
-
🇯🇵 Japan6.47%
Traffic source
| Source Type | Percentage |
|---|---|
|
Direct Access
|
56.06% |
|
Referral
|
40.15% |
|
Email
|
3.79% |
Popular Keywords
| Keyword | Cost Per Click |
|---|---|
|
$0.97
|
|
|
$2.23
|
|
|
$2.79
|
|
|
$1.03
|
|
|
$2.44
|
Microsoft Power BI Alternatives
View All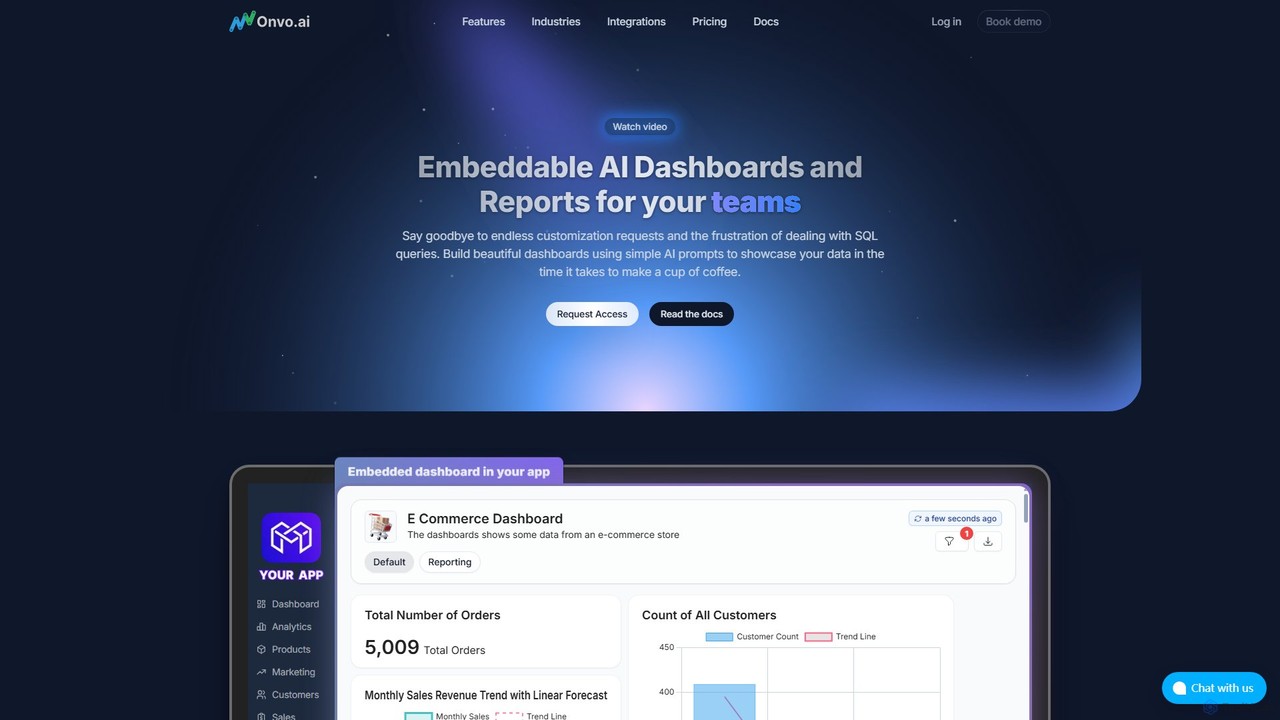
Onvo AI
Onvo AI is a powerful platform for building and embedding AI-driven dashboards and reports directly into your applications. …
Onvo AI is a powerful platform for building and embedding AI-driven dashboards and reports directly into your applications. It replaces complex SQL queries with simple natural language prompts, allowing both technical and non-technical users to create stunning data visualizations effortlessly. This solution saves significant engineering resources and empowers your teams and customers with secure, self-service analytics.
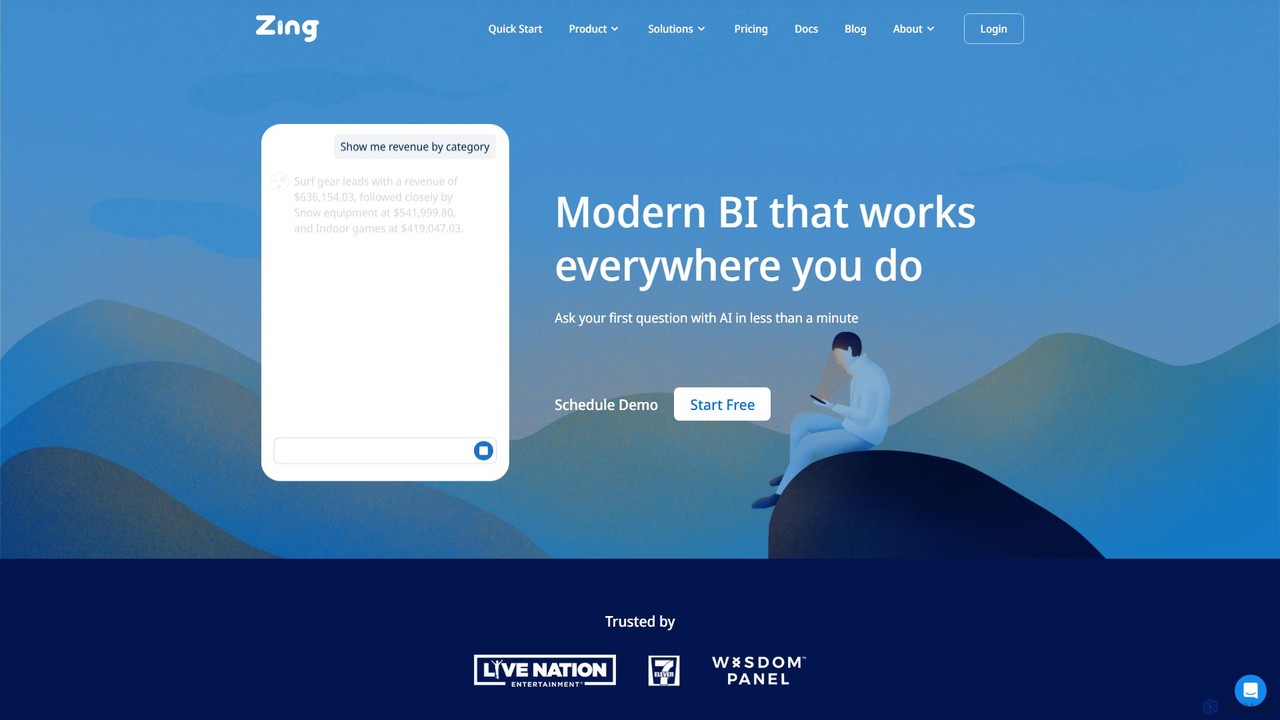
Zing Data
Zing Data is a GenAI-powered business intelligence (BI) platform that enables users to query data using natural language. …
Zing Data is a GenAI-powered business intelligence (BI) platform that enables users to query data using natural language. It works across web and mobile, connecting to various data sources to create interactive visualizations and real-time alerts without complex data modeling, making data analysis accessible to everyone.
prisms.ai
Prisms.ai is an AI-powered data analytics and visualization platform that transforms complex data into clear, interactive dashboards. It …
Prisms.ai is an AI-powered data analytics and visualization platform that transforms complex data into clear, interactive dashboards. It allows users to ask questions in natural language and receive instant, AI-generated insights, charts, and reports, making data-driven decision-making accessible to everyone in an organization.

Sisense
Sisense is an AI-powered embedded analytics platform that enables businesses to infuse analytics into their products, applications, and …
Sisense is an AI-powered embedded analytics platform that enables businesses to infuse analytics into their products, applications, and workflows. It provides a comprehensive suite of tools for data integration, visualization, and delivering actionable insights to both internal users and customers.
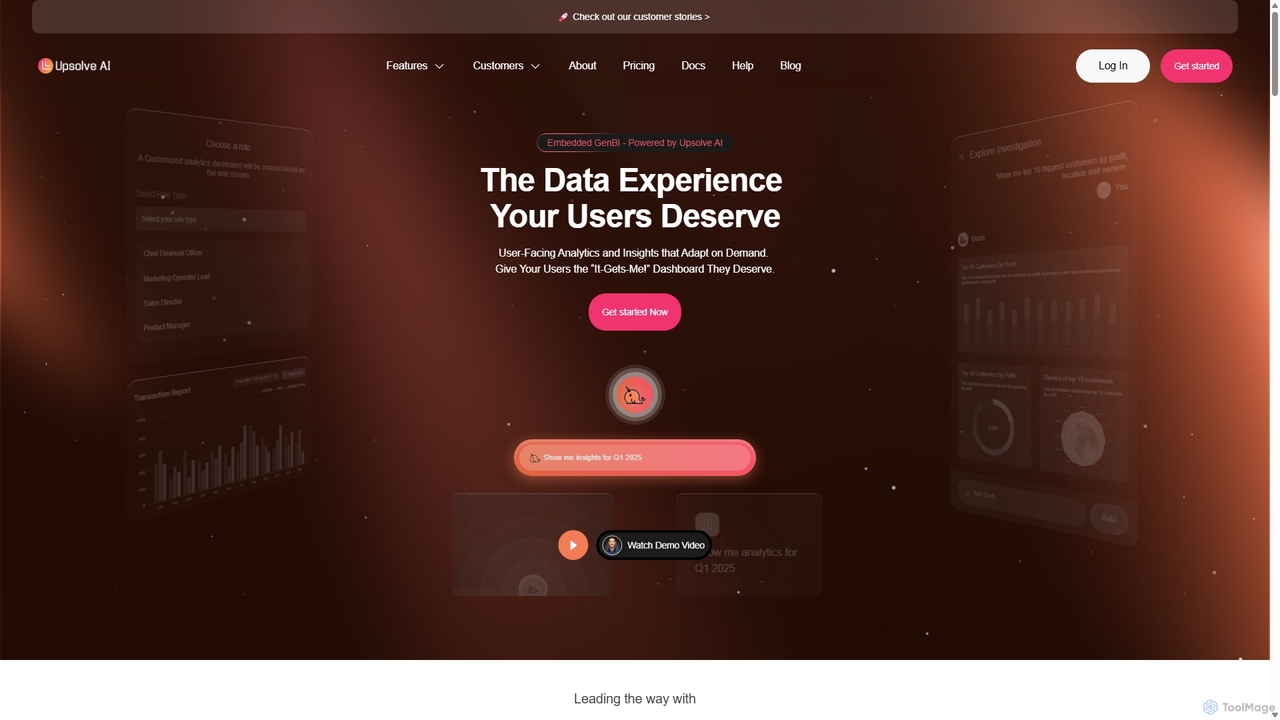
Upsolve AI
Upsolve AI is an embedded Generative Business Intelligence (GenBI) platform that enables SaaS companies to integrate AI-powered, hyper-personalized …
Upsolve AI is an embedded Generative Business Intelligence (GenBI) platform that enables SaaS companies to integrate AI-powered, hyper-personalized analytics dashboards directly into their products. It allows end-users to interact with data using natural language, providing actionable insights and a seamless, self-service data experience without requiring extensive development resources.
GenRPT
GenRPT is an AI-powered platform that transforms data from SQL, PDF, and Excel into actionable insights and reports. …
GenRPT is an AI-powered platform that transforms data from SQL, PDF, and Excel into actionable insights and reports. Connect your data sources, ask questions in natural language, and receive instant analysis, summaries, and visualizations to accelerate data-driven decision-making.

Analytics Model
Analytics Model is a GenAI-powered conversational analytics platform that transforms your business data into expert insights instantly. Connect …
Analytics Model is a GenAI-powered conversational analytics platform that transforms your business data into expert insights instantly. Connect to over 500 data sources, ask questions in natural language, and create powerful, customizable visualizations to empower strategic decision-making and streamline your data processes.
BoostKPI
BoostKPI is a privacy-first AI data analyst platform, powered by its AI assistant, ADA. It automates anomaly detection, …
BoostKPI is a privacy-first AI data analyst platform, powered by its AI assistant, ADA. It automates anomaly detection, root cause analysis, and data visualization, enabling businesses to quickly uncover actionable insights from their data. By connecting to various data warehouses or accepting file uploads, BoostKPI transforms complex datasets into clear reports, heatmaps, and drill-down analyses, making data-driven decision-making faster and more accessible for teams of all sizes.
PlotsAlot
PlotsAlot is an AI-powered data analysis and visualization platform that transforms raw data into professional-grade charts, dashboards, and …
PlotsAlot is an AI-powered data analysis and visualization platform that transforms raw data into professional-grade charts, dashboards, and actionable insights. Simply upload your data and use natural language prompts to chat with it, perform advanced analysis, and predict trends in seconds.
Polymer Search
Polymer Search is an AI-driven embedded analytics platform designed to supercharge products with powerful, white-labeled data visualizations. It …
Polymer Search is an AI-driven embedded analytics platform designed to supercharge products with powerful, white-labeled data visualizations. It enables seamless integration of beautiful dashboards and reports directly into your application, empowering users with self-serve analytics and AI-generated insights, all with minimal development effort.
Microsoft Power BI Category
Microsoft Power BI Tag
Microsoft Power BI AI Tool Comparison
Microsoft Power BI Embed Feature
Just copy the embed code below and paste this beautiful badge on your blog, article, or official app website to drive traffic directly to this tool's detail page and quickly boost your exposure and user count!

No comments yet, be the first to comment!