GraphMaker
Visit Website
GraphMaker Overview
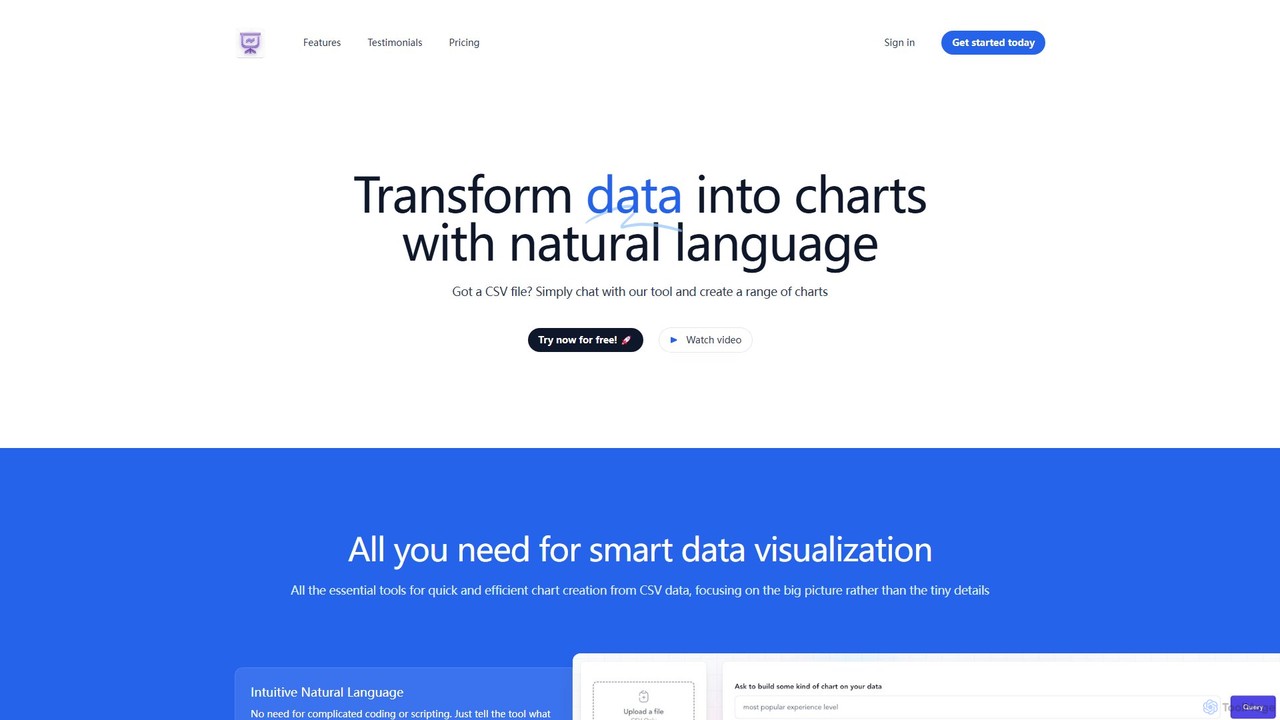
GraphMaker is a revolutionary AI-driven platform designed to simplify and accelerate the process of data visualization. It empowers users, regardless of their technical expertise, to transform raw data into beautiful and insightful charts and graphs in mere seconds. By leveraging the power of artificial intelligence and natural language processing (NLP), GraphMaker removes the steep learning curve associated with traditional data visualization software. Users can simply 'talk' to their data, asking questions in plain English to generate complex visualizations instantly.
The platform supports multiple data sources, offering the flexibility to upload data directly from CSV or other spreadsheet files, or connect seamlessly with Google Sheets. This versatility makes it an ideal tool for a wide range of users, from business analysts and marketers to students and researchers, who need to quickly analyze and present their data.
How to use GraphMaker
Using GraphMaker is an intuitive and straightforward process, designed to get you from data to insight as quickly as possible:
- Upload Your Data: Start by providing your dataset. You can drag and drop a CSV or spreadsheet file directly onto the platform, browse your local files, or connect your Google Sheets account for live data access.
- Talk to Your Data: This is where the magic happens. Use the chat-based interface to issue commands in natural language. For example, you can type 'Show me orders by region as a bar chart' or 'What is the distribution of user sign-ups by month?'.
- Instant Visualization: The AI engine will immediately interpret your request, analyze the corresponding data, and generate the appropriate chart or graph.
- Refine and Analyze: Review the generated visualization. You can ask follow-up questions to drill down further into your data or request different chart types to view the information from another perspective, such as 'Now show this as a pie chart'.
- Export and Share: Once you are satisfied with your chart, you can export it for use in reports, presentations, or publications.
Core Features of GraphMaker
- AI-Powered Chat Interface: Interact with your data using natural language commands, eliminating the need for complex menus or coding.
- Multiple Data Source Integration: Easily upload data from CSV and spreadsheet files or connect directly to Google Sheets.
- Variety of Chart Types: Generate a wide range of visualizations, including bar charts, scatter plots, pie charts, histograms, and line charts.
- Instantaneous Generation: Go from raw data to a completed chart in seconds, significantly boosting productivity.
- Data Privacy and Security: The platform is built with a strong emphasis on security, with a policy of never storing user data on its servers.
- No-Code Platform: Fully accessible to non-technical users, democratizing data analysis and visualization.
Use Cases for GraphMaker
GraphMaker is a versatile tool applicable across various domains:
- Business Intelligence: Sales managers can quickly visualize sales performance by region, product, or time period to identify trends and opportunities.
- Marketing Analysis: Marketers can analyze campaign data, track user engagement metrics (e.g., 'How many of my users use Gmail?'), and understand customer demographics.
- Academic Research: Students and researchers can efficiently create charts and graphs from experimental data for their papers and presentations.
- Financial Reporting: Financial analysts can generate charts to summarize financial statements, track expenses, and present key performance indicators to stakeholders.
- Operations Management: Operations teams can visualize inventory levels, supply chain logistics, and production metrics to optimize processes.
Advantages of GraphMaker
GraphMaker offers significant advantages over traditional methods:
- Unmatched Speed: The AI-driven process is significantly faster than manually creating charts in software like Excel.
- Ease of Use: The intuitive chat interface makes it accessible to everyone, regardless of their data analysis skills.
- Enhanced Productivity: Automates the tedious task of chart creation, freeing up valuable time for analysis and decision-making.
- High Security: The commitment to not storing user data provides peace of mind for users handling sensitive information.
- Cost-Effective: Reduces the need for expensive, complex BI software and specialized personnel.
Pricing and Plans
GraphMaker is expected to operate on a freemium model, making it accessible to a wide audience while offering advanced capabilities for professional users. While specific pricing details should be confirmed on the official website, a likely structure is:
- Free Plan: Ideal for students, individuals, or users with basic needs. This plan would likely offer a limited number of chart generations per month and access to standard chart types.
- Pro Plan: Designed for professionals, business analysts, and teams. This tier would likely include unlimited chart creation, access to all chart types, priority support, and potentially advanced features like team collaboration and branding options.
Please visit the official GraphMaker website for the most current and detailed pricing information.
GraphMaker Comments (0)
Log in to post comments
Log in nowGraphMakerWebsite Traffic Analysis
Latest Traffic
Status
Monthly Traffic Trend
Geography
Top 5 Countries/Regions
-
🇺🇸 United States37.42%
-
🇬🇧 United Kingdom20.12%
-
🇦🇺 Australia16.83%
-
🇮🇳 India15.41%
-
🇧🇷 Brazil10.22%
Popular Keywords
| Keyword | Cost Per Click |
|---|---|
|
$3.01
|
|
|
$5.22
|
|
|
$3.08
|
|
|
$3.80
|
|
|
$1.56
|
GraphMaker Alternatives
View All
Viewit Ai Chatbot
An AI-powered chatbot that transforms your data into insightful visualizations and summaries through simple, natural language conversations. Upload …
An AI-powered chatbot that transforms your data into insightful visualizations and summaries through simple, natural language conversations. Upload your dataset, ask questions, and instantly receive charts, graphs, and key metrics, making data analysis accessible to everyone without needing complex software or coding skills.
chat2csv
chat2csv is an AI-powered data visualization tool that transforms CSV files into various charts using simple, natural language …
chat2csv is an AI-powered data visualization tool that transforms CSV files into various charts using simple, natural language commands. No coding is required. Just upload your data, chat with the AI, and instantly generate bar charts, pie charts, line graphs, and more. It's designed for quick, intuitive analysis while prioritizing user data privacy.

Othor AI
Othor AI is a no-code business intelligence platform that transforms your data into actionable insights in seconds. It …
Othor AI is a no-code business intelligence platform that transforms your data into actionable insights in seconds. It automatically generates narrative-driven reports, smart charts, and predictive analytics, enabling anyone in your organization to make faster, data-driven decisions without technical expertise. Connect your data sources and get instant dashboards and executive summaries.
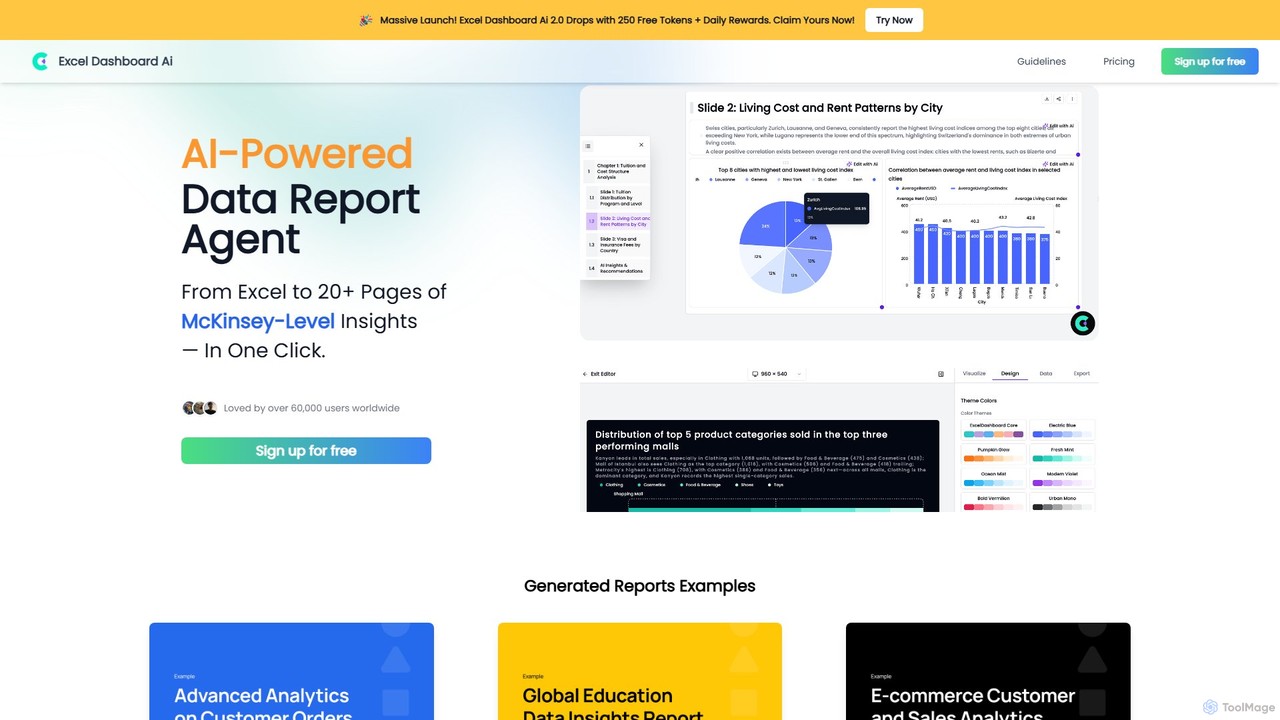
ExcelDashboard.ai
ExcelDashboard.ai is an AI-powered data analysis tool that instantly transforms raw Excel or CSV files into interactive dashboards …
ExcelDashboard.ai is an AI-powered data analysis tool that instantly transforms raw Excel or CSV files into interactive dashboards and comprehensive, multi-page reports. With a single click, it generates deep, McKinsey-level insights, visualizes data, and allows users to explore information using natural language commands. It's designed for users of all skill levels to make data-driven decisions without needing programming expertise.
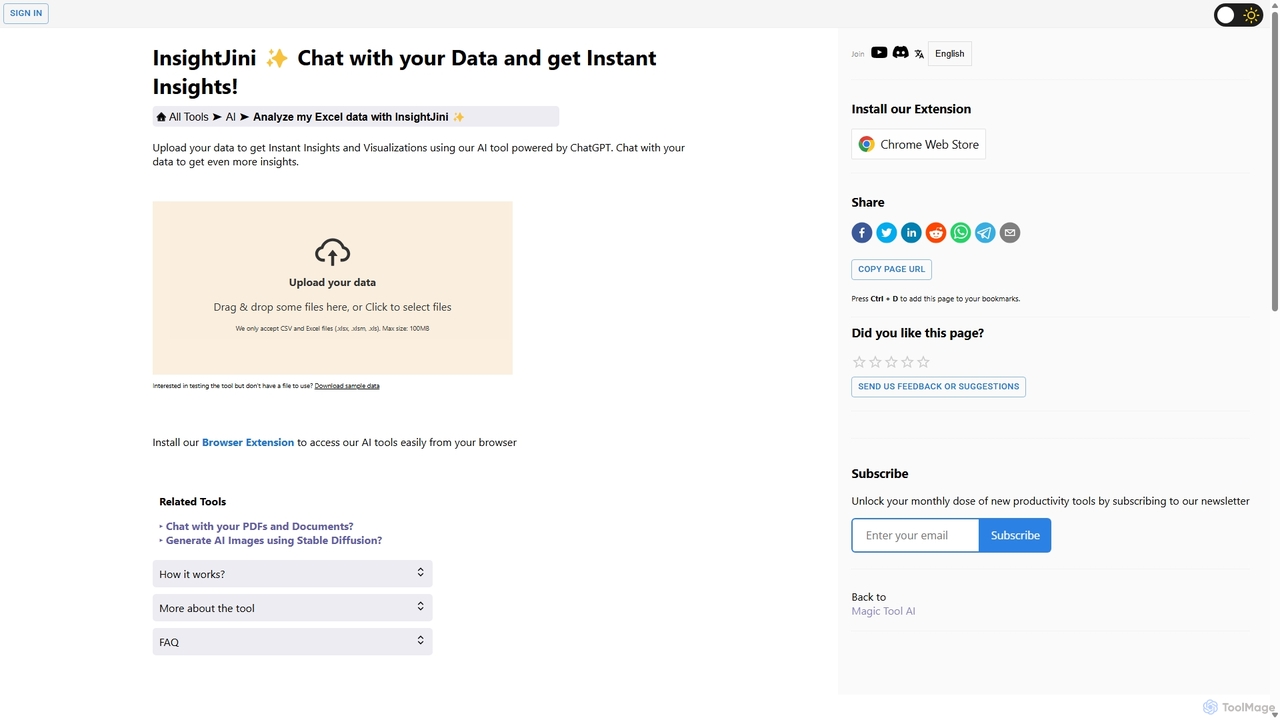
InsightJini
InsightJini is an AI-powered data analysis tool that lets you chat with your Excel and CSV files. Upload …
InsightJini is an AI-powered data analysis tool that lets you chat with your Excel and CSV files. Upload your data to instantly generate visualizations and insights without any coding. Its conversational interface, powered by ChatGPT, makes data exploration intuitive and accessible for everyone.
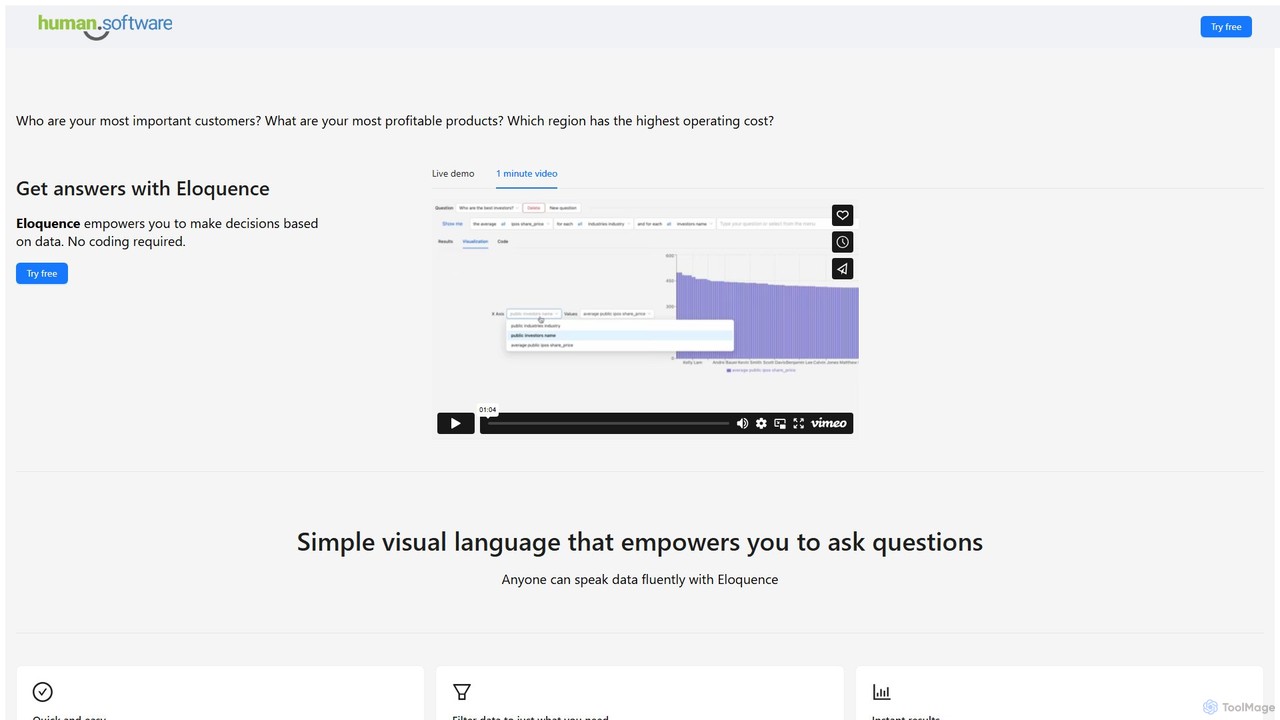
Eloquence
Eloquence is a no-code business intelligence platform that empowers anyone to query databases using structured natural language. Connect …
Eloquence is a no-code business intelligence platform that empowers anyone to query databases using structured natural language. Connect your data, ask complex questions without writing code, and get instant answers to make data-driven decisions. It prioritizes security with robust encryption and a strict no-data-saved policy.
SheetBot
SheetBot is an AI-powered data analysis platform that enables users to analyze, visualize, and transform data without writing …
SheetBot is an AI-powered data analysis platform that enables users to analyze, visualize, and transform data without writing any code. Simply upload your dataset or connect a data source, ask questions in plain English, and receive instant insights, trends, and dynamic visualizations. Powered by advanced models like GPT-4o and Claude 3.5 Sonnet, it streamlines complex analyses, turning hours of work into minutes.
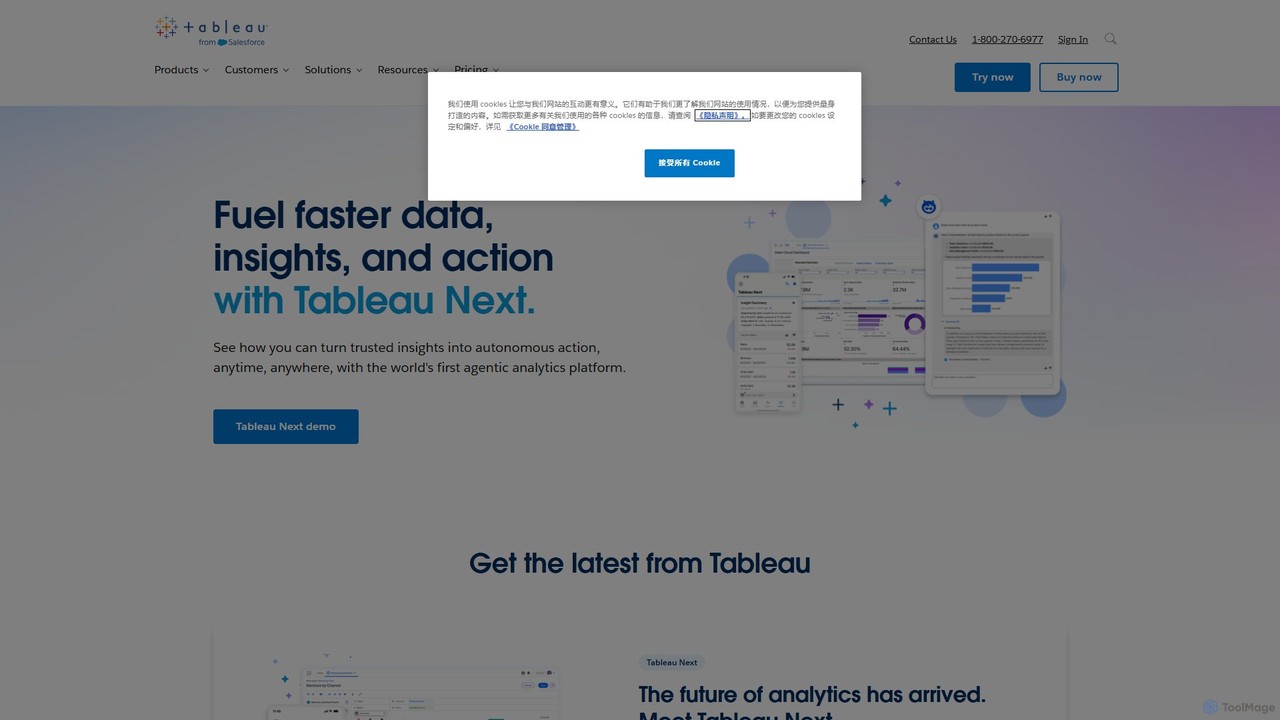
Tableau
Tableau is a leading AI-powered business intelligence and analytics platform that helps people see and understand data. It …
Tableau is a leading AI-powered business intelligence and analytics platform that helps people see and understand data. It enables users to create interactive dashboards, perform complex data analysis, and share insights across their organization, enhanced by AI features like Tableau Agent for accelerated decision-making.
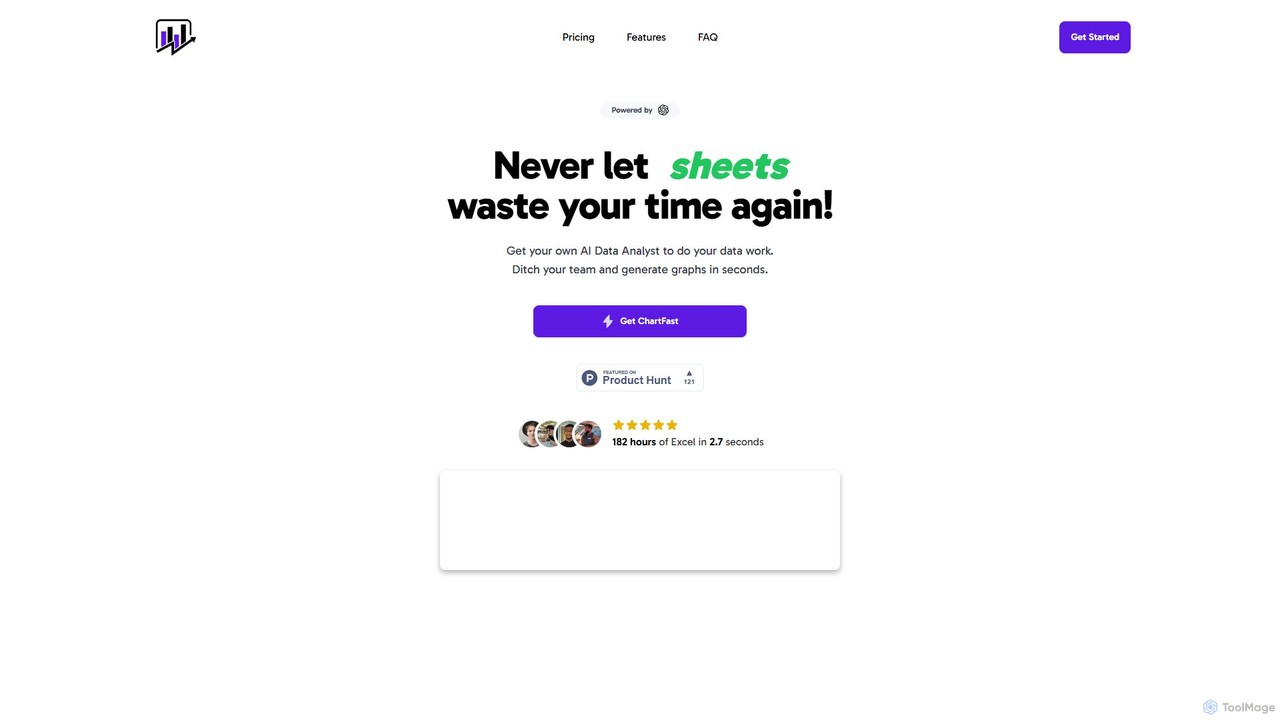
ChartFast
ChartFast is an AI-powered data analyst that transforms your data work. Upload CSV or Excel files, and it …
ChartFast is an AI-powered data analyst that transforms your data work. Upload CSV or Excel files, and it automatically cleans, analyzes, and visualizes your data. Generate complex charts and gain insights in seconds by simply asking questions, eliminating hours of manual spreadsheet tasks.
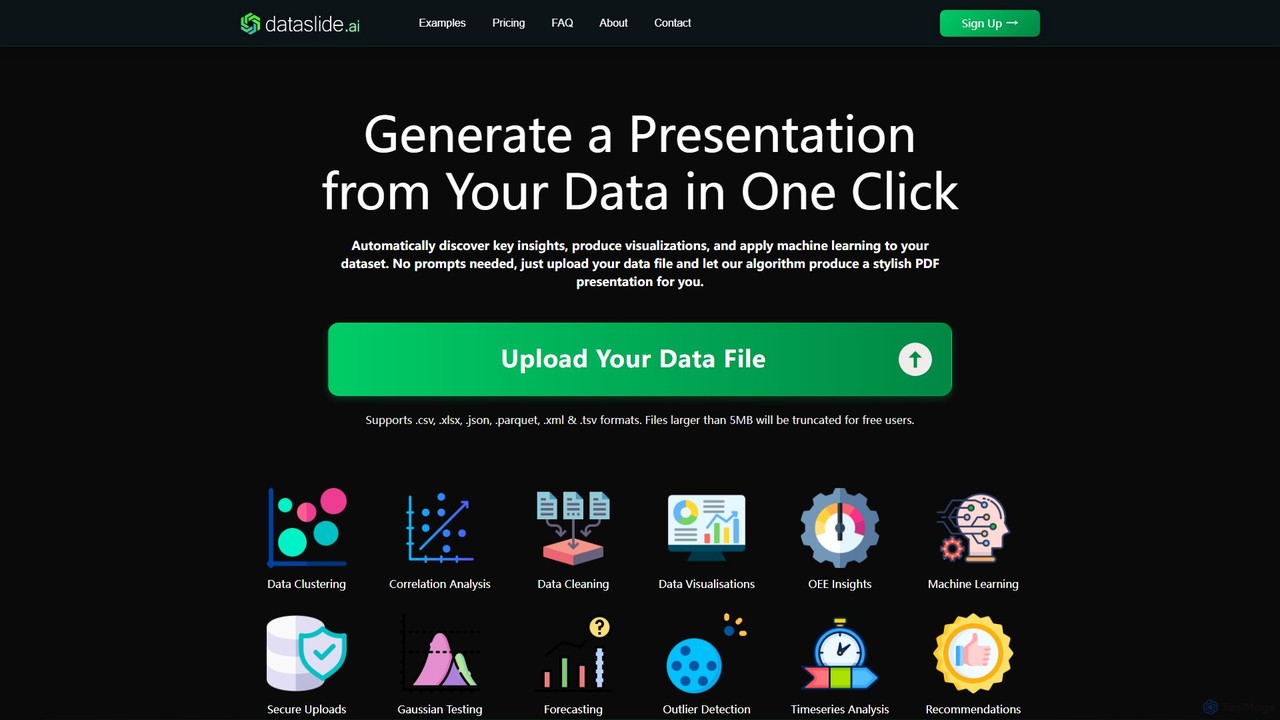
Dataslide.ai
Dataslide.ai is an AI-powered tool that automatically generates insightful presentations from your data in a single click. Simply …
Dataslide.ai is an AI-powered tool that automatically generates insightful presentations from your data in a single click. Simply upload your data file (.csv, .xlsx, etc.), and it performs data cleaning, visualization, and machine learning to produce a comprehensive PDF or PowerPoint report, saving hours of manual analysis.
GraphMaker Category
GraphMaker Tag
GraphMaker AI Tool Comparison
GraphMaker Embed Feature
Just copy the embed code below and paste this beautiful badge on your blog, article, or official app website to drive traffic directly to this tool's detail page and quickly boost your exposure and user count!

No comments yet, be the first to comment!