ChartFast
Visit Website
ChartFast Overview
ChartFast is a revolutionary AI data analysis tool designed to eliminate the tedious and time-consuming tasks associated with data processing and visualization. Powered by the advanced GPT-4o model, ChartFast acts as your personal data analyst, capable of turning raw data from spreadsheets into insightful, presentation-ready charts in mere seconds. It addresses the common pain points of data work, such as data cleaning, handling missing values, identifying outliers, and normalization, by automating the entire process. This allows professionals and teams to move beyond the repetitive grind of spreadsheet management and focus on what truly matters: making informed, data-driven decisions.
The platform is built on a dedicated server infrastructure, ensuring it can handle vast amounts of data with high performance and without slowing down. Whether you're a data analyst, a business owner, a marketer, or a student, ChartFast streamlines your workflow, significantly boosting productivity and reducing the risk of human error that is often associated with manual data manipulation.
How to use ChartFast
Using ChartFast is designed to be an intuitive and straightforward process, requiring no advanced technical skills. Here’s a typical workflow:
- Upload Your Data: Begin by importing your dataset. ChartFast supports popular file formats like .csv and Excel (.xlsx). You can simply drag and drop your file or select it from your computer.
- Let AI Preprocess: Upon upload, the AI can automatically perform data cleaning tasks. It identifies and handles issues like missing values, outliers, and inconsistencies, preparing your data for accurate analysis.
- Ask Your Question: The core of ChartFast's power lies in its interactive query feature. Instead of writing complex formulas or code, you can ask questions in plain English. For example, you could ask, "What are the monthly sales trends for the last quarter?" or "Show me a bar chart of customer distribution by country."
- Generate Visualizations Instantly: Based on your query, ChartFast's AI engine analyzes the data and generates the most appropriate and complex visualizations in seconds. This could be anything from a simple line graph to a detailed heatmap or scatter plot.
- Customize and Export: Review the generated chart. For advanced users, ChartFast provides access to the underlying Python script, allowing for deep customization of the visualization. Once you are satisfied, you can instantly export both the cleaned data and the final visualizations with a single click, ready for your reports, presentations, or further use.
Core Features of ChartFast
- Instant Plot Generation: Utilizes specialized internal libraries to create complex graphs and visualizations from your data in seconds, dramatically speeding up the analysis-to-visualization pipeline.
- Interactive Data Queries: Engage with your dataset conversationally. Ask questions in natural language to uncover expert-level insights, trends, and correlations without needing to know any query language.
- Automated Data Cleaning & Preprocessing: The AI automatically handles common data issues like missing values, outliers, and normalization upon request, ensuring your analysis is based on clean, reliable data.
- Customizable Visualization Code: For users who need more control, ChartFast offers access to the Python code used for visualization. This allows for unparalleled customization using powerful libraries like Matplotlib, Seaborn, and Plotly on a dedicated server.
- High-Performance Processing: Built on a high-RAM environment, ChartFast can efficiently process large datasets without performance degradation, making it suitable for complex projects.
- Quick Data & Chart Export: Seamlessly import your files and export your completed work. Both the processed data and the generated charts can be downloaded instantly with a single click.
Use Cases for ChartFast
ChartFast is a versatile tool applicable across various professional domains:
- Business Analysts: Quickly generate quarterly reports, analyze sales performance, and visualize key performance indicators (KPIs) to provide actionable insights to management.
- Marketing Professionals: Analyze marketing campaign effectiveness, visualize customer segmentation, and track social media engagement metrics to optimize marketing strategies.
- Founders & CEOs: Get a quick, high-level overview of business health, track growth metrics, and make faster, data-informed strategic decisions without relying on a data team for every query.
- Researchers & Academics: Process and visualize experimental data, identify trends in large datasets, and create publication-quality charts for papers and presentations.
- Students: Complete data-related assignments and projects efficiently, learning to interpret data and present findings professionally without getting bogged down in complex software.
Advantages of ChartFast
The primary advantage of ChartFast is its massive efficiency gain. It transforms a process that could take hours or even days into a matter of seconds. By automating repetitive tasks, it frees up valuable time for strategic thinking and analysis. The AI-driven approach ensures a high degree of accuracy, minimizing the risk of costly human errors in data cleaning and calculation. Furthermore, its user-friendly, query-based interface makes sophisticated data analysis accessible to non-technical users, democratizing data insights across an organization. The ability to handle large datasets and provide customizable code offers a powerful, scalable solution for all data needs.
Pricing and Plans
ChartFast offers a lifetime access model, where you pay once and use the dashboard forever. The plans are designed to cater to different levels of usage.
- Starter Plan: Ideal for small projects and individual users. For a one-time payment of $9 (currently on a 50% launch discount from $18), you get lifetime access, 250 generations per month, and the ability to upload up to 5 files at a time.
- Advanced Plan: The most popular choice for power users and professionals. For a one-time payment of $15 (currently on a 50% launch discount from $30), you get lifetime access, 1000 generations per month, unlimited file uploads, longer input lengths, access to runtime code for customization, a high-RAM environment for large datasets, and priority support.
ChartFast Comments (0)
Log in to post comments
Log in nowChartFast Alternatives
View All
InsightJini
InsightJini is an AI-powered data analysis tool that lets you chat with your Excel and CSV files. Upload …
InsightJini is an AI-powered data analysis tool that lets you chat with your Excel and CSV files. Upload your data to instantly generate visualizations and insights without any coding. Its conversational interface, powered by ChatGPT, makes data exploration intuitive and accessible for everyone.
Dataslide.ai
Dataslide.ai is an AI-powered tool that automatically generates insightful presentations from your data in a single click. Simply …
Dataslide.ai is an AI-powered tool that automatically generates insightful presentations from your data in a single click. Simply upload your data file (.csv, .xlsx, etc.), and it performs data cleaning, visualization, and machine learning to produce a comprehensive PDF or PowerPoint report, saving hours of manual analysis.

Viewit Ai Chatbot
An AI-powered chatbot that transforms your data into insightful visualizations and summaries through simple, natural language conversations. Upload …
An AI-powered chatbot that transforms your data into insightful visualizations and summaries through simple, natural language conversations. Upload your dataset, ask questions, and instantly receive charts, graphs, and key metrics, making data analysis accessible to everyone without needing complex software or coding skills.
Tableau
Tableau is a leading AI-powered business intelligence and analytics platform that helps people see and understand data. It …
Tableau is a leading AI-powered business intelligence and analytics platform that helps people see and understand data. It enables users to create interactive dashboards, perform complex data analysis, and share insights across their organization, enhanced by AI features like Tableau Agent for accelerated decision-making.
SheetBot
SheetBot is an AI-powered data analysis platform that enables users to analyze, visualize, and transform data without writing …
SheetBot is an AI-powered data analysis platform that enables users to analyze, visualize, and transform data without writing any code. Simply upload your dataset or connect a data source, ask questions in plain English, and receive instant insights, trends, and dynamic visualizations. Powered by advanced models like GPT-4o and Claude 3.5 Sonnet, it streamlines complex analyses, turning hours of work into minutes.
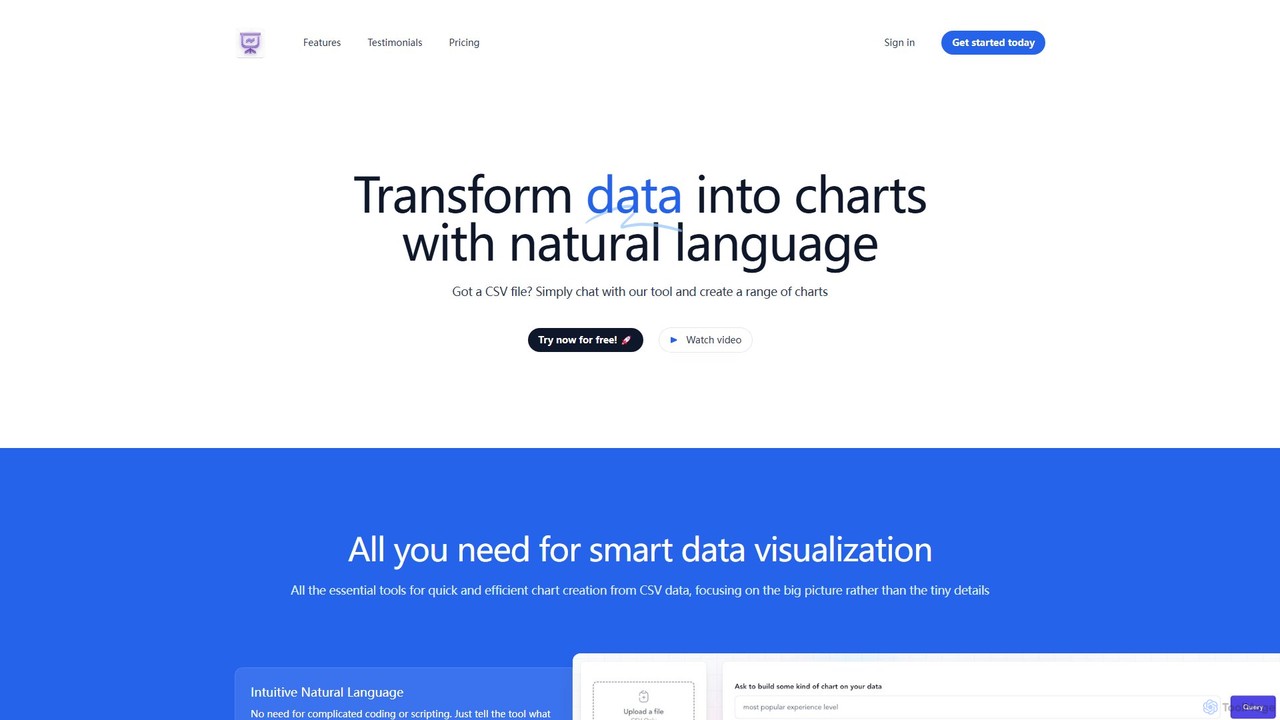
chat2csv
chat2csv is an AI-powered data visualization tool that transforms CSV files into various charts using simple, natural language …
chat2csv is an AI-powered data visualization tool that transforms CSV files into various charts using simple, natural language commands. No coding is required. Just upload your data, chat with the AI, and instantly generate bar charts, pie charts, line graphs, and more. It's designed for quick, intuitive analysis while prioritizing user data privacy.
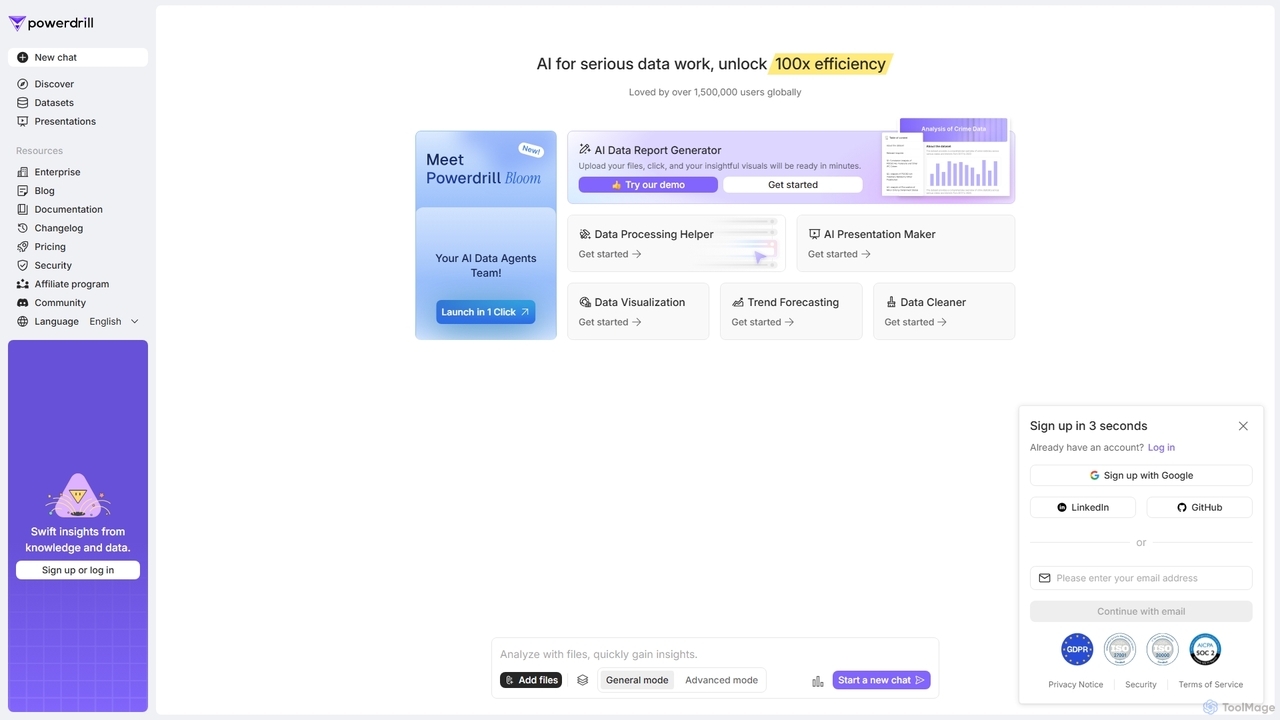
Powerdrill
Powerdrill is an AI-powered data analysis platform designed for serious data work, enabling users to unlock 100x efficiency. …
Powerdrill is an AI-powered data analysis platform designed for serious data work, enabling users to unlock 100x efficiency. It automates the entire process from data processing and cleaning to visualization, report generation, and trend forecasting. Simply upload your files (Excel, CSV, PDF) or connect to a database, and let the AI generate actionable insights, interactive charts, and comprehensive presentations in minutes.
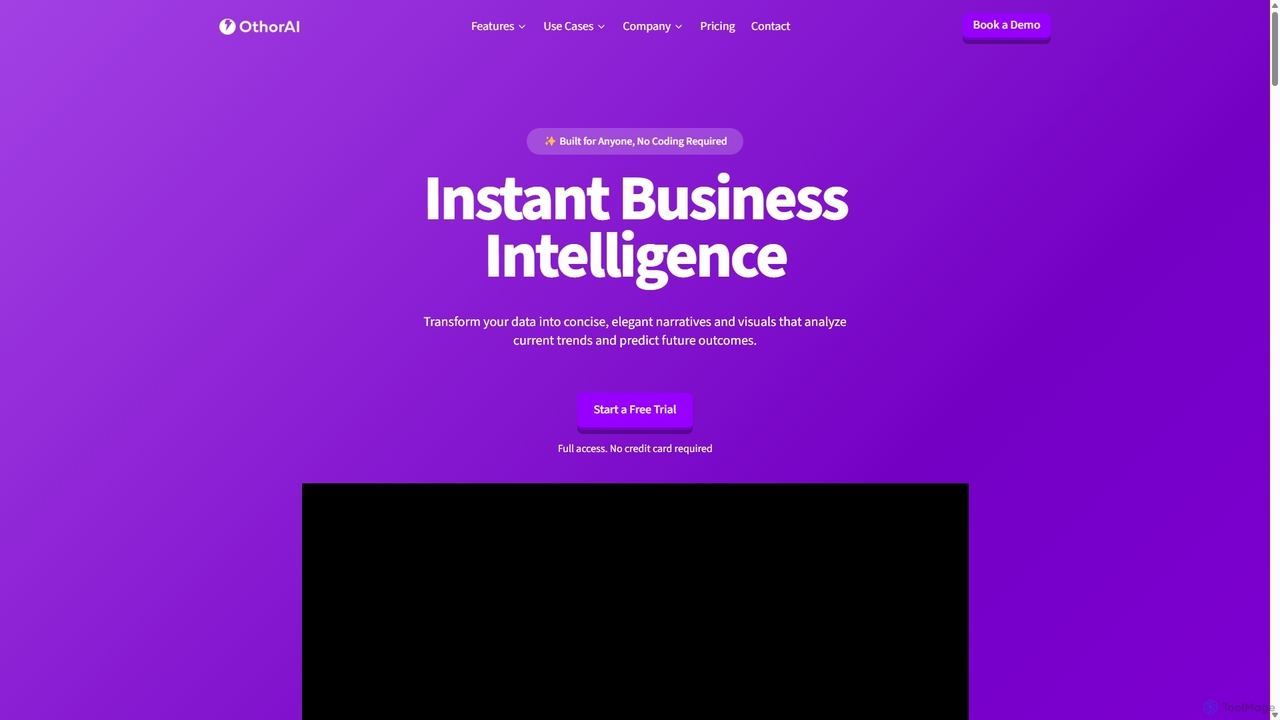
Othor AI
Othor AI is a no-code business intelligence platform that transforms your data into actionable insights in seconds. It …
Othor AI is a no-code business intelligence platform that transforms your data into actionable insights in seconds. It automatically generates narrative-driven reports, smart charts, and predictive analytics, enabling anyone in your organization to make faster, data-driven decisions without technical expertise. Connect your data sources and get instant dashboards and executive summaries.
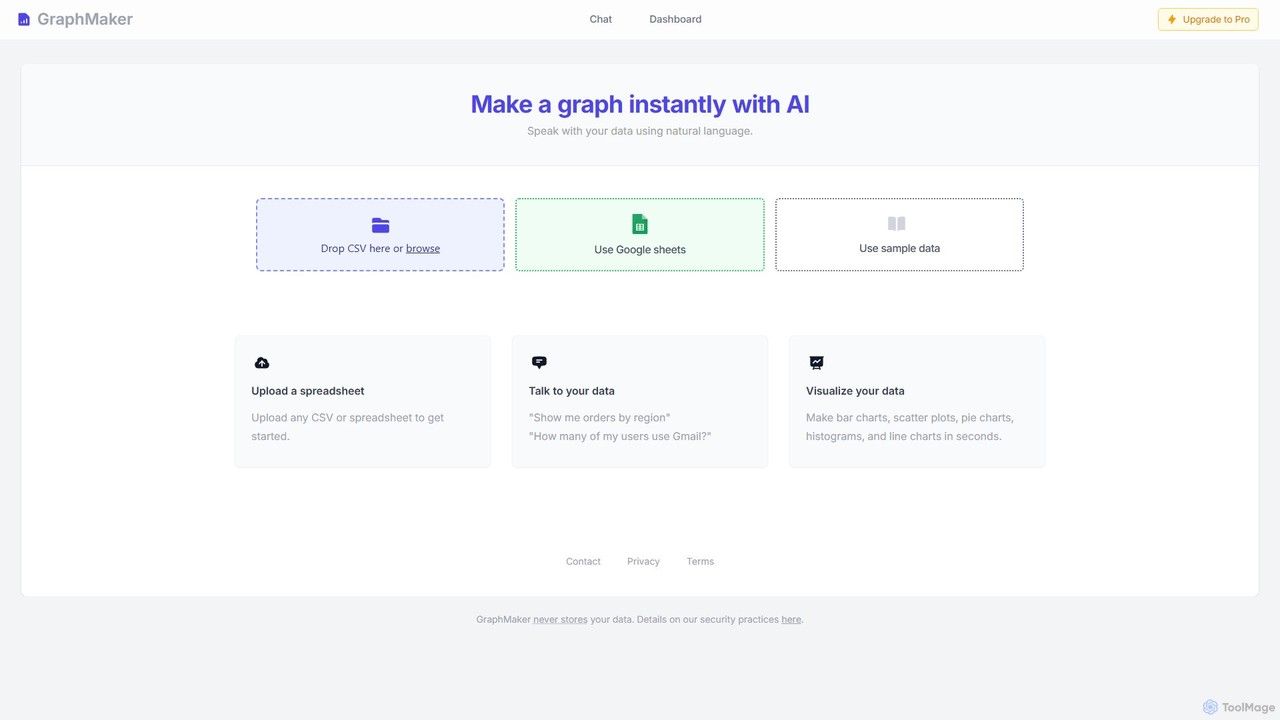
GraphMaker
GraphMaker is an AI-powered data visualization tool that allows you to create various charts and graphs in seconds. …
GraphMaker is an AI-powered data visualization tool that allows you to create various charts and graphs in seconds. Simply upload your data from a CSV file or Google Sheets, and use natural language commands to generate insightful visualizations like bar charts, pie charts, and histograms. It's designed for speed, simplicity, and security, as it never stores your data.
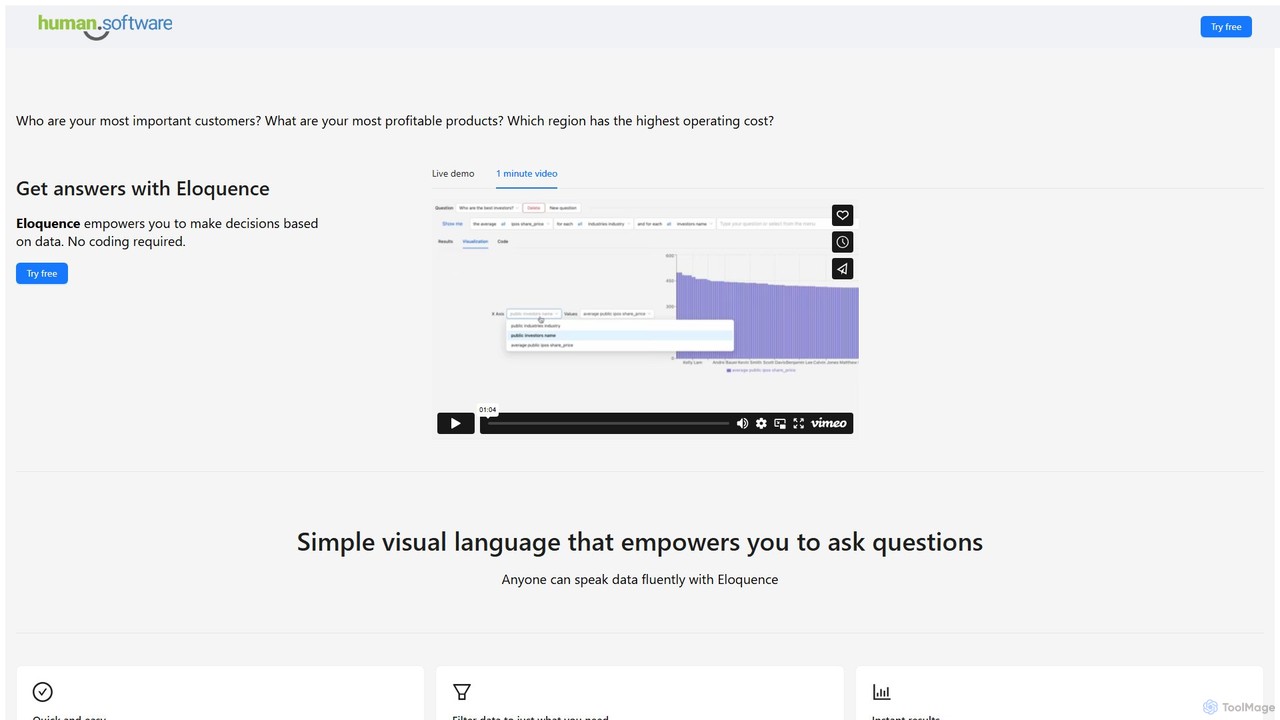
Eloquence
Eloquence is a no-code business intelligence platform that empowers anyone to query databases using structured natural language. Connect …
Eloquence is a no-code business intelligence platform that empowers anyone to query databases using structured natural language. Connect your data, ask complex questions without writing code, and get instant answers to make data-driven decisions. It prioritizes security with robust encryption and a strict no-data-saved policy.
ChartFast Category
ChartFast Tag
ChartFast AI Tool Comparison
ChartFast Embed Feature
Just copy the embed code below and paste this beautiful badge on your blog, article, or official app website to drive traffic directly to this tool's detail page and quickly boost your exposure and user count!

No comments yet, be the first to comment!