Dataslide.ai
Visit Website
Dataslide.ai Overview
Dataslide.ai is a powerful, one-click AI analysis tool designed to transform raw data into comprehensive and stylish presentations. Developed by a data scientist with extensive experience across industries like aerospace, Formula One, and pharmaceuticals, Dataslide.ai automates the entire data analysis workflow. It takes your data file, automatically discovers key insights, produces compelling visualizations, and even applies sophisticated machine learning models to uncover hidden patterns and trends. The platform is built for speed and efficiency, allowing users from students to professional analysts to bypass the tedious process of manual data wrangling and chart creation, and get straight to actionable insights.
The core philosophy of Dataslide.ai is simplicity. There are no complex configurations or prompts to write. The user experience is streamlined into a single action: uploading a data file. The intelligent algorithm then takes over, performing a suite of analytical tasks including data cleaning, correlation analysis, clustering, and forecasting. The final output is a professionally designed presentation, available in PDF and, for premium users, editable PowerPoint formats, making it easy to share and present findings.
How to use Dataslide.ai
Using Dataslide.ai is designed to be incredibly straightforward and efficient, requiring just a few simple steps:
- Visit the Website: Navigate to the Dataslide.ai homepage.
- Upload Your Data File: Click the upload button and select your data file. The platform supports a wide range of formats, including .csv, .xlsx, .json, .parquet, .xml, and .tsv.
- Let AI Do the Work: Once the file is uploaded, the AI algorithm begins its work automatically. It processes the data, performs various analyses, and generates visualizations and insights. This process happens in the background without any further input needed from you.
- Download Your Presentation: Within seconds or minutes, depending on the file size and server load, your presentation is ready. You can then download the generated report as a stylish PDF file. Premium users also get the option to download an editable PowerPoint (.pptx) version.
Core Features of Dataslide.ai
- Automated Insight Generation: The AI automatically scans your data to identify and highlight the most significant trends, correlations, and anomalies.
- One-Click Operation: No need for coding, complex queries, or prompt engineering. Just upload your file and get a complete analysis.
- Multi-Format Support: Accepts a wide variety of data file types, including CSV, XLSX (Excel), JSON, Parquet, XML, and TSV.
- Advanced Data Analysis: Performs a comprehensive suite of analyses, including data cleaning, correlation analysis, data clustering, outlier detection, and Gaussian testing.
- Machine Learning Integration: Applies ML models for deeper insights, such as forecasting, timeseries analysis, and generating recommendations.
- High-Quality Visualizations: Automatically creates a range of relevant and easy-to-understand charts and graphs to visually represent the data.
- Multiple Export Formats: Delivers results in a polished PDF presentation, with an option for editable PowerPoint slides for premium subscribers.
- Secure Data Handling: Ensures user data is uploaded and processed securely.
Use Cases for Dataslide.ai
Dataslide.ai is versatile and can be applied across numerous fields:
- Business Analysts: Quickly analyze sales data, customer behavior, or operational metrics to generate weekly or monthly reports for management.
- Students and Researchers: Analyze research data, survey results, or public datasets for academic projects and papers without needing advanced statistical software skills.
- Manufacturing Professionals: Upload production line data to analyze Overall Equipment Effectiveness (OEE), identify machine failure patterns, and optimize processes.
- Healthcare Analysts: Examine patient data (anonymized), sensor readings, or clinical trial results to spot trends and outliers.
- Marketing Managers: Analyze campaign performance data to understand customer segmentation, engagement metrics, and ROI.
- Data Enthusiasts: Explore public datasets like weather patterns, financial markets, or sports statistics to quickly find interesting insights.
Advantages of Dataslide.ai
The primary advantage of Dataslide.ai is its ability to dramatically reduce the time and effort required for data analysis and reporting. It democratizes data science by making powerful analytical techniques accessible to non-experts. Key advantages include:
- Time-Saving: Automates what would typically take hours or days of manual work into a process of minutes.
- Ease of Use: The one-click interface makes it accessible to anyone, regardless of their technical background.
- Expert-Level Analysis: The underlying algorithms are built on industry best practices and expert domain knowledge, ensuring the quality and relevance of the insights.
- Cost-Effective: Provides a low-cost alternative to hiring data analysts or purchasing expensive business intelligence software, with a generous free tier available.
- Actionable Outputs: The tool focuses on producing clear, actionable insights presented in a professional format, ready for decision-making.
Pricing and Plans
Dataslide.ai offers a freemium model with plans to suit different user needs:
- Free Plan: $0/month. Ideal for occasional users and small datasets. Includes access to basic features, a maximum file size of 5MB, watermarked PDF outputs, and lower computing priority.
- Premium Plan: $20/month. Perfect for students, data enthusiasts, and small businesses. Features a larger maximum file size of 50MB, unwatermarked presentations, both PDF and PowerPoint file outputs, and high computing priority.
- Professional Plan (Coming Soon): $99/month. Designed for professional analysts and companies. Offers unlimited file size, custom-styled outputs to match company branding, downloadable ML models and cleaned dataframes, and dedicated support.
- Enterprise Plan: Custom pricing. For large organizations, Dataslide.ai can create a bespoke, integrated version of the tool tailored to specific analytical needs and workflows.
Dataslide.ai Comments (0)
Log in to post comments
Log in nowDataslide.ai Alternatives
View All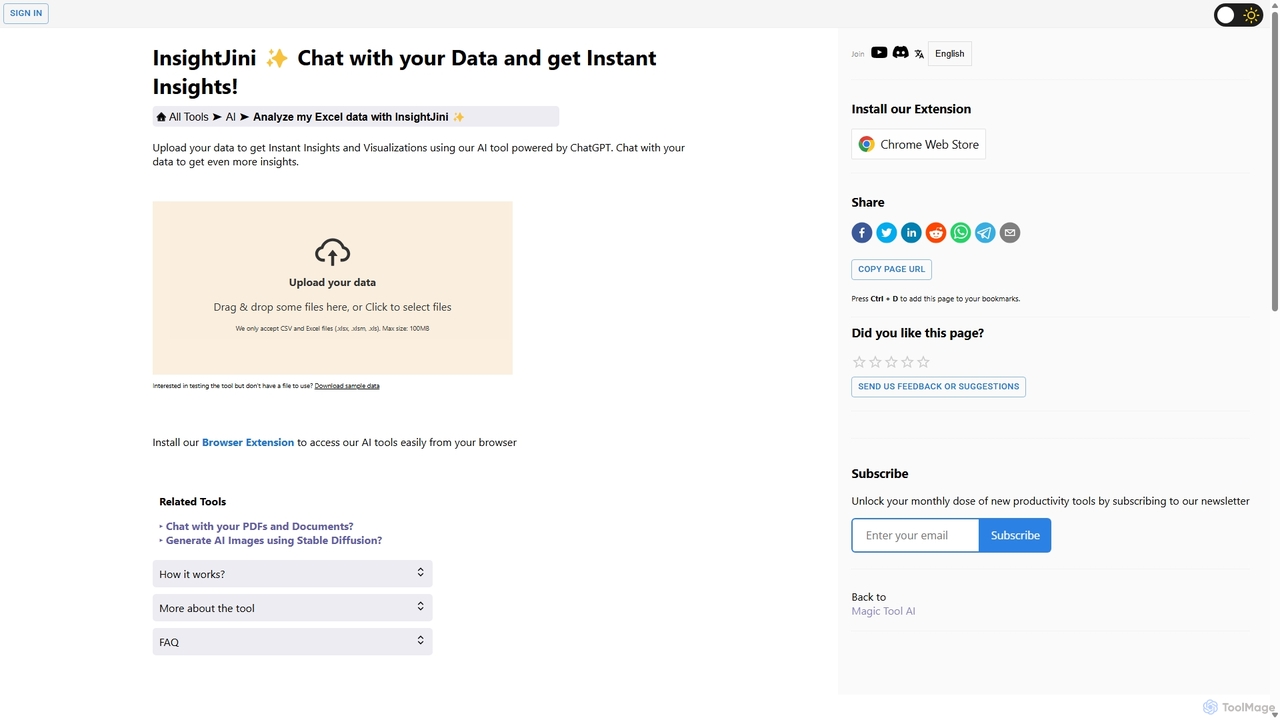
InsightJini
InsightJini is an AI-powered data analysis tool that lets you chat with your Excel and CSV files. Upload …
InsightJini is an AI-powered data analysis tool that lets you chat with your Excel and CSV files. Upload your data to instantly generate visualizations and insights without any coding. Its conversational interface, powered by ChatGPT, makes data exploration intuitive and accessible for everyone.
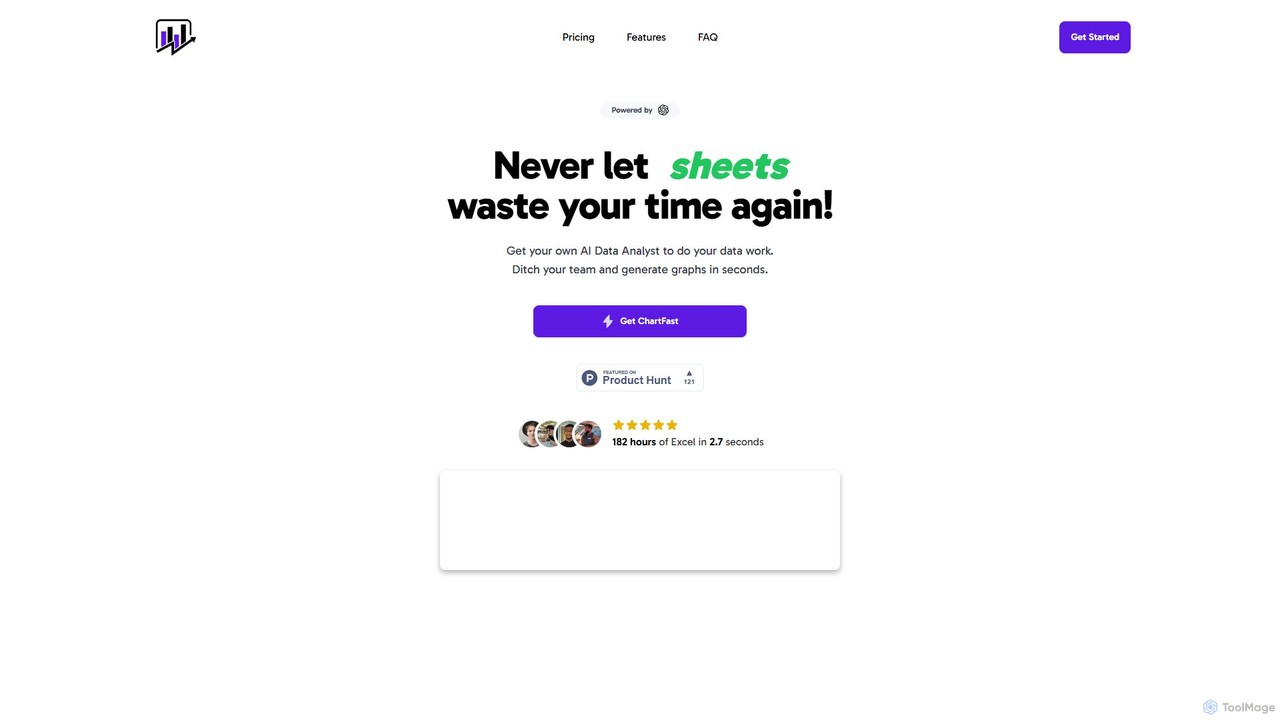
ChartFast
ChartFast is an AI-powered data analyst that transforms your data work. Upload CSV or Excel files, and it …
ChartFast is an AI-powered data analyst that transforms your data work. Upload CSV or Excel files, and it automatically cleans, analyzes, and visualizes your data. Generate complex charts and gain insights in seconds by simply asking questions, eliminating hours of manual spreadsheet tasks.

Viewit Ai Chatbot
An AI-powered chatbot that transforms your data into insightful visualizations and summaries through simple, natural language conversations. Upload …
An AI-powered chatbot that transforms your data into insightful visualizations and summaries through simple, natural language conversations. Upload your dataset, ask questions, and instantly receive charts, graphs, and key metrics, making data analysis accessible to everyone without needing complex software or coding skills.
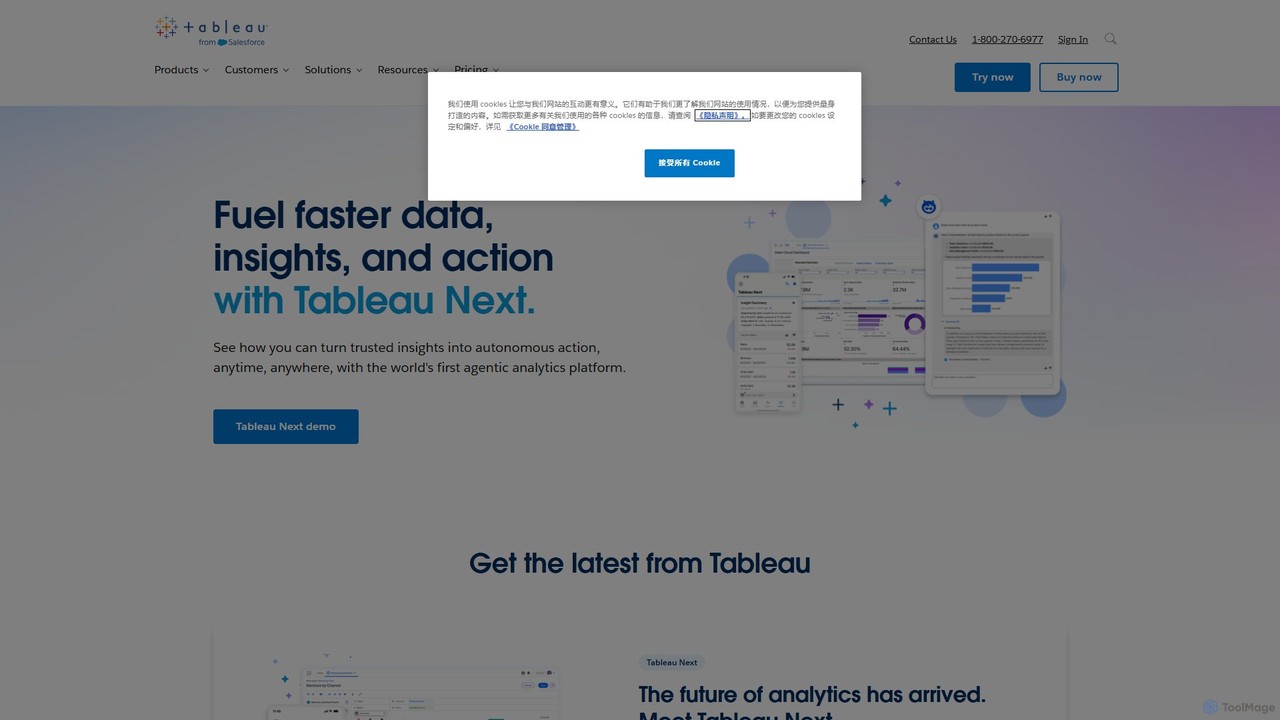
Tableau
Tableau is a leading AI-powered business intelligence and analytics platform that helps people see and understand data. It …
Tableau is a leading AI-powered business intelligence and analytics platform that helps people see and understand data. It enables users to create interactive dashboards, perform complex data analysis, and share insights across their organization, enhanced by AI features like Tableau Agent for accelerated decision-making.
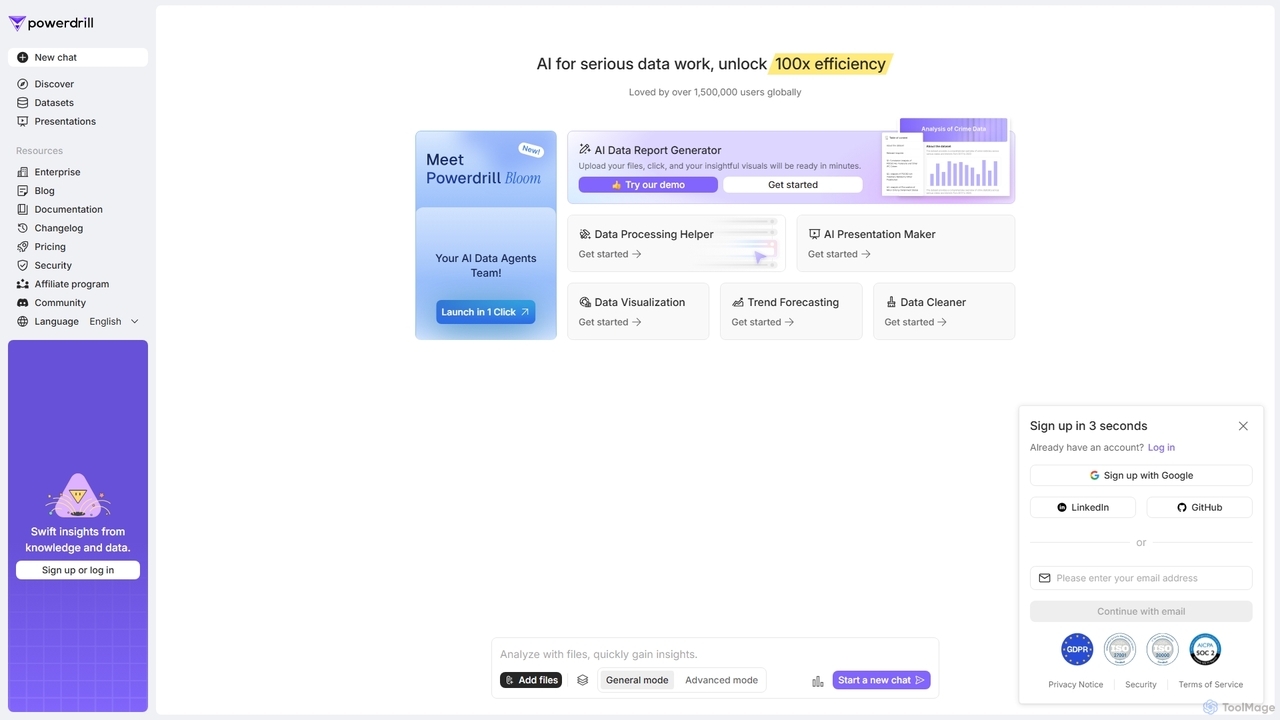
Powerdrill
Powerdrill is an AI-powered data analysis platform designed for serious data work, enabling users to unlock 100x efficiency. …
Powerdrill is an AI-powered data analysis platform designed for serious data work, enabling users to unlock 100x efficiency. It automates the entire process from data processing and cleaning to visualization, report generation, and trend forecasting. Simply upload your files (Excel, CSV, PDF) or connect to a database, and let the AI generate actionable insights, interactive charts, and comprehensive presentations in minutes.
GraphMaker
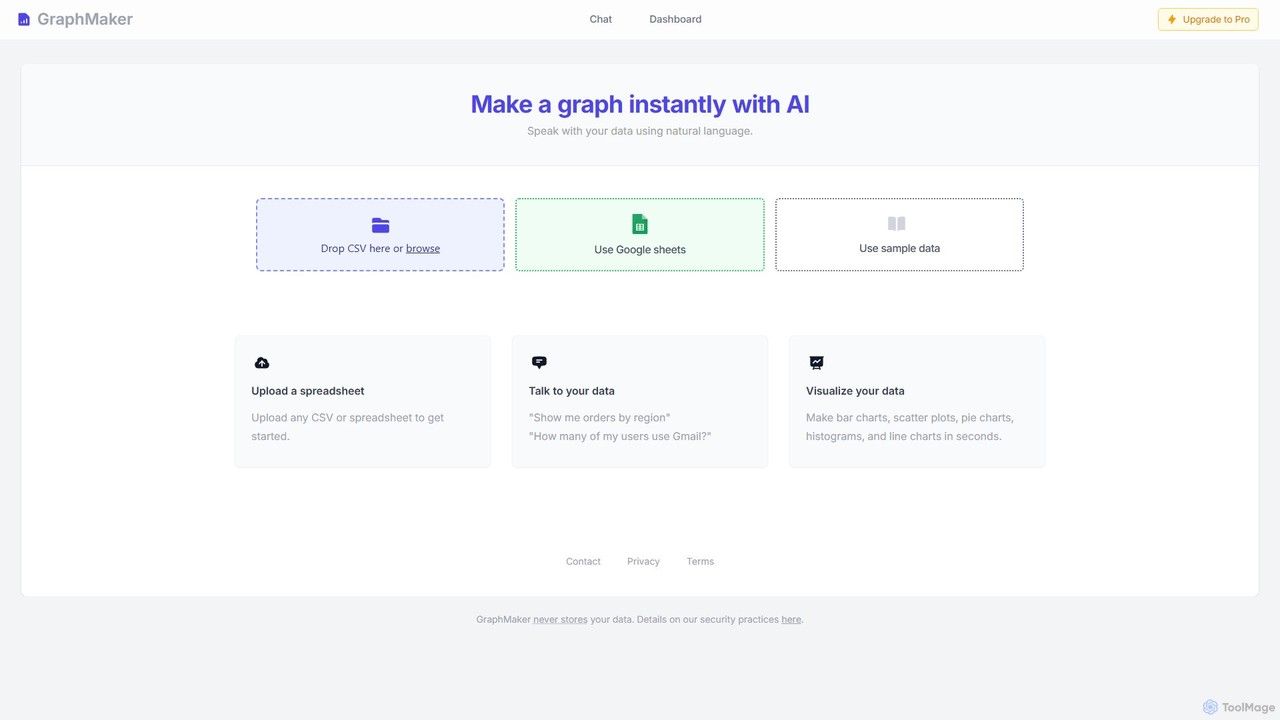
GraphMaker is an AI-powered data visualization tool that allows you to create various charts and graphs in seconds. …
GraphMaker is an AI-powered data visualization tool that allows you to create various charts and graphs in seconds. Simply upload your data from a CSV file or Google Sheets, and use natural language commands to generate insightful visualizations like bar charts, pie charts, and histograms. It's designed for speed, simplicity, and security, as it never stores your data.

Othor AI
Othor AI is a no-code business intelligence platform that transforms your data into actionable insights in seconds. It …
Othor AI is a no-code business intelligence platform that transforms your data into actionable insights in seconds. It automatically generates narrative-driven reports, smart charts, and predictive analytics, enabling anyone in your organization to make faster, data-driven decisions without technical expertise. Connect your data sources and get instant dashboards and executive summaries.
ExcelDashboard.ai
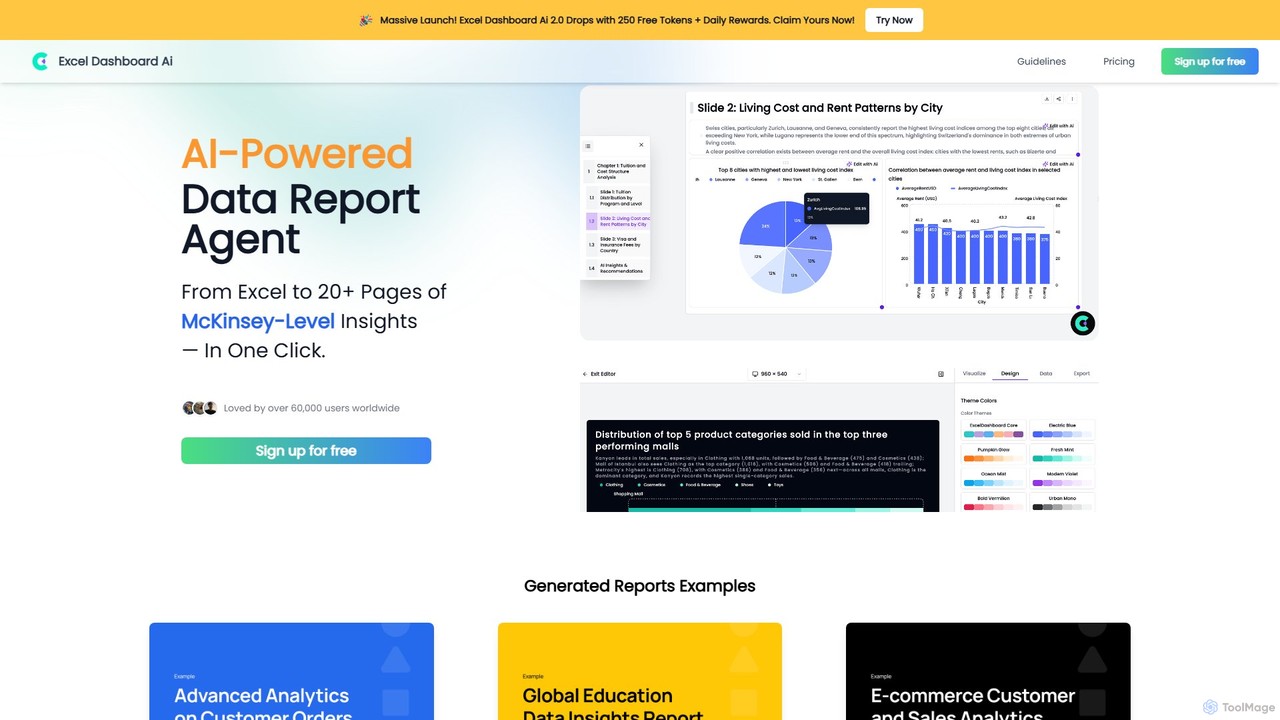
ExcelDashboard.ai is an AI-powered data analysis tool that instantly transforms raw Excel or CSV files into interactive dashboards …
ExcelDashboard.ai is an AI-powered data analysis tool that instantly transforms raw Excel or CSV files into interactive dashboards and comprehensive, multi-page reports. With a single click, it generates deep, McKinsey-level insights, visualizes data, and allows users to explore information using natural language commands. It's designed for users of all skill levels to make data-driven decisions without needing programming expertise.
Eloquence
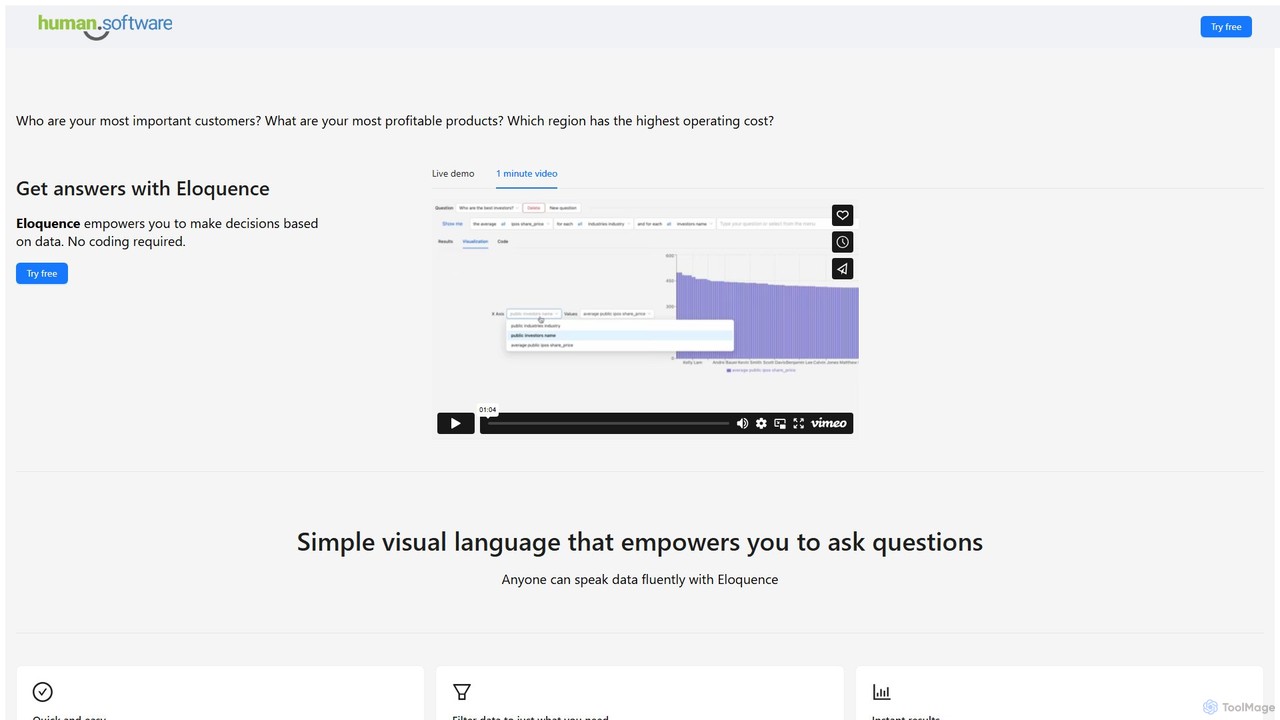
Eloquence is a no-code business intelligence platform that empowers anyone to query databases using structured natural language. Connect …
Eloquence is a no-code business intelligence platform that empowers anyone to query databases using structured natural language. Connect your data, ask complex questions without writing code, and get instant answers to make data-driven decisions. It prioritizes security with robust encryption and a strict no-data-saved policy.
SheetBot
SheetBot is an AI-powered data analysis platform that enables users to analyze, visualize, and transform data without writing …
SheetBot is an AI-powered data analysis platform that enables users to analyze, visualize, and transform data without writing any code. Simply upload your dataset or connect a data source, ask questions in plain English, and receive instant insights, trends, and dynamic visualizations. Powered by advanced models like GPT-4o and Claude 3.5 Sonnet, it streamlines complex analyses, turning hours of work into minutes.
Dataslide.ai Category
Dataslide.ai Tag
Dataslide.ai AI Tool Comparison
Dataslide.ai Embed Feature
Just copy the embed code below and paste this beautiful badge on your blog, article, or official app website to drive traffic directly to this tool's detail page and quickly boost your exposure and user count!

No comments yet, be the first to comment!