Graphy
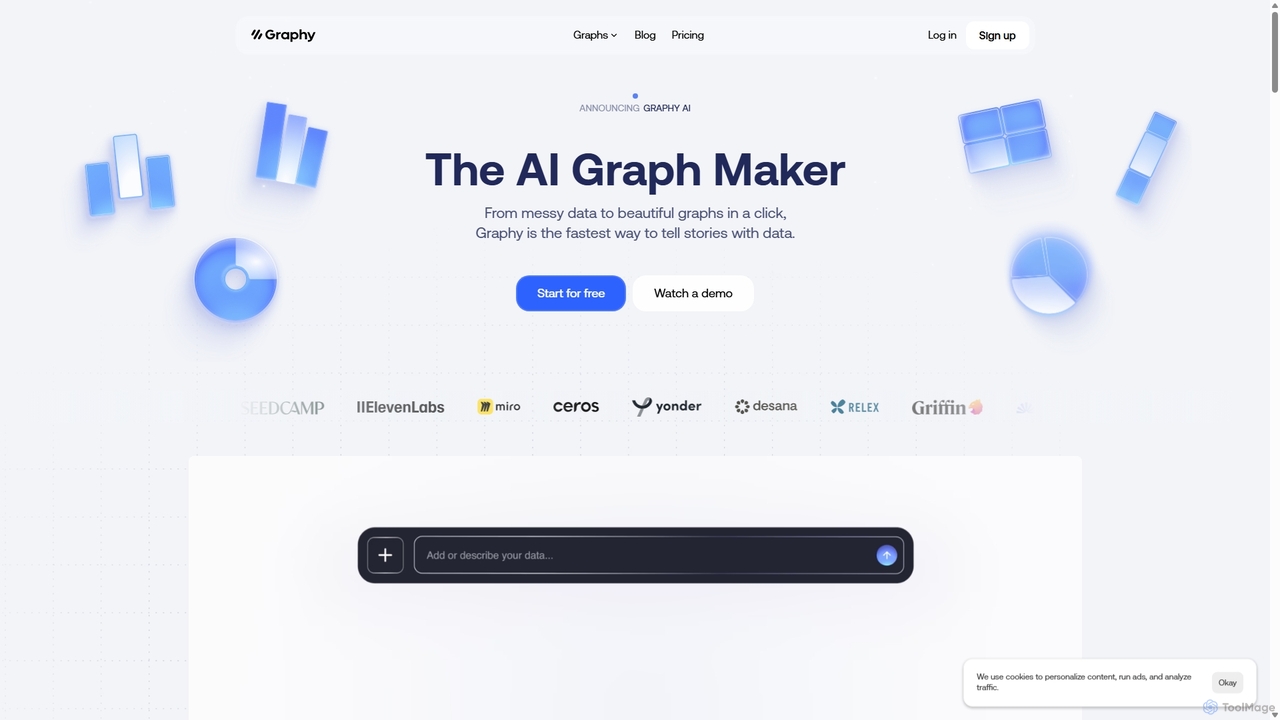
Graphy is an AI-powered data visualization tool that transforms raw data into beautiful, interactive charts and graphs in …
Graphy is an AI-powered data visualization tool that transforms raw data into beautiful, interactive charts and graphs in seconds. It simplifies data storytelling by automatically identifying key insights, allowing users to chat with their data, and offering extensive customization. Ideal for marketers, analysts, and teams who need to create compelling visual reports and presentations without complex software.

daxrm
daxrm is an all-in-one CRM and project management platform designed for digital marketing, SEO, and PPC agencies. It …
daxrm is an all-in-one CRM and project management platform designed for digital marketing, SEO, and PPC agencies. It streamlines workflows by integrating client management, interactive project tracking, and automated, white-label reporting into a single dashboard. Connect all your marketing data sources, track keyword rankings, and generate insightful reports with its intuitive drag-and-drop builder.
Dataslide.ai
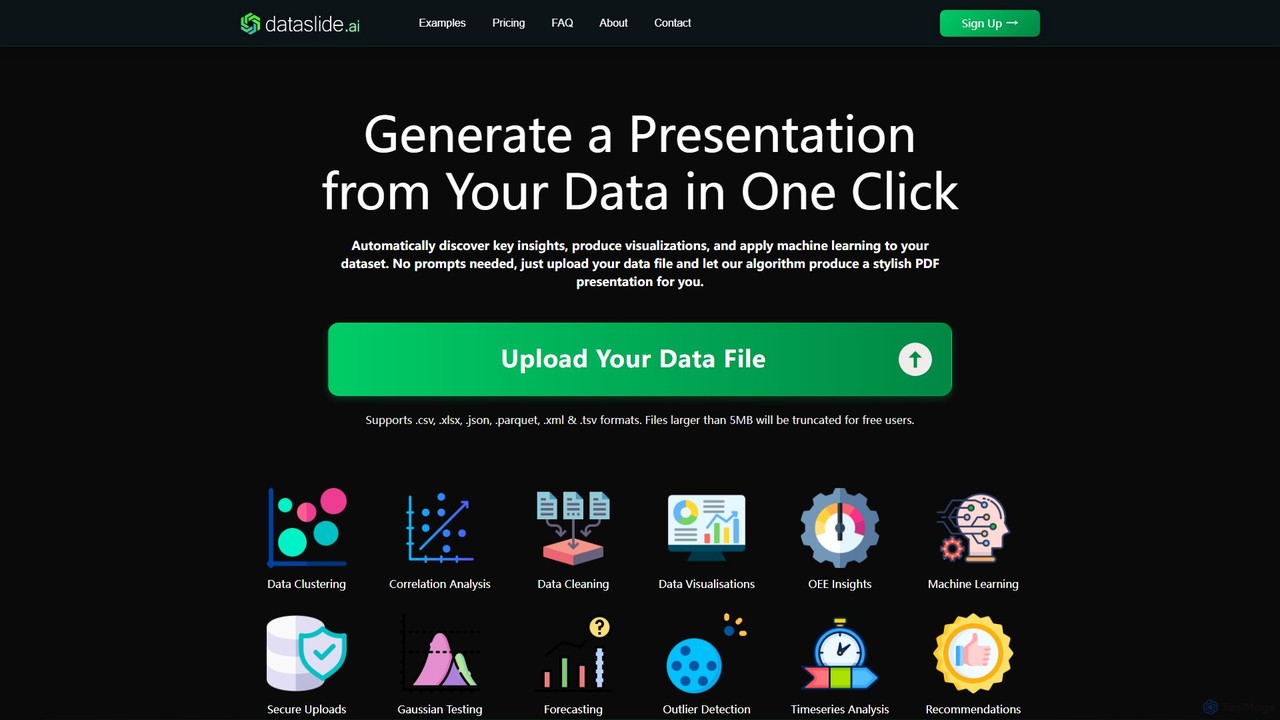
Dataslide.ai is an AI-powered tool that automatically generates insightful presentations from your data in a single click. Simply …
Dataslide.ai is an AI-powered tool that automatically generates insightful presentations from your data in a single click. Simply upload your data file (.csv, .xlsx, etc.), and it performs data cleaning, visualization, and machine learning to produce a comprehensive PDF or PowerPoint report, saving hours of manual analysis.
Rollstack
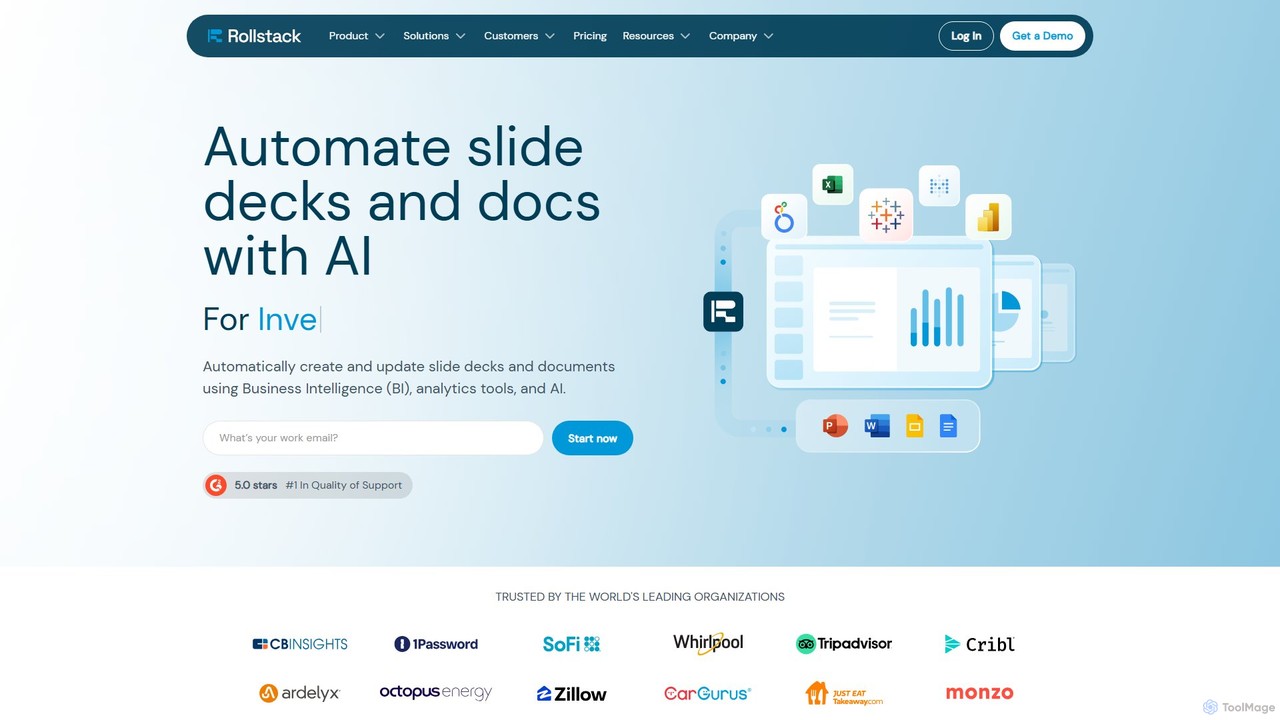
Rollstack is an automation platform that connects your business intelligence tools (like Tableau, Power BI, Looker) and data …
Rollstack is an automation platform that connects your business intelligence tools (like Tableau, Power BI, Looker) and data warehouses (Snowflake) directly to PowerPoint and Google Slides. It eliminates manual data entry and screenshotting, allowing teams to create and update data-driven presentations automatically. This saves significant time, reduces errors, and ensures reports are always based on the latest data.
Two Minute Reports
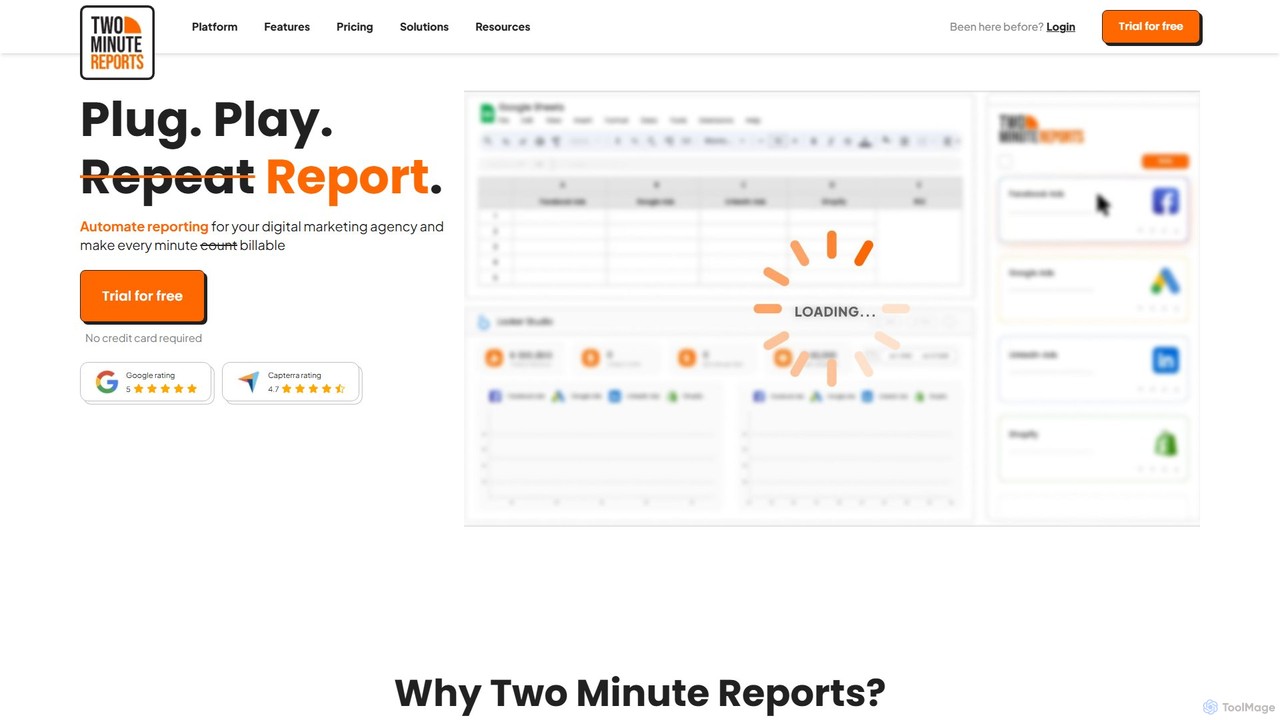
Two Minute Reports is an automated reporting tool for marketing agencies and teams. It integrates with Google Sheets …
Two Minute Reports is an automated reporting tool for marketing agencies and teams. It integrates with Google Sheets and Looker Studio to create professional, white-labeled, multi-channel performance reports in minutes. Automate data collection, blend insights from 30+ platforms, and save hours on client reporting.
aigraphmaker
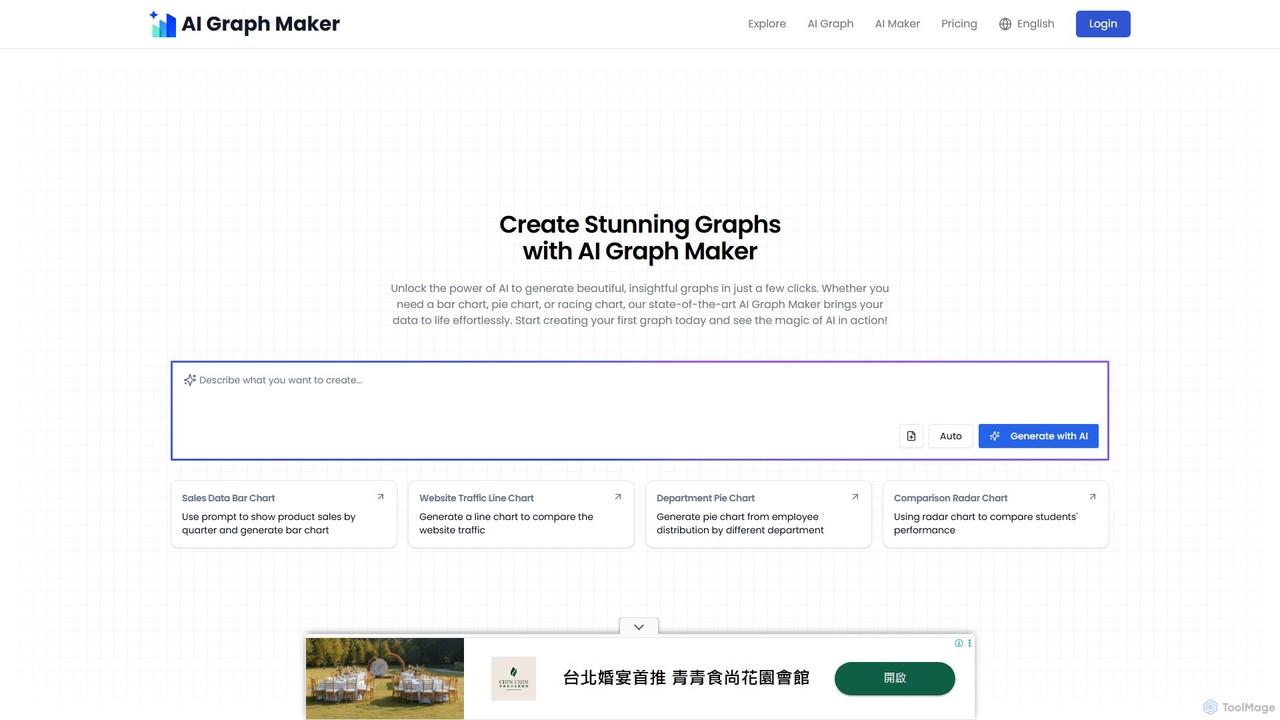
aigraphmaker is an AI-powered platform that transforms raw data and text prompts into a wide variety of professional …
aigraphmaker is an AI-powered platform that transforms raw data and text prompts into a wide variety of professional and interactive charts and diagrams. It enables users, from beginners to experts, to effortlessly create stunning visualizations like bar charts, mind maps, flowcharts, and knowledge graphs in seconds, without any coding or design skills required.
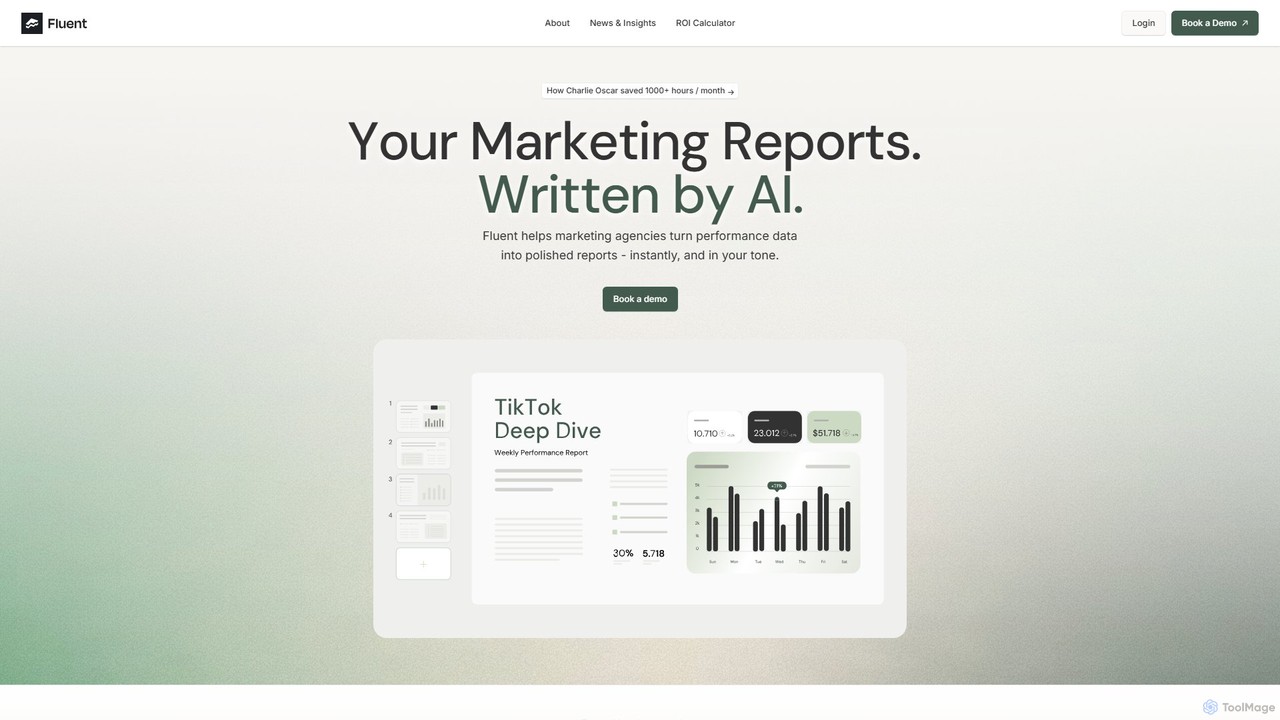
Fluent
Fluent is an AI-powered platform designed for marketing agencies to automate client reporting. It transforms performance data from …
Fluent is an AI-powered platform designed for marketing agencies to automate client reporting. It transforms performance data from various sources into polished, on-brand narrative reports instantly, saving significant time and enhancing report quality.
About Reporting
AI Reporting tools are a specialized category of marketing software that automates the analysis and interpretation of performance data. They leverage machine learning and natural language generation (NLG) to transform complex datasets from various marketing channels into easy-to-understand written summaries, insights, and visualizations. This enables marketing teams to quickly identify trends, measure campaign ROI, and make data-driven decisions without extensive manual analysis. These tools effectively act as an automated data analyst, translating numbers into actionable narratives.
Core Features
- Automated Data Integration: Connects seamlessly with platforms like Google Analytics, social media, and ad networks to centralize data.
- Natural Language Generation (NLG): Automatically writes human-like text summaries explaining data trends and charts.
- Anomaly Detection: Proactively identifies and alerts users to significant, unexpected changes in key metrics.
- Predictive Forecasting: Uses historical data to project future performance and potential campaign outcomes.
- Cross-Channel Analysis: Consolidates data from multiple sources into a single, unified performance view.
Use Cases
These tools are ideal for marketing agencies managing multiple client accounts, in-house marketing teams tracking campaign effectiveness, and e-commerce managers monitoring sales and advertising performance. They streamline the process of creating weekly, monthly, or quarterly performance reviews, freeing up time for strategic planning.
How to Choose
When selecting an AI Reporting tool, evaluate the range of available data source integrations, the quality and customizability of the generated narratives (NLG), the sophistication of its analytical features like anomaly detection, and its ability to create custom dashboards that align with your specific KPIs.
ReportingUse Cases
Automating Client Reports for Marketing Agencies
A digital marketing agency manages over 20 clients, each requiring a detailed monthly performance report. An account manager uses an AI Reporting tool to connect to each client's Google Ads, Facebook Ads, and Google Analytics accounts. The tool automatically pulls data, generates charts, and writes narrative summaries highlighting key wins, areas for improvement, and month-over-month trends. This reduces the report creation time from 3 days to just a few hours, ensuring consistent, high-quality, and insightful reports for every client.
Cross-Channel E-commerce Performance Analysis
An e-commerce manager needs a holistic view of their marketing efforts across Shopify, Google Shopping, and Instagram. Instead of manually compiling spreadsheets, they use an AI Reporting tool to integrate these data sources. The tool generates a unified dashboard that visualizes the entire customer journey, from ad click to final purchase. Its AI-driven insights automatically identify the most profitable channels and highlight campaigns with a declining return on ad spend (ROAS), enabling quick and informed budget allocation decisions.
Internal Marketing Performance Review for Leadership
A Chief Marketing Officer (CMO) needs to present a quarterly performance summary to the executive board. Using an AI Reporting tool, the marketing team creates a high-level dashboard focusing on key KPIs like Customer Acquisition Cost (CAC), Lifetime Value (LTV), and Marketing Qualified Leads (MQLs). The tool's NLG feature generates a concise executive summary in plain language, explaining the key drivers behind the results. This saves the CMO from manually interpreting charts and allows for a more strategic, narrative-driven presentation to leadership.
Proactive Anomaly Detection in Ad Campaigns
A performance marketer is running multiple campaigns on Google and Facebook. An AI Reporting tool continuously monitors key metrics like Cost Per Click (CPC) and Conversion Rate. The system's anomaly detection feature automatically flags a sudden, unexpected spike in CPC for a specific ad set. The marketer receives an immediate alert, investigates the issue (e.g., new competitor bidding), and pauses the underperforming ad set before it wastes a significant portion of the budget. This proactive monitoring prevents budget waste and improves overall campaign efficiency.
Summarizing Social Media Campaign Performance
A social media manager for a consumer brand needs to report on the success of a recent product launch campaign across Instagram, TikTok, and Twitter. They use an AI Reporting tool to aggregate engagement metrics (likes, shares, comments) and reach data from all platforms. The tool's AI generates a summary that not only presents the total numbers but also identifies which platform drove the most engagement and which creative assets resonated best with the audience. This provides clear, actionable feedback for future social media strategies.
Forecasting Marketing Budget and Performance
During annual planning, a marketing director needs to forecast next year's lead generation based on different budget scenarios. They input historical campaign data into an AI Reporting tool. The tool's predictive analytics model projects the number of leads that can be generated at various spending levels for different channels. This data-driven forecast allows the director to build a more accurate and defensible budget proposal, showing leadership the expected return on investment for their requested marketing spend.