
Rollstack Overview
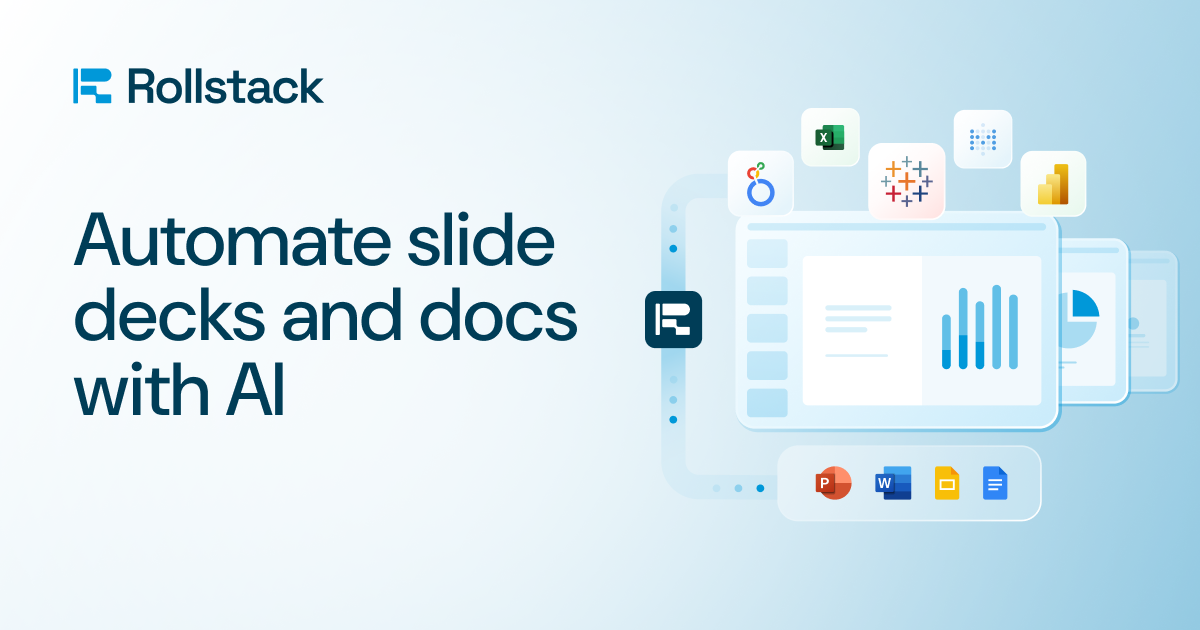
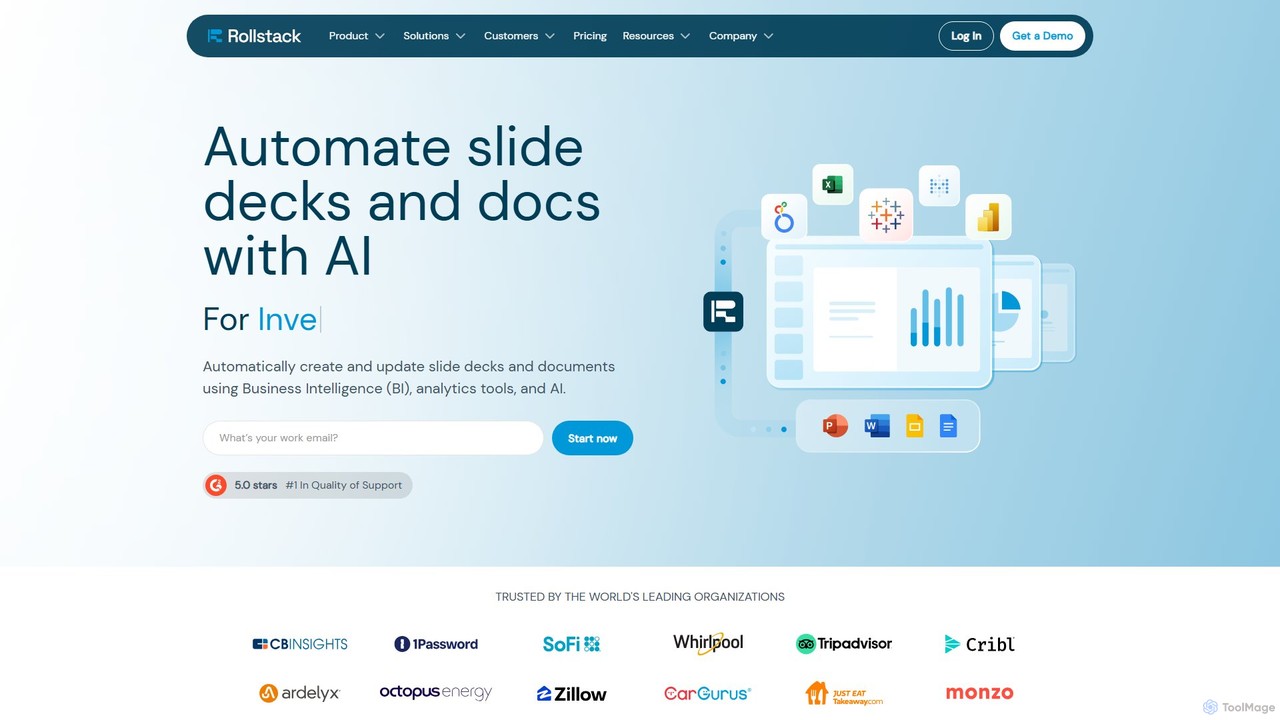
Rollstack is a powerful automation platform designed to streamline the creation of presentations and documents for data-driven organizations. It addresses a common and significant pain point for analytics, business intelligence, and finance teams: the manual, repetitive, and error-prone process of updating recurring reports. By creating a direct link between primary data sources and presentation files, Rollstack transforms static, time-consuming reporting into a dynamic, efficient, and scalable workflow.
The platform integrates seamlessly with the most popular business intelligence tools and data platforms, acting as a central hub for report automation. Instead of taking screenshots or manually copying and pasting data from dashboards, users can connect their data sources once and let Rollstack handle the rest. This ensures that every presentation, from weekly performance reviews to quarterly business reviews (QBRs), is always populated with the most current and accurate information, directly from the source of truth.
How to use Rollstack
Using Rollstack is a straightforward process designed for efficiency:
- Connect Your Data Sources: Begin by securely connecting your business intelligence tools (Tableau, Power BI, Looker), data warehouses (Snowflake, dbt), or spreadsheets (Google Sheets, Excel) to the Rollstack platform.
- Create or Upload a Template: Use your existing PowerPoint or Google Slides templates. Rollstack works with your established branding and layouts.
- Link Data to Placeholders: Within your template, define placeholders for charts, tables, and key metrics. Then, link these placeholders to the corresponding live data from your connected sources. This mapping only needs to be done once.
- Automate and Schedule: Set up schedules for your reports to refresh automatically—daily, weekly, or monthly. You can also trigger updates on-demand. The platform will pull the latest data and generate an updated presentation.
- Distribute Seamlessly: Configure automated distribution lists to send the updated decks to relevant stakeholders via email or other channels, ensuring timely delivery of insights.
Core Features of Rollstack
- Direct Data Integration: Connects directly to Tableau, Power BI, Looker, Snowflake, dbt, Hightouch, Census, Google Sheets, and Excel.
- Presentation Automation: Automates the population of data, charts, and tables in PowerPoint and Google Slides.
- Scheduled Refreshes: Allows users to schedule report updates to align with business cadences, ensuring timely information.
- AI-Powered Narratives: Leverages AI to generate executive summaries, highlight key insights, and flag anomalies based on the live data within the slides.
- Slide Governance: Provides version control and clear permissions for report templates, ensuring consistency and accuracy across the organization.
- Scalable Reporting: Enables the creation of hundreds of customized report variations from a single template, perfect for client or regional reporting.
- Secure and Compliant: Built with enterprise-grade security to ensure data is handled safely and complies with standards like GDPR and SOC 2.
Use Cases for Rollstack
Rollstack is ideal for any recurring reporting process that involves data from multiple sources. Leading companies like SoFi, Recurly, and Just Eat Takeaway use it for:
- Quarterly Business Reviews (QBRs): Automate the entire process of compiling performance data, saving hundreds of hours per quarter.
- Financial Reporting: Ensure accuracy and timeliness in monthly and quarterly financial decks for executives and investors.
- Operational Dashboards: Keep operational teams updated with daily or weekly performance metrics without manual intervention.
- Client Reporting: Generate personalized reports for multiple clients at scale, pulling data specific to each client into a standardized template.
- Marketing and Sales Performance: Automatically update weekly reports on campaign performance, lead generation, and sales pipelines.
Advantages of Rollstack
The primary advantage of Rollstack is a massive increase in operational efficiency. As highlighted by SoFi's Strategic Finance Director, it can reduce slide preparation time from hours to minutes. Key benefits include:
- Time Savings: Frees up highly skilled analysts and BI professionals from mundane, repetitive tasks to focus on strategic analysis.
- Improved Data Accuracy: Eliminates human error from manual copy-pasting, ensuring decisions are based on reliable data.
- Faster Time to Insight: Reduces decision latency by delivering up-to-date reports to stakeholders automatically and on schedule.
- Enhanced Governance: Maintains a single source of truth and ensures all reports are consistent and on-brand.
- Increased Productivity: Streamlines workflows across multiple departments, from finance and operations to marketing and sales.
Pricing and Plans
Rollstack's pricing is tailored to the needs of teams and enterprises. Given its focus on integration with complex data systems and enterprise-level automation, it typically offers customized plans. For detailed pricing information and to understand which plan best fits your organization's needs, it is recommended to book a demo or contact the Rollstack sales team directly through their website.
Traffic
Latest traffic
Status
Monthly traffic trend
- 2025-9: 19.8K
- 2026-1: 20.2K
- 2026-2: 19.6K
- 2026-3: 20.8K
- 2026-4: 18.9K
- 2026-5: 17.4K
Geography
Top 5 countries / regions
- 🇺🇸United States51.3%
- 🇮🇳India17.7%
- 🇩🇪Germany11.8%
- 🇮🇩Indonesia10.4%
- 🇧🇷Brazil8.8%
Top keywords
| Keyword | Cost per click |
|---|---|
| graphs in excel powerpoint | $0.00 |
| how to recreate a chart in powerpoint when the source file moved | $0.00 |
| imbedding a workable excel spreadheet in power point | $0.00 |
| rollstack | $6.00 |
| tableau conference 2026 | $5.96 |
Rollstack Alternatives
Graphy
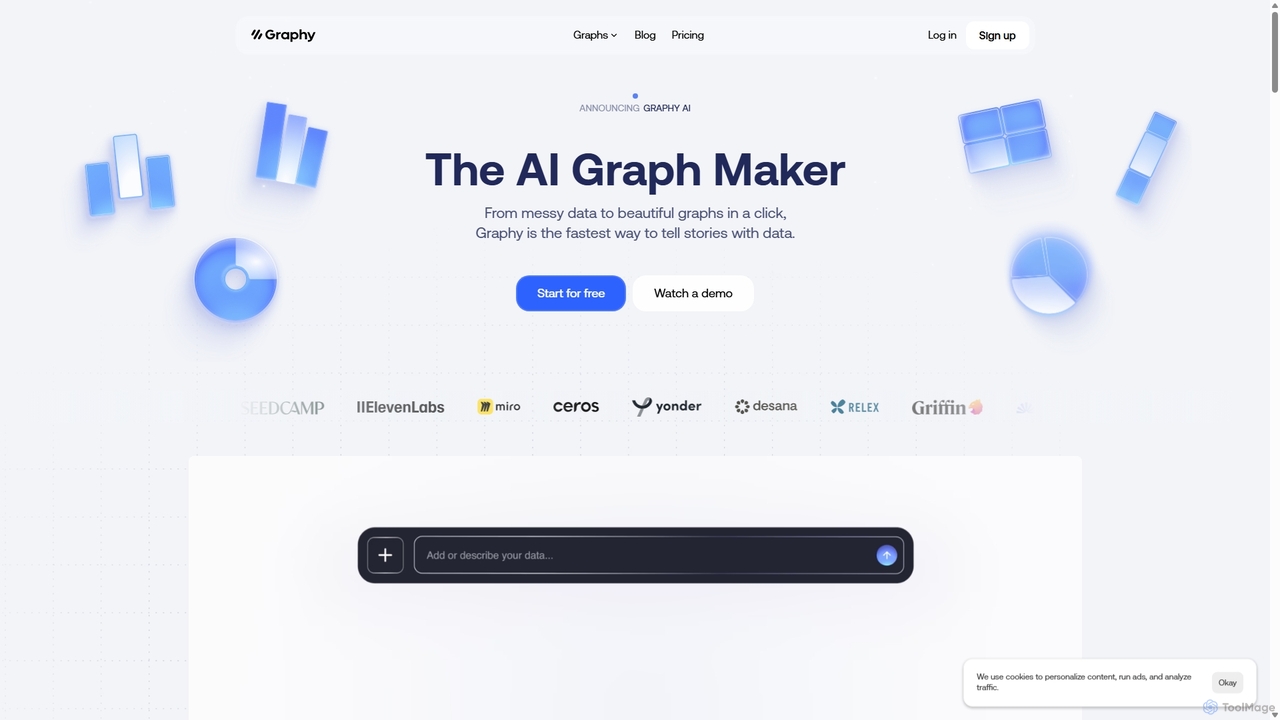
Graphy is an AI-powered data visualization tool that transforms raw data into beautiful, interactive charts and graphs in seconds. It simplifies data storytelling by automatically identifying key insights, allowing users to chat with their data, and offering extensive customization. Ideal for marketers, analysts, and teams who need to create compelling visual reports and presentations without complex software.
3D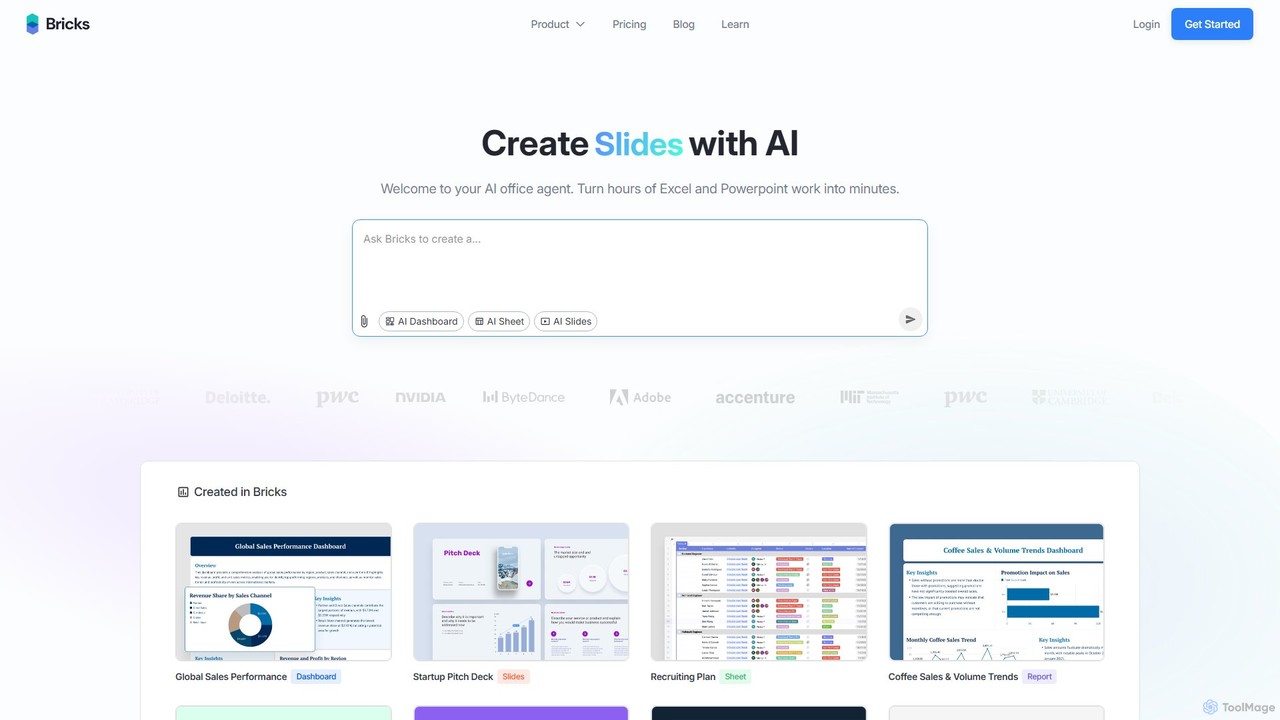
thebricks
thebricks is an AI-powered workspace that transforms data analysis and reporting. It allows users to create interactive dashboards, dynamic spreadsheets, and professional slides using simple natural language prompts. Turn hours of manual work in Excel and PowerPoint into minutes, streamlining your workflow and boosting productivity.
Business Intelligence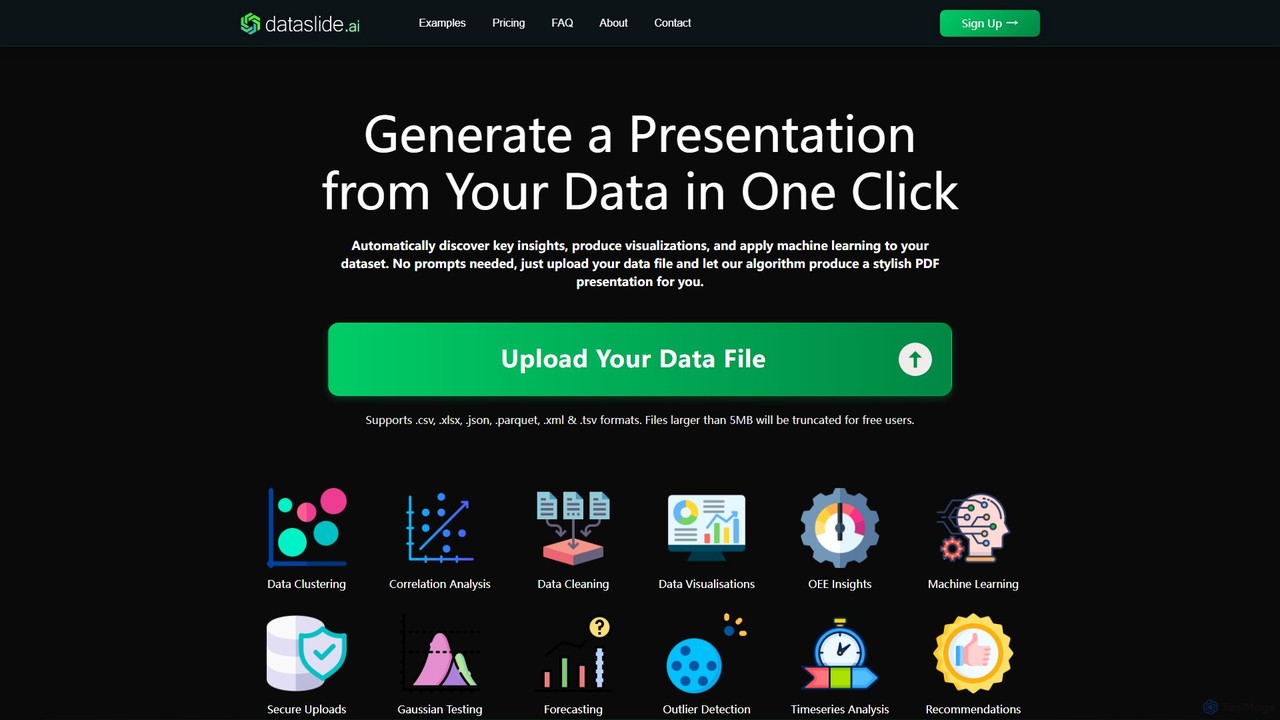
Dataslide.ai
Dataslide.ai is an AI-powered tool that automatically generates insightful presentations from your data in a single click. Simply upload your data file (.csv, .xlsx, etc.), and it performs data cleaning, visualization, and machine learning to produce a comprehensive PDF or PowerPoint report, saving hours of manual analysis.
Business Intelligence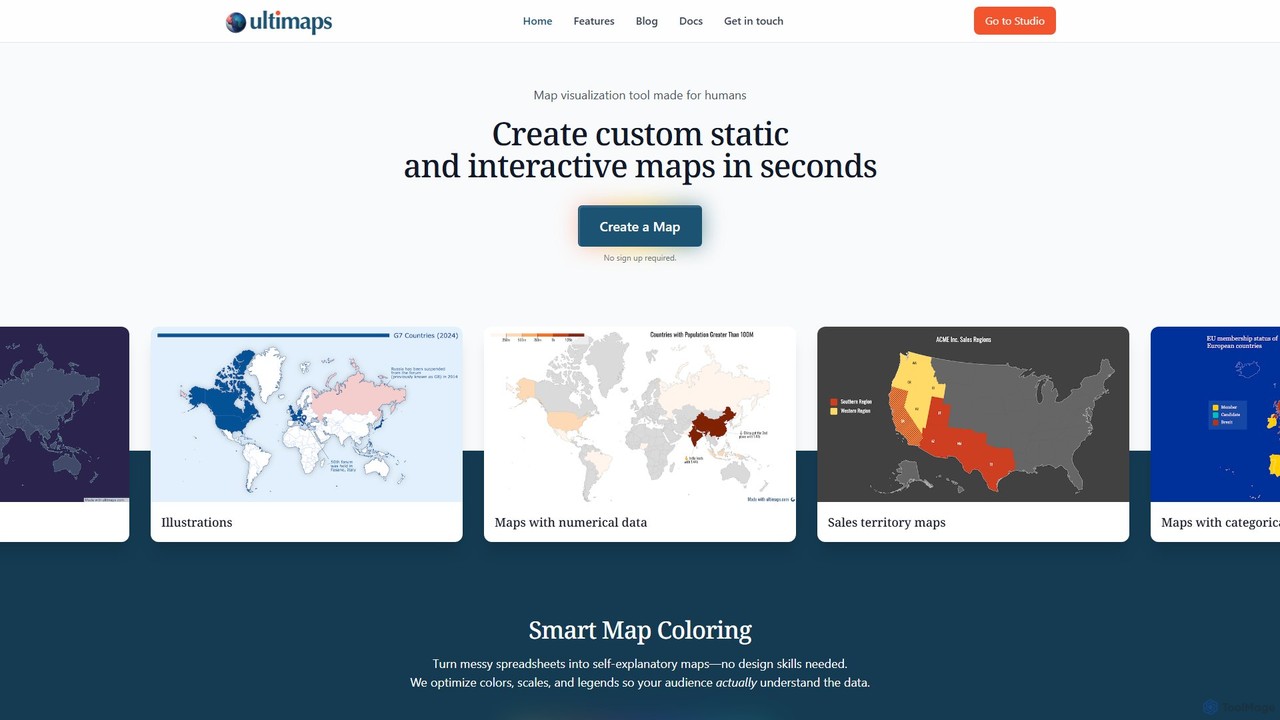
Ultimaps
Ultimaps is an AI-powered map visualization tool that allows anyone to create stunning static and interactive maps in seconds. Import data from spreadsheets, use AI prompts, or color manually. It automatically optimizes colors, scales, and legends to turn complex data into clear, presentation-ready visuals without needing design skills.
Business Intelligence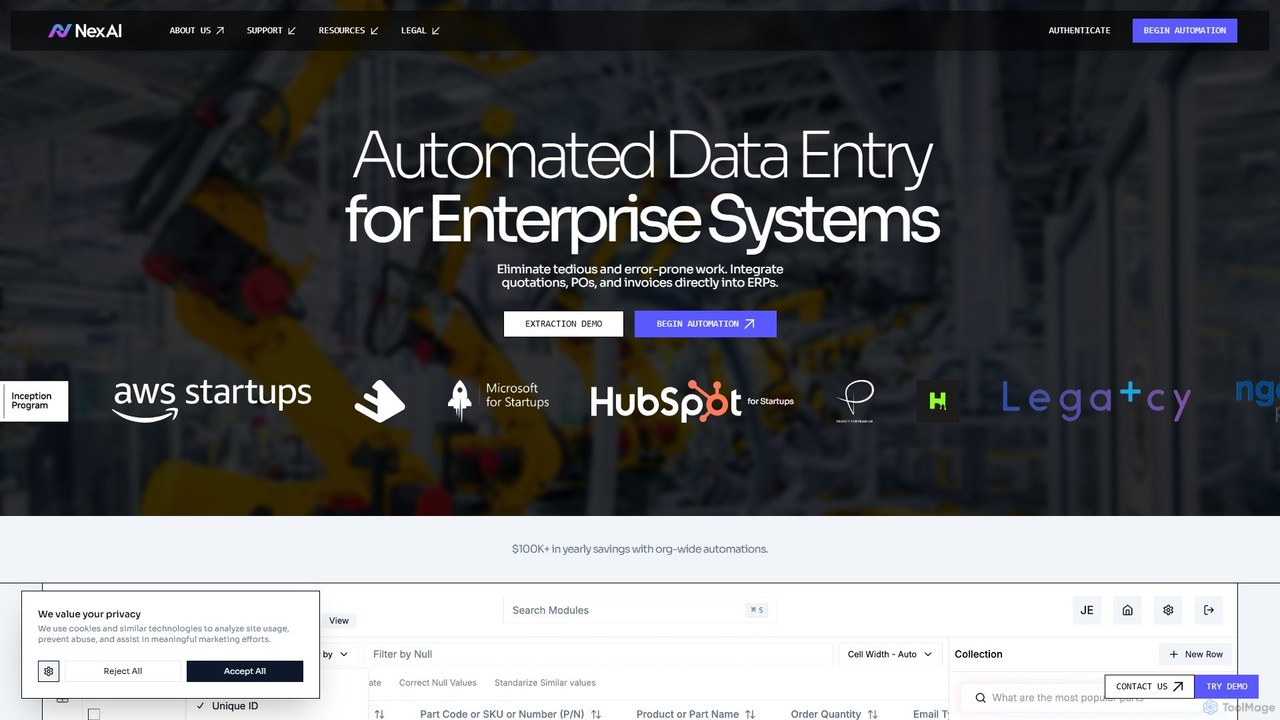
Nex AI
Nex AI is an enterprise-grade AI platform that automates data entry by extracting information from documents like quotations, POs, and invoices, and integrating it directly into ERP systems. It's designed for industries like manufacturing, healthcare, and education to eliminate manual work, reduce errors, and enhance operational efficiency.
Business IntelligenceRollstack Categories
Rollstack Embed Widget
Copy this embed code to place the badge on your blog, article, or product site and send readers directly to this ToolMage detail page.

Related AI tools
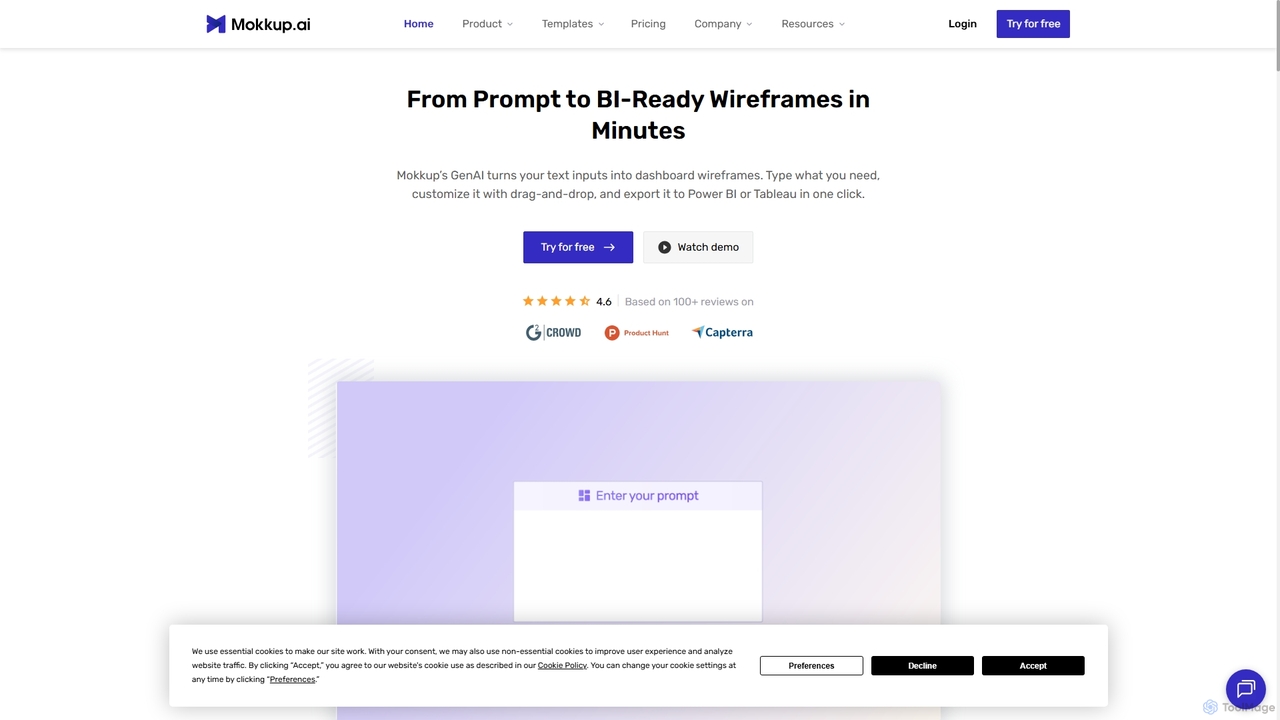
Mokkup
Mokkup is an AI-powered dashboard wireframing tool that transforms text prompts into high-fidelity, BI-ready mockups in minutes. Designed for data analysts and BI developers, it simplifies the design process with a drag-and-drop editor, real-time collaboration, and one-click export to Power BI and Tableau, accelerating the entire business intelligence workflow.
Visualization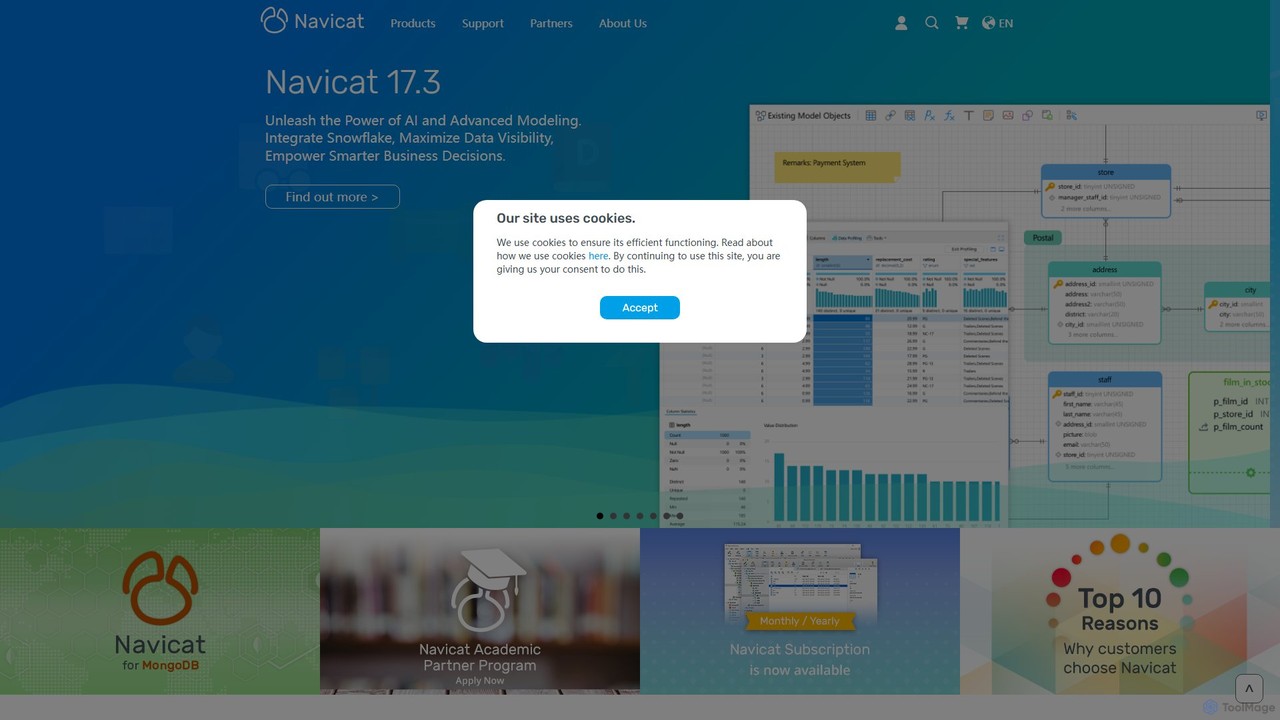
Navicat
Navicat is a comprehensive database management and development tool with integrated AI features. It provides a user-friendly GUI for managing a wide range of databases like MySQL, PostgreSQL, MongoDB, and Snowflake. It boosts productivity with an AI Assistant for query generation, advanced data modeling, BI visualization, and seamless cloud collaboration, making it a top choice for developers, DBAs, and data analysts.
Business Intelligence
Jyek
Jyek is an AI agent platform that understands objectives, creates execution plans, uses tools, and delivers verifiable results for complex, multi-step tasks.
Automation
Fabi.ai
Fabi.ai is an AI-powered business intelligence and data analysis platform designed for lean teams. It integrates SQL, Python, and AI to help users build dashboards, automate workflows, and explore data 10x faster. The platform offers an all-in-one collaborative environment, reducing context switching and enabling both technical and non-technical users to derive insights from their data sources like data warehouses, Google Sheets, and more.
Business Intelligence
Seek AI
Seek AI is a generative AI platform for data analytics that empowers users to query databases, generate reports, and create visualizations using natural language. It automates the text-to-SQL process, making data accessible to non-technical users and accelerating insights for data teams.
Business Intelligence
Qquest
Qquest is an AI-powered data assistant that enables teams to get instant insights from their company data using natural language. It allows data leaders to build a custom AI analyst and business users to query databases without any coding knowledge, directly from a Chrome extension.
Business Intelligence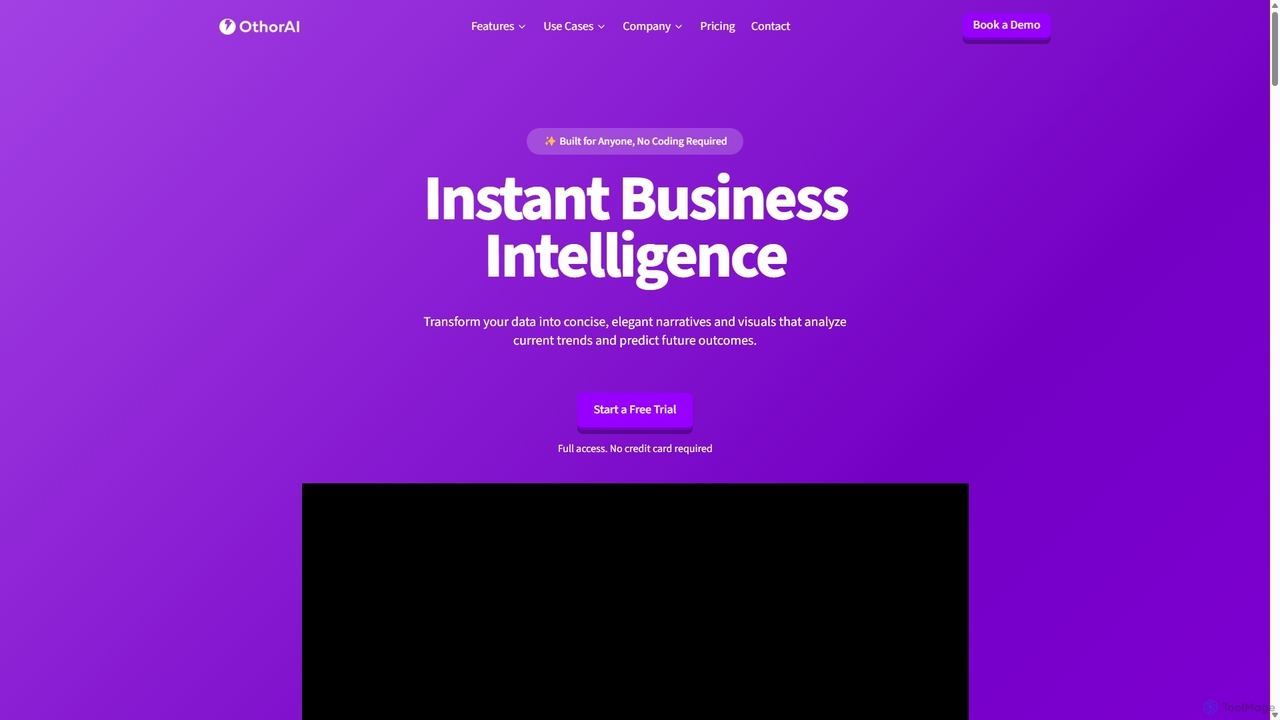
Othor AI
Othor AI is a no-code business intelligence platform that transforms your data into actionable insights in seconds. It automatically generates narrative-driven reports, smart charts, and predictive analytics, enabling anyone in your organization to make faster, data-driven decisions without technical expertise. Connect your data sources and get instant dashboards and executive summaries.
Business Intelligence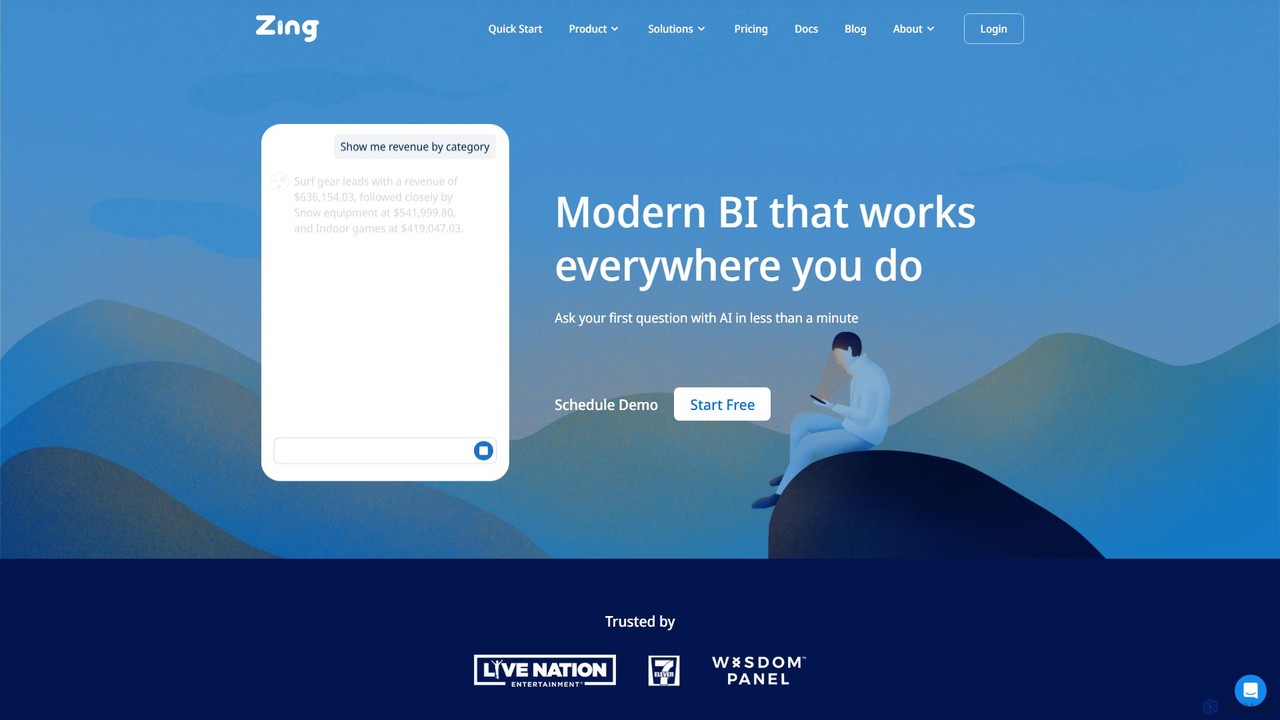
Zing Data
Zing Data is a GenAI-powered business intelligence (BI) platform that enables users to query data using natural language. It works across web and mobile, connecting to various data sources to create interactive visualizations and real-time alerts without complex data modeling, making data analysis accessible to everyone.
Business Intelligence
Viewit Ai Chatbot
An AI-powered chatbot that transforms your data into insightful visualizations and summaries through simple, natural language conversations. Upload your dataset, ask questions, and instantly receive charts, graphs, and key metrics, making data analysis accessible to everyone without needing complex software or coding skills.
Business IntelligenceGraphy
Graphy is an AI-powered data visualization tool that transforms raw data into beautiful, interactive charts and graphs in seconds. It simplifies data storytelling by automatically identifying key insights, allowing users to chat with their data, and offering extensive customization. Ideal for marketers, analysts, and teams who need to create compelling visual reports and presentations without complex software.
3D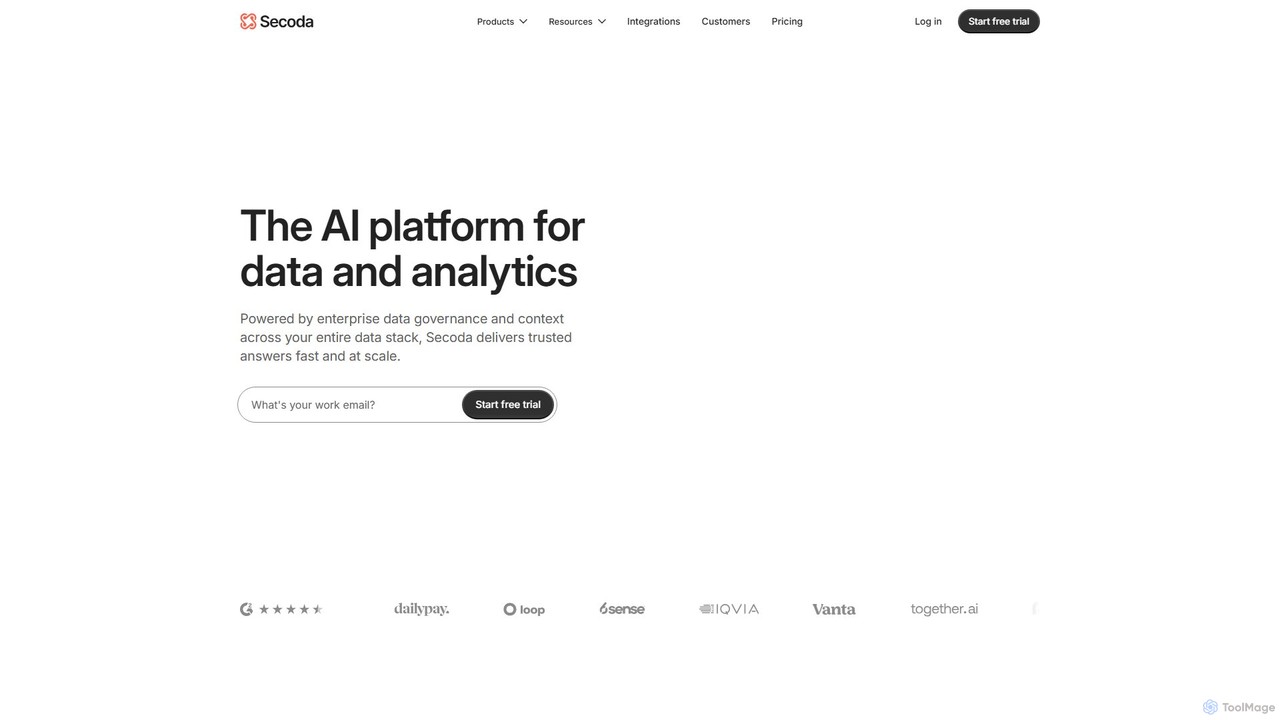
Secoda
Secoda is an AI-powered data platform that unifies data discovery, lineage, cataloging, and governance. It helps teams find, understand, and trust their data through an intelligent, centralized hub, enabling self-service analytics and scalable AI infrastructure.
Analytics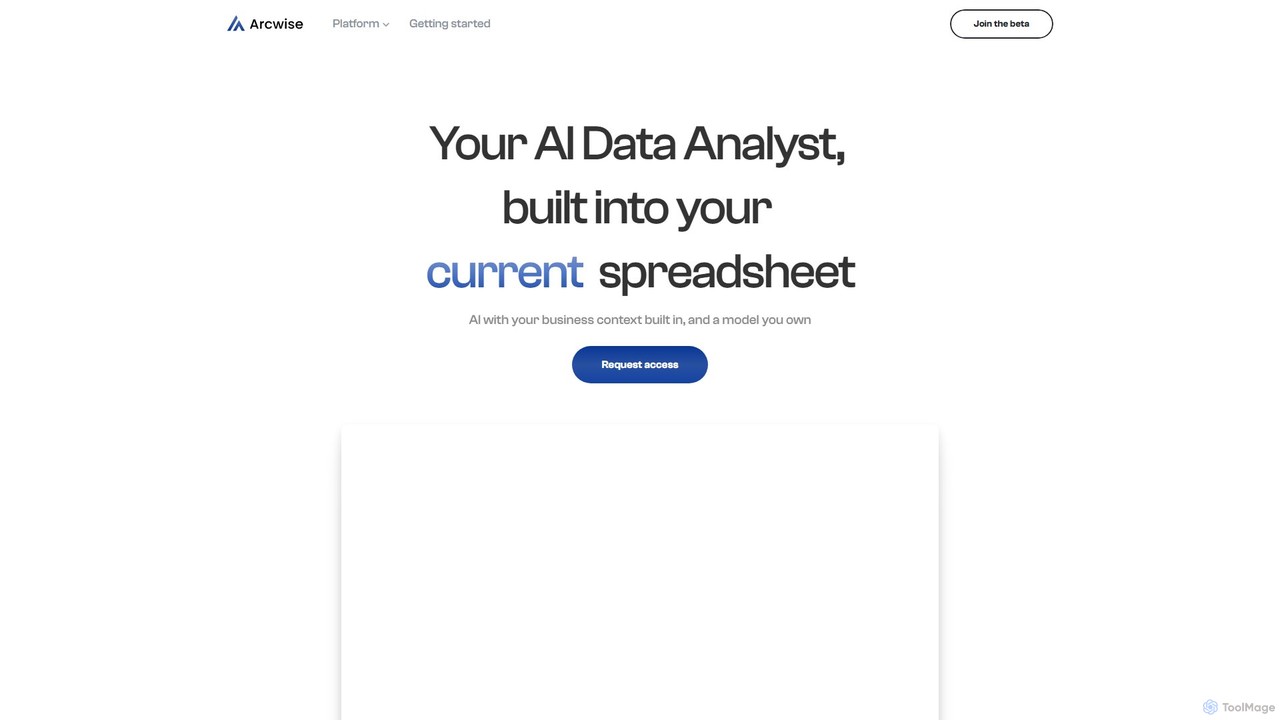
Arcwise
Arcwise is an AI copilot for Google Sheets that supercharges your spreadsheet workflows. It connects directly to your data warehouses and BI tools, allowing you to query, analyze, and visualize complex data using natural language, all within the familiar spreadsheet environment.
Business Intelligence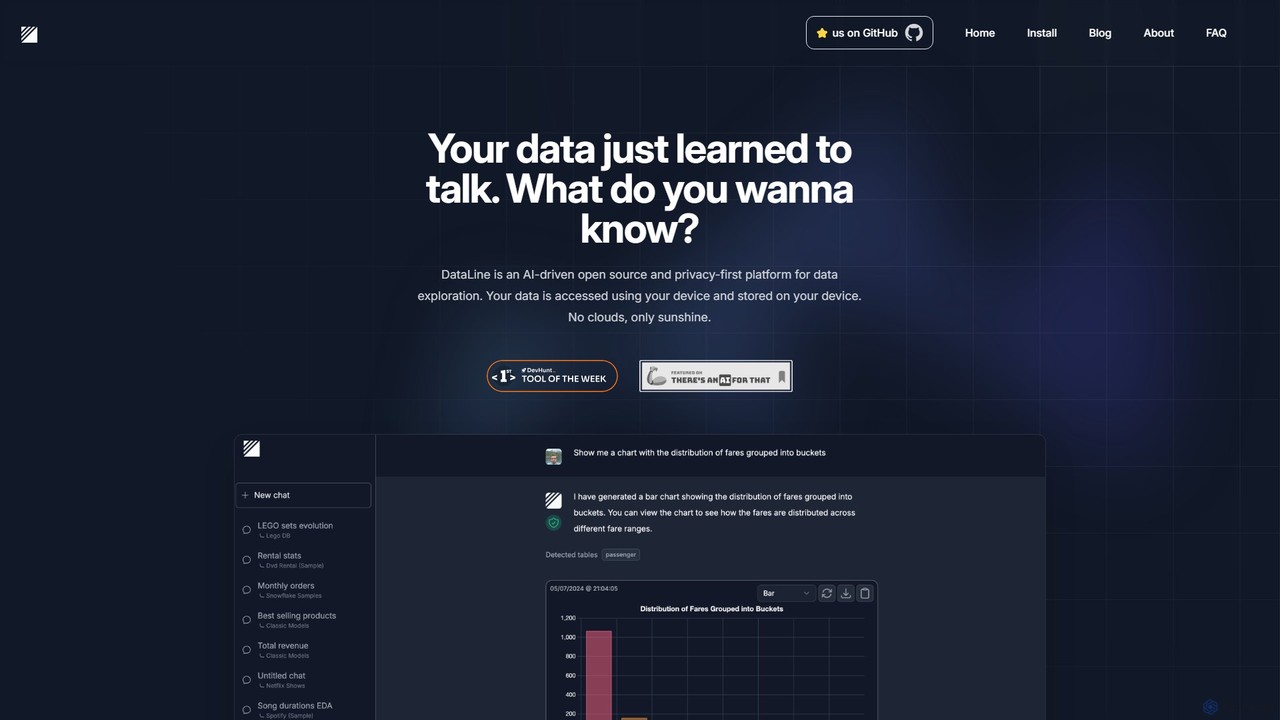
DataLine
DataLine is an open-source, privacy-first AI platform that allows you to explore your data through natural language. Securely connect to your databases and files, ask questions, and get instant insights and visualizations without your data ever leaving your machine.
Analytics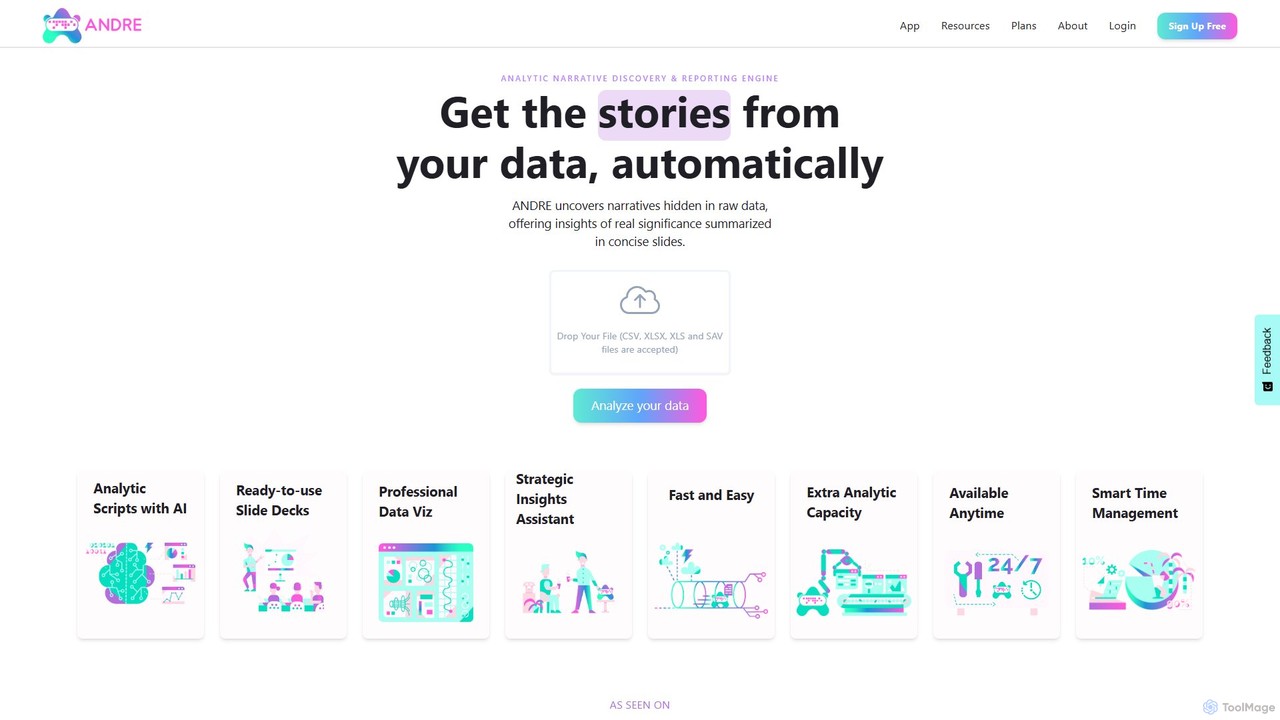
ANDRE
ANDRE is an AI-powered data analyst that transforms raw survey and business data into actionable insights and presentation-ready reports. It automates the process of discovering hidden narratives, generating data visualizations, and summarizing key conclusions. Designed for market researchers, CX managers, and business analysts, ANDRE significantly reduces analysis time, making expert-level data storytelling accessible to everyone.
Business Intelligence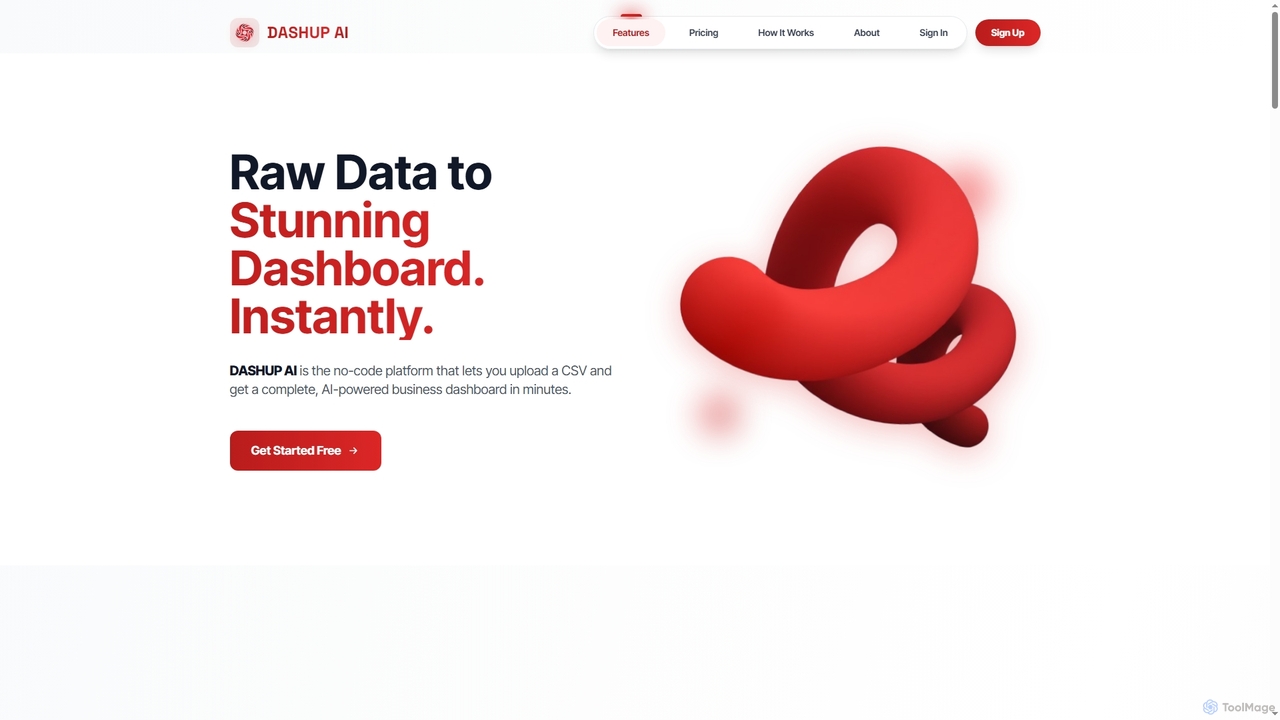
Dashup
Dashup is a no-code AI platform that instantly transforms raw CSV data into stunning, interactive business dashboards. Simply upload your file, choose a template, and let the AI suggest key metrics and visualizations. No SQL or technical skills required. Go from spreadsheet to actionable insights in minutes, making data-driven decisions faster and easier.
Business Intelligence
Rollstack Comments (0)
Sign in to comment.
Sign inNo comments yet.