Ultimaps
Visit Website
Ultimaps Overview
Ultimaps is a powerful and intuitive map visualization tool designed for everyone, from data analysts to marketers and educators. It simplifies the process of creating beautiful, data-driven static and interactive maps, transforming complex spreadsheets and datasets into clear, compelling visuals in just seconds. With a focus on user experience, Ultimaps eliminates the need for specialized design or GIS skills, making professional-grade cartography accessible to all.
The platform's core strength lies in its intelligent automation. Whether you're importing data or using a natural language prompt, Ultimaps' AI engine gets to work. It analyzes your data, cleans up inconsistencies (like recognizing 'NY', 'New York', and 'Nueva York' as the same place), selects the optimal color palette (sequential, diverging, etc.), and intelligently calculates scales and breaks to best represent your information. This ensures your map is not only aesthetically pleasing but also accurate and easy to understand for your audience.
How to use Ultimaps
Creating a map with Ultimaps is a straightforward, user-friendly process:
- Start Instantly: Navigate to the Ultimaps Studio. You can begin creating immediately without needing to sign up.
- Choose Your Map: Select a base map for your visualization, such as a world map, a specific country, or a regional map.
- Import Your Data: Ultimaps offers multiple ways to add data. You can upload Excel or CSV files, connect to Google Spreadsheets or Notion tables, or simply paste your data.
- Use the AI Prompt: For ultimate simplicity, write a prompt describing your data and desired visualization. For example: "Using an orange palette, color US states based on this sales data..."
- Automatic Visualization: The tool automatically processes your data, applies smart coloring, generates a legend, and formats values correctly (e.g., percentages vs. currency).
- Customize and Refine: While the AI provides a great starting point, you have full control to tweak the design. Fine-tune colors and fonts, add annotations like text, lines, and shapes, place pins to highlight specific locations, or apply pre-made themes for a polished look.
- Create Interactive Elements: Make your map dynamic by adding tooltips and popups that appear on hover or click, displaying additional information from your dataset. This can be done without writing a single line of code.
- Export and Share: Download your finished map as a high-quality PNG, SVG, or PDF file for reports and presentations. To share an interactive version, publish the map to generate a unique link or get an embed code for your website (this requires a free account).
Core Features of Ultimaps
- AI-Powered Map Generation: Create maps from simple text prompts, letting the AI handle the data interpretation and design.
- Smart Map Coloring: The algorithm automatically analyzes data to select appropriate color palettes and scales (gradients or stepped colors) for maximum clarity.
- Multiple Data Import Options: Supports Excel, CSV, Google Sheets, and Notion tables, providing flexibility for various workflows.
- Inconsistent Data Recognition: Intelligently identifies and standardizes different variations of location names.
- Diverse Map Types: Create Choropleth maps for numerical data, Category maps for distinct groups, and Illustration maps for highlighting regions without data.
- Interactive Elements: Easily add tooltips and popups to provide deeper insights and engage your audience.
- Advanced Customization Suite: A full visual editor to add annotations, pins, custom text, lines, and shapes. Use templates and themes to speed up your workflow.
- Multiple Export Formats: Download maps in presentation-ready formats including PNG, SVG, and PDF.
- Seamless Sharing and Embedding: Publish and share maps with a direct link or embed them on any website, with full responsiveness on all devices.
Use Cases for Ultimaps
Ultimaps is versatile enough for a wide range of professional and personal applications:
- Business & Sales: Visualize sales territories, track regional performance, map out service areas, and present market penetration data to stakeholders.
- Marketing & Analytics: Showcase customer distribution, map campaign reach, or visualize website traffic by geographic location.
- Data Journalism & Reporting: Turn complex datasets on topics like elections, demographics, or public health into easily digestible and shareable visual stories.
- Education & Research: Create maps for academic presentations, illustrate historical events, or visualize scientific data like climate change or disease prevalence.
- Real Estate: Map property listings, highlight neighborhood amenities, or show market value trends across a city.
Advantages of Ultimaps
Ultimaps stands out by being incredibly user-friendly without sacrificing power. Its key advantages include its speed, AI-driven intelligence that automates tedious design tasks, and the flexibility to create both simple illustrations and complex, interactive data visualizations. The generous free tier allows users to access core functionality without any initial investment or commitment, making it a risk-free tool to try.
Pricing and Plans
Ultimaps offers a flexible pricing structure to suit different needs:
- Basic (Free): Includes unlimited maps, export to PNG with attribution, map storage in your account, and the ability to create, share, and embed interactive maps. No sign-up is required to start creating.
- Pro (€49/month): Designed for regular users and professionals. Includes everything in the Free plan, plus high-resolution PNG export without attribution, SVG and PDF export, reusable templates, 5,000 geocoding requests, 500 AI requests per month, and priority support.
- Custom (Contact for pricing): Tailored for large companies and businesses with specific needs. Includes all Pro features, plus private map sharing, inviting users to workspaces, custom themes, and custom interactive logic.
Ultimaps Comments (0)
Log in to post comments
Log in nowUltimapsWebsite Traffic Analysis
Latest Traffic
Status
Monthly Traffic Trend
Geography
Top 5 Countries/Regions
-
🇺🇸 United States72.48%
-
🇮🇳 India16.83%
-
🇬🇧 United Kingdom3.76%
-
🇳🇬 Nigeria3.75%
-
🇨🇦 Canada3.18%
Traffic source
| Source Type | Percentage |
|---|---|
|
Direct Access
|
54.75% |
|
Referral
|
44.44% |
|
Email
|
0.81% |
Popular Keywords
| Keyword | Cost Per Click |
|---|---|
|
$1.12
|
|
|
$1.71
|
|
|
$0.36
|
|
|
$0.00
|
|
|
$0.00
|
Ultimaps Alternatives
View All
Graphy
Graphy is an AI-powered data visualization tool that transforms raw data into beautiful, interactive charts and graphs in …
Graphy is an AI-powered data visualization tool that transforms raw data into beautiful, interactive charts and graphs in seconds. It simplifies data storytelling by automatically identifying key insights, allowing users to chat with their data, and offering extensive customization. Ideal for marketers, analysts, and teams who need to create compelling visual reports and presentations without complex software.
thebricks
thebricks is an AI-powered workspace that transforms data analysis and reporting. It allows users to create interactive dashboards, …
thebricks is an AI-powered workspace that transforms data analysis and reporting. It allows users to create interactive dashboards, dynamic spreadsheets, and professional slides using simple natural language prompts. Turn hours of manual work in Excel and PowerPoint into minutes, streamlining your workflow and boosting productivity.
OWOX BI
OWOX BI is a comprehensive marketing analytics and business intelligence platform designed to consolidate all marketing data into …
OWOX BI is a comprehensive marketing analytics and business intelligence platform designed to consolidate all marketing data into Google BigQuery. It helps businesses build reports, calculate performance metrics, and create data-driven attribution models to optimize advertising spend and improve ROI.
Rollstack
Rollstack is an automation platform that connects your business intelligence tools (like Tableau, Power BI, Looker) and data …
Rollstack is an automation platform that connects your business intelligence tools (like Tableau, Power BI, Looker) and data warehouses (Snowflake) directly to PowerPoint and Google Slides. It eliminates manual data entry and screenshotting, allowing teams to create and update data-driven presentations automatically. This saves significant time, reduces errors, and ensures reports are always based on the latest data.
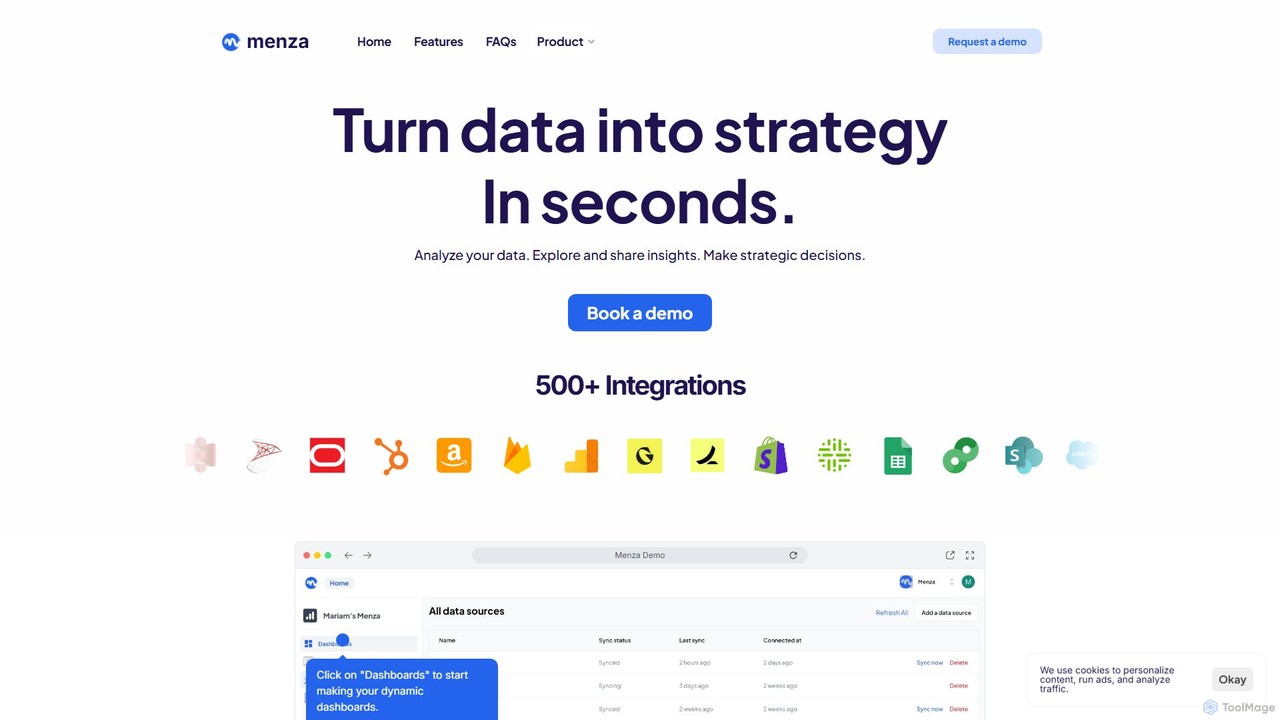
menza
menza is an AI-powered data analysis platform that transforms business data into actionable strategic insights in seconds. It …
menza is an AI-powered data analysis platform that transforms business data into actionable strategic insights in seconds. It allows non-technical users to analyze data, build interactive dashboards, and collaborate on decisions using plain language and a simple interface.
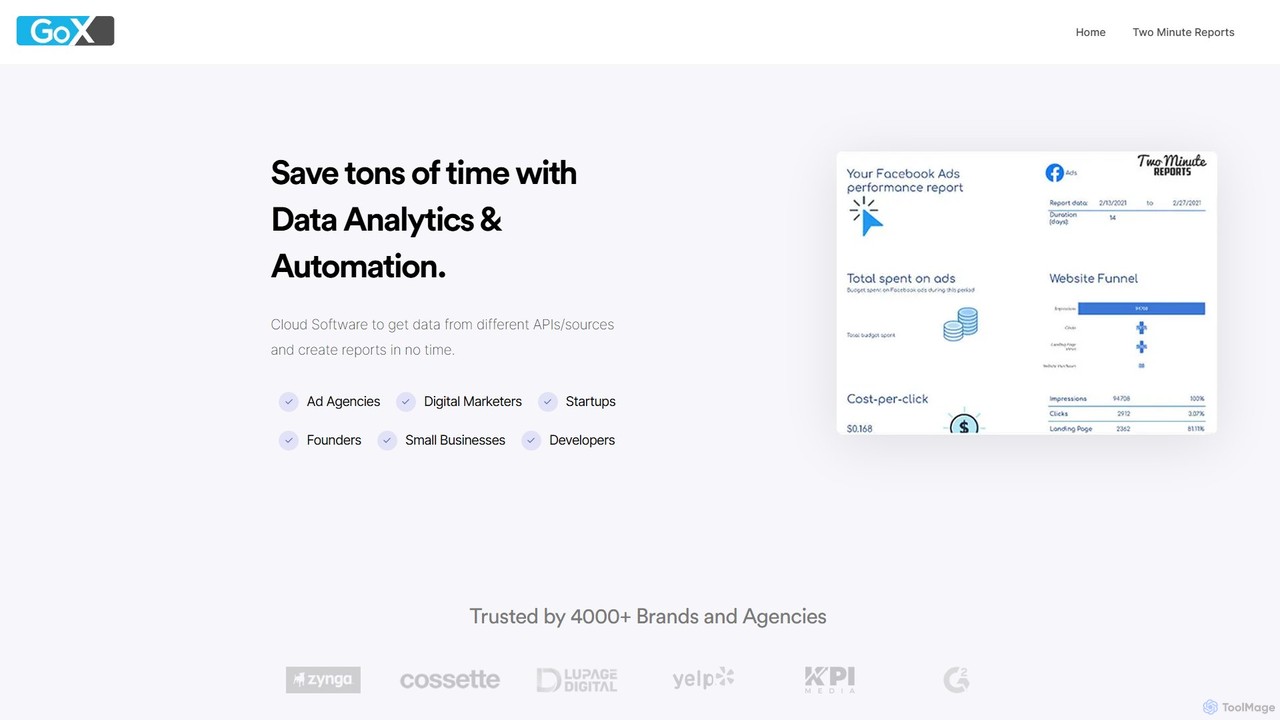
GoX
GoX is a data automation and analytics platform, delivered through its flagship product 'Two Minute Reports'. It helps …
GoX is a data automation and analytics platform, delivered through its flagship product 'Two Minute Reports'. It helps marketers and agencies save time by connecting to various data sources (like Google Ads, Facebook Ads, SEO tools), consolidating data, and automating report generation directly within Google Sheets and Looker Studio. It's a no-code solution for creating beautiful, insightful reports in minutes.
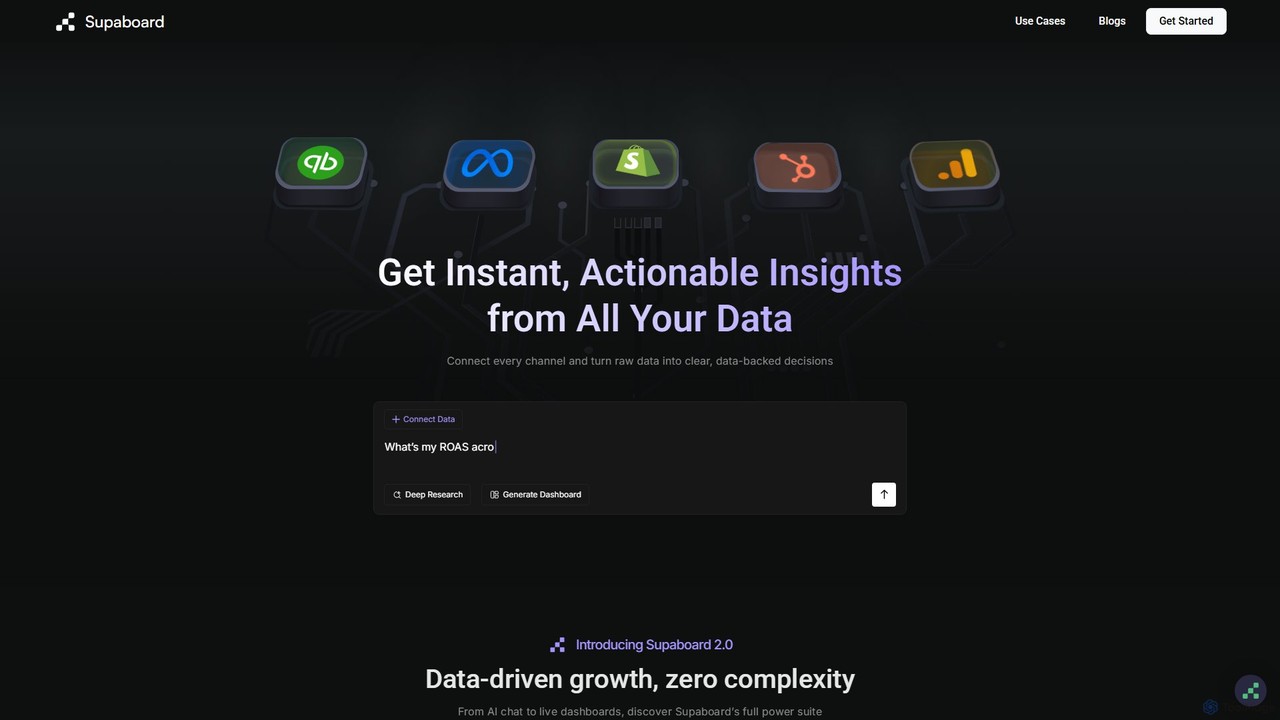
Supaboard
Supaboard is an AI-powered business intelligence platform that connects all your data sources into a unified hub. It …
Supaboard is an AI-powered business intelligence platform that connects all your data sources into a unified hub. It transforms raw data into actionable insights and live dashboards, allowing teams to make data-backed decisions quickly without needing to write code or wrangle spreadsheets.
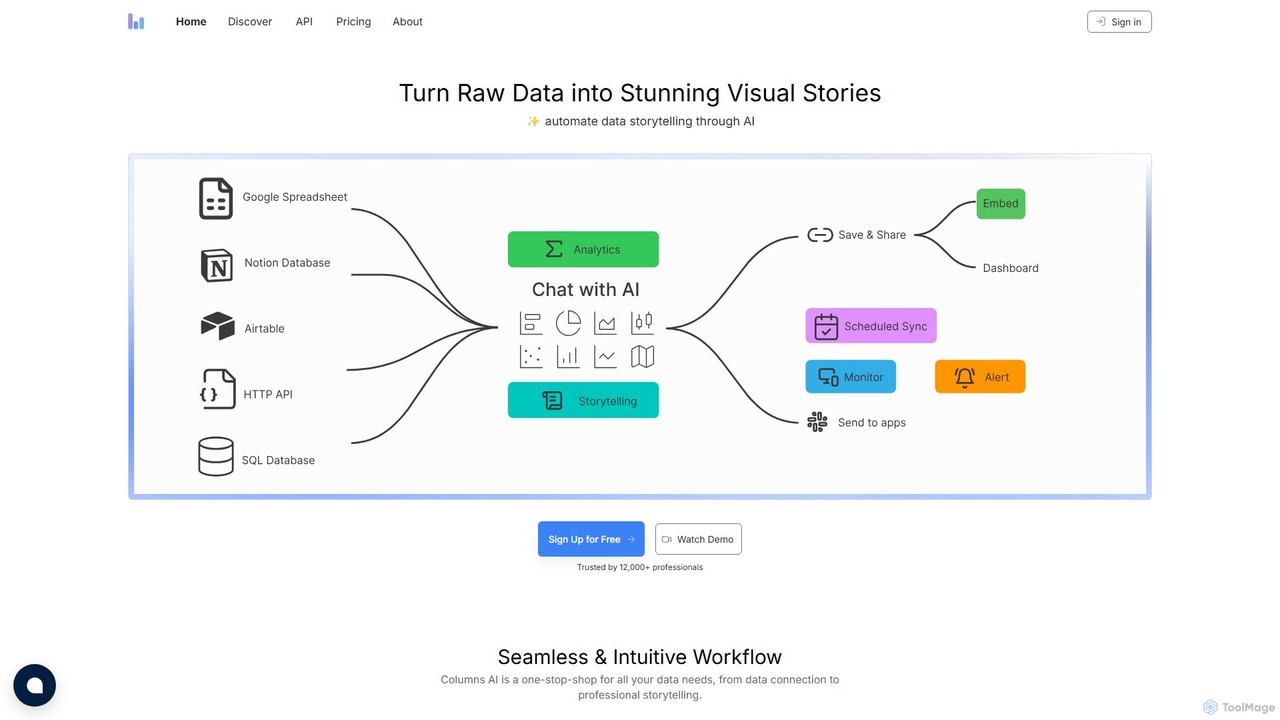
Columns
Columns is an AI-powered data storytelling platform that transforms raw data into stunning visual narratives. Using natural language, …
Columns is an AI-powered data storytelling platform that transforms raw data into stunning visual narratives. Using natural language, users can ask questions, generate insightful charts, and create professional presentations. It connects to various data sources like Google Sheets, SQL databases, and APIs, automating the entire process from data connection to visual storytelling.
Salesforce
Salesforce is the world's #1 Customer Relationship Management (CRM) platform, enhanced with Einstein AI to help businesses of …
Salesforce is the world's #1 Customer Relationship Management (CRM) platform, enhanced with Einstein AI to help businesses of all sizes connect with their customers in a smarter way. It provides integrated solutions for sales, service, marketing, commerce, and IT, using AI to automate tasks, predict outcomes, and deliver personalized experiences.
Factors.ai
Factors.ai is an AI-powered demand generation platform for B2B teams. It unifies account identification, multi-channel intent data, and …
Factors.ai is an AI-powered demand generation platform for B2B teams. It unifies account identification, multi-channel intent data, and revenue attribution to help businesses find high-intent accounts, automate GTM campaigns, and predictably grow their sales pipeline.
Ultimaps Category
Ultimaps Tag
Ultimaps AI Tool Comparison
Ultimaps Embed Feature
Just copy the embed code below and paste this beautiful badge on your blog, article, or official app website to drive traffic directly to this tool's detail page and quickly boost your exposure and user count!

No comments yet, be the first to comment!