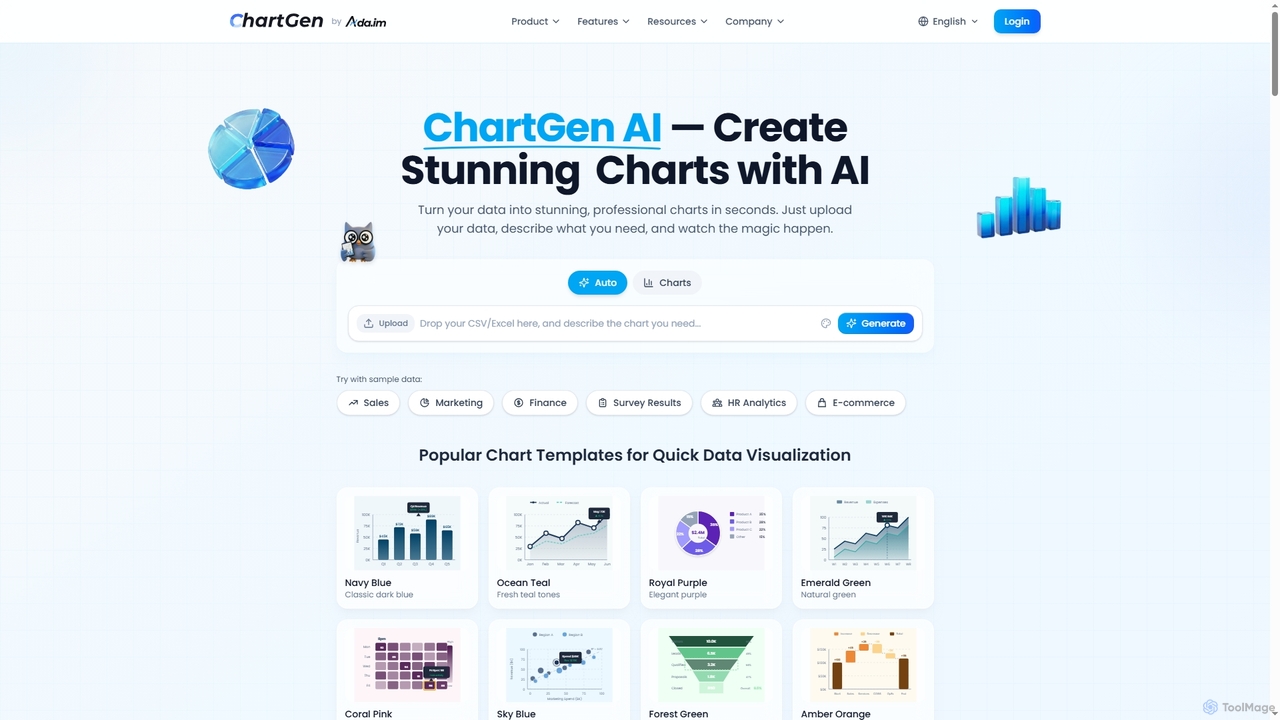
ChartGen
ChartGen is an AI-powered chart generator that transforms raw data into stunning, professional visualizations in seconds. Users simply …
ChartGen is an AI-powered chart generator that transforms raw data into stunning, professional visualizations in seconds. Users simply upload CSV or Excel files, describe their desired chart in plain English, and the AI instantly creates various chart types like bar, line, and pie charts. It's designed for quick, effortless data visualization without requiring design or coding skills.
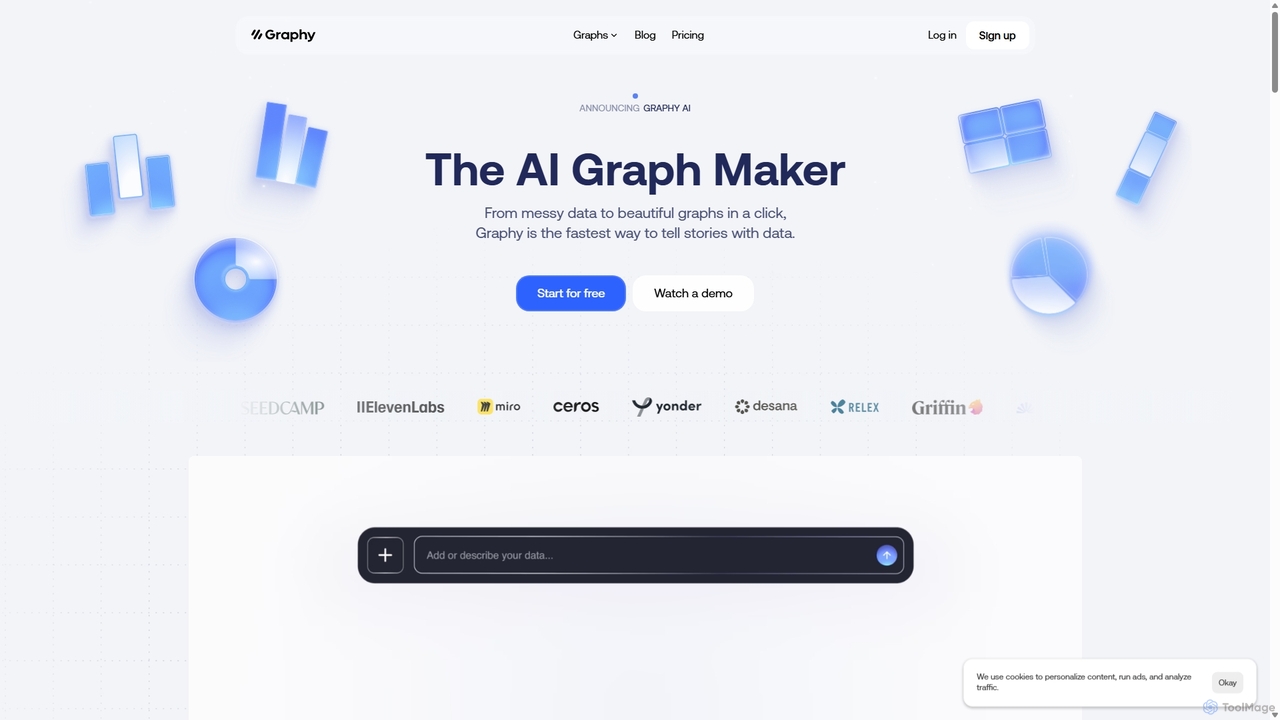
Graphy
Graphy is an AI-powered data visualization tool that transforms raw data into beautiful, interactive charts and graphs in …
Graphy is an AI-powered data visualization tool that transforms raw data into beautiful, interactive charts and graphs in seconds. It simplifies data storytelling by automatically identifying key insights, allowing users to chat with their data, and offering extensive customization. Ideal for marketers, analysts, and teams who need to create compelling visual reports and presentations without complex software.
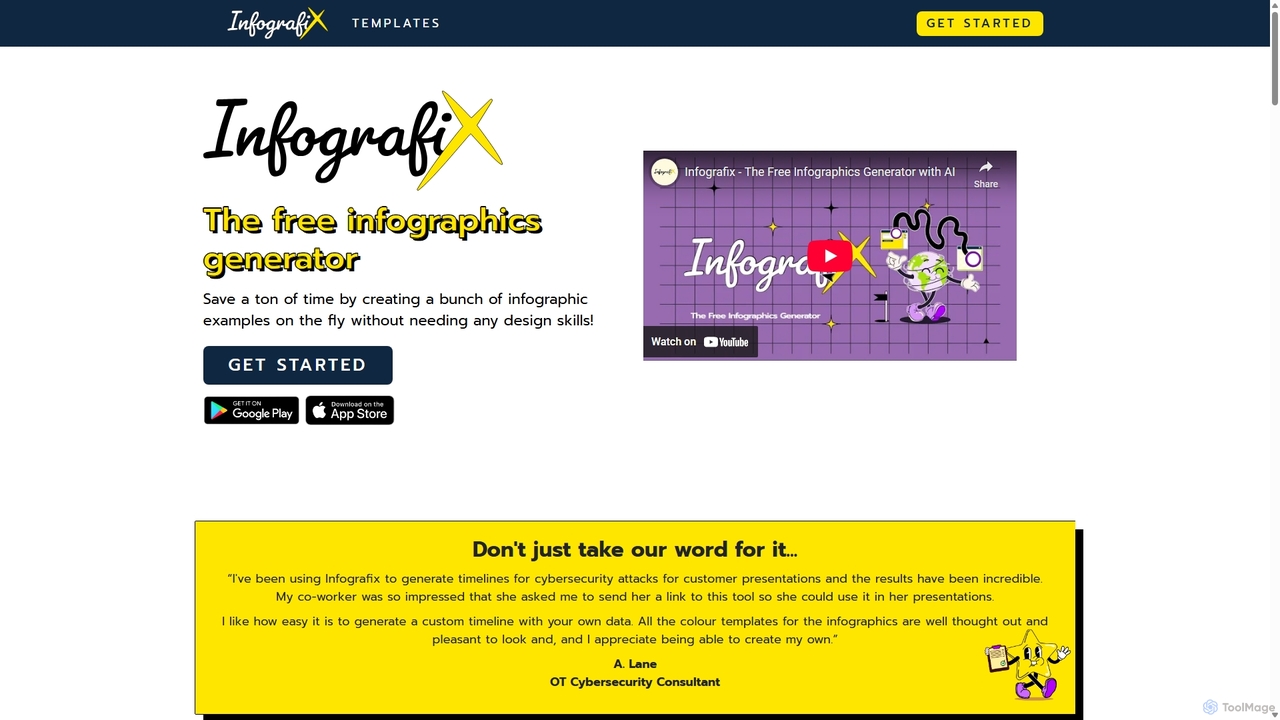
Infografix
Infografix is an AI-powered infographic generator that transforms simple text prompts into professional-quality visuals. Create stunning charts, diagrams, …
Infografix is an AI-powered infographic generator that transforms simple text prompts into professional-quality visuals. Create stunning charts, diagrams, mind maps, and timelines in seconds without any design skills. Available on web and mobile, it's perfect for marketers, students, and professionals who need to visualize data quickly and effectively.
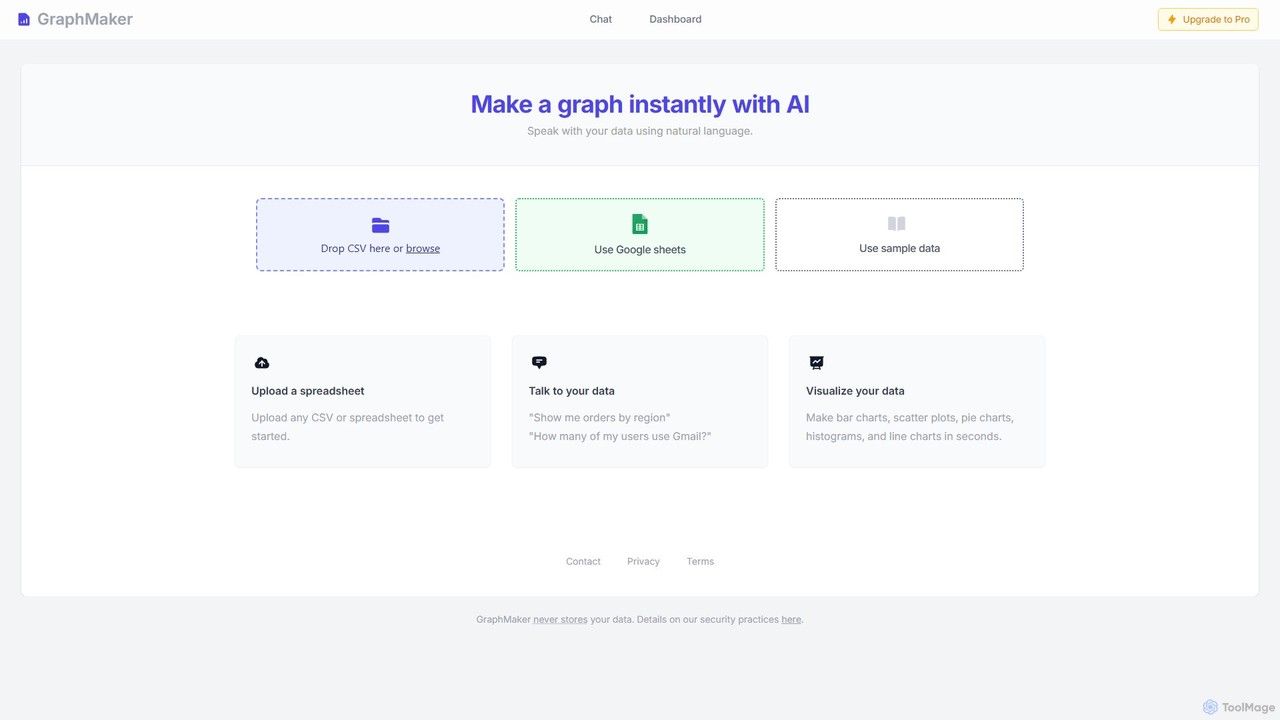
GraphMaker
GraphMaker is an AI-powered data visualization tool that allows you to create various charts and graphs in seconds. …
GraphMaker is an AI-powered data visualization tool that allows you to create various charts and graphs in seconds. Simply upload your data from a CSV file or Google Sheets, and use natural language commands to generate insightful visualizations like bar charts, pie charts, and histograms. It's designed for speed, simplicity, and security, as it never stores your data.
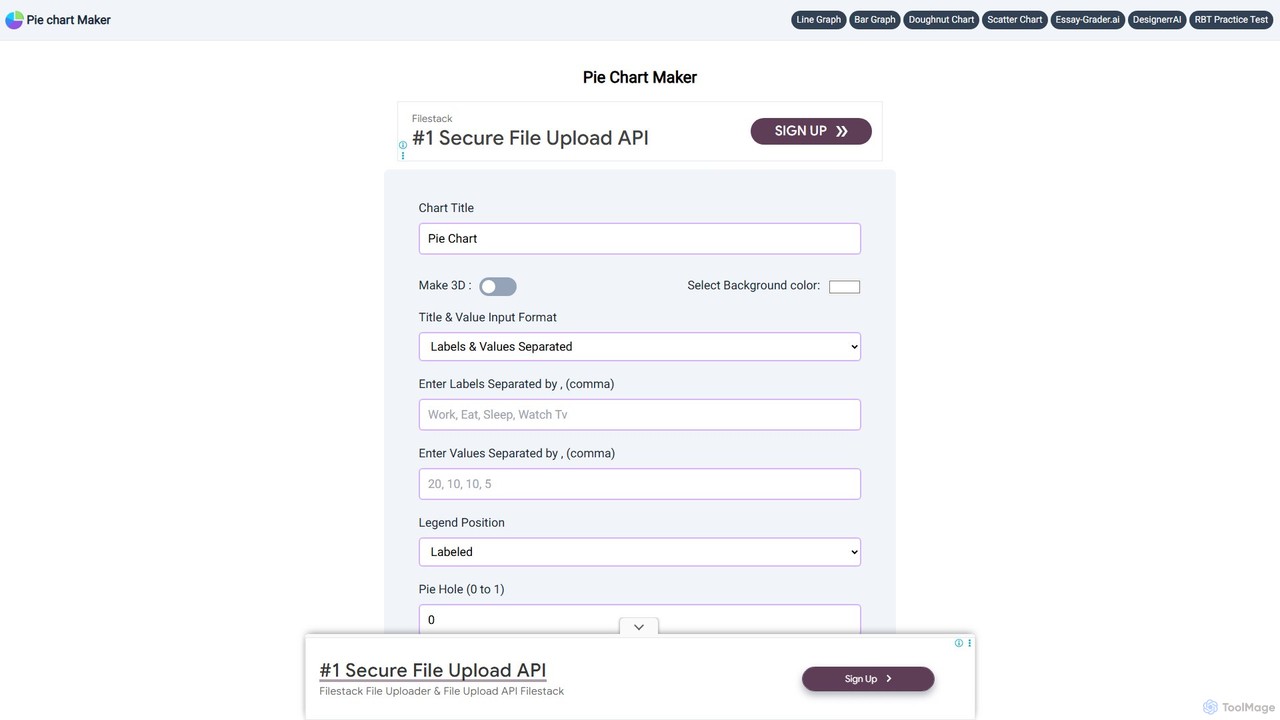
Pie Chart Maker
A free, user-friendly online tool for creating beautiful and customizable pie charts, doughnut charts, and line graphs in …
A free, user-friendly online tool for creating beautiful and customizable pie charts, doughnut charts, and line graphs in just a few clicks. Instantly visualize your data by simply entering labels and values, and download your charts in various formats like PNG, JPEG, and SVG.
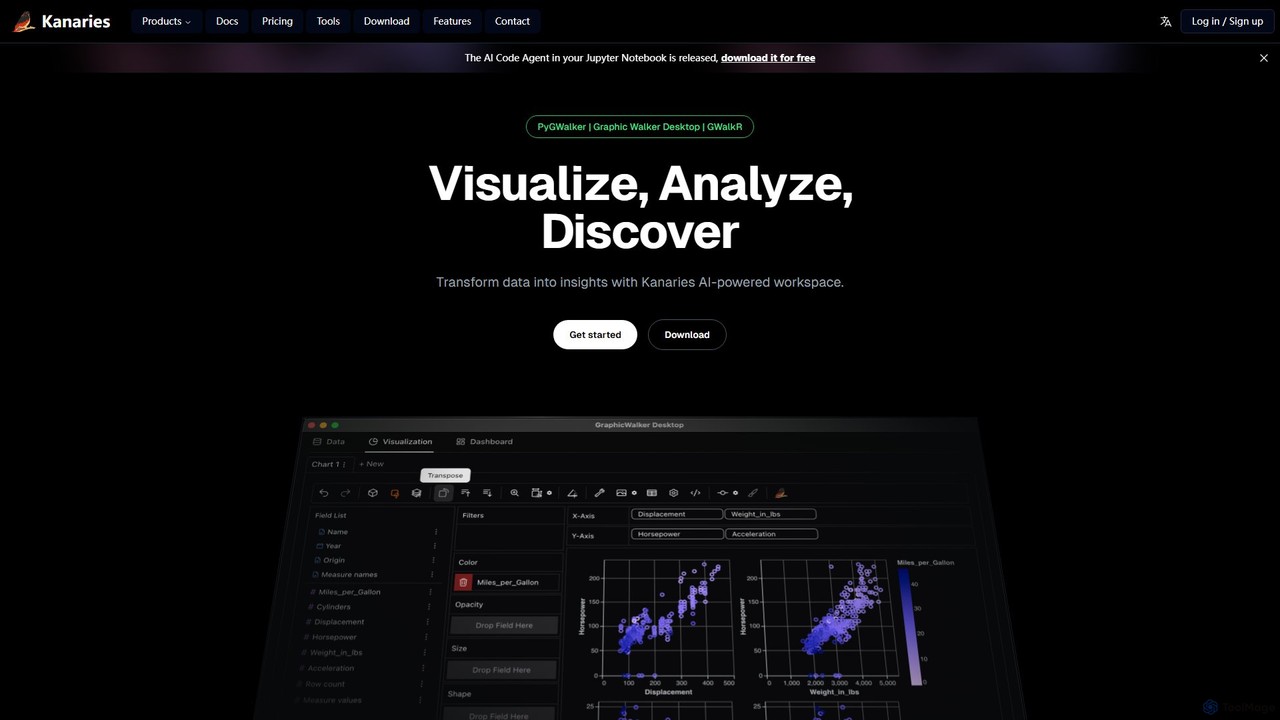
Kanaries
Kanaries is an AI-powered workspace designed for exploratory data analysis (EDA) and visualization. It offers a suite of …
Kanaries is an AI-powered workspace designed for exploratory data analysis (EDA) and visualization. It offers a suite of tools, including PyGWalker for Python and GWalkR for R, that transform dataframes into interactive visual analytics applications with a single line of code. It features a drag-and-drop interface, AI-powered chat for data querying, and collaborative features, streamlining the entire data-to-insight workflow for analysts, data scientists, and developers.
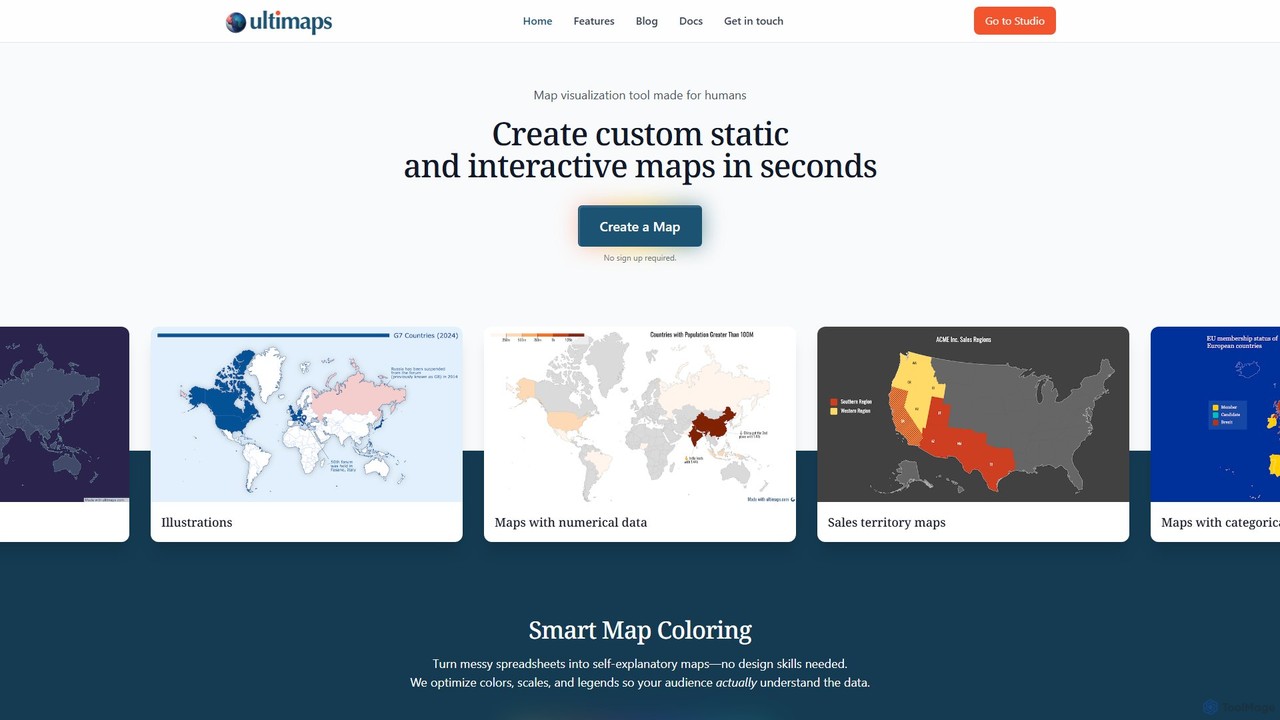
Ultimaps
Ultimaps is an AI-powered map visualization tool that allows anyone to create stunning static and interactive maps in …
Ultimaps is an AI-powered map visualization tool that allows anyone to create stunning static and interactive maps in seconds. Import data from spreadsheets, use AI prompts, or color manually. It automatically optimizes colors, scales, and legends to turn complex data into clear, presentation-ready visuals without needing design skills.
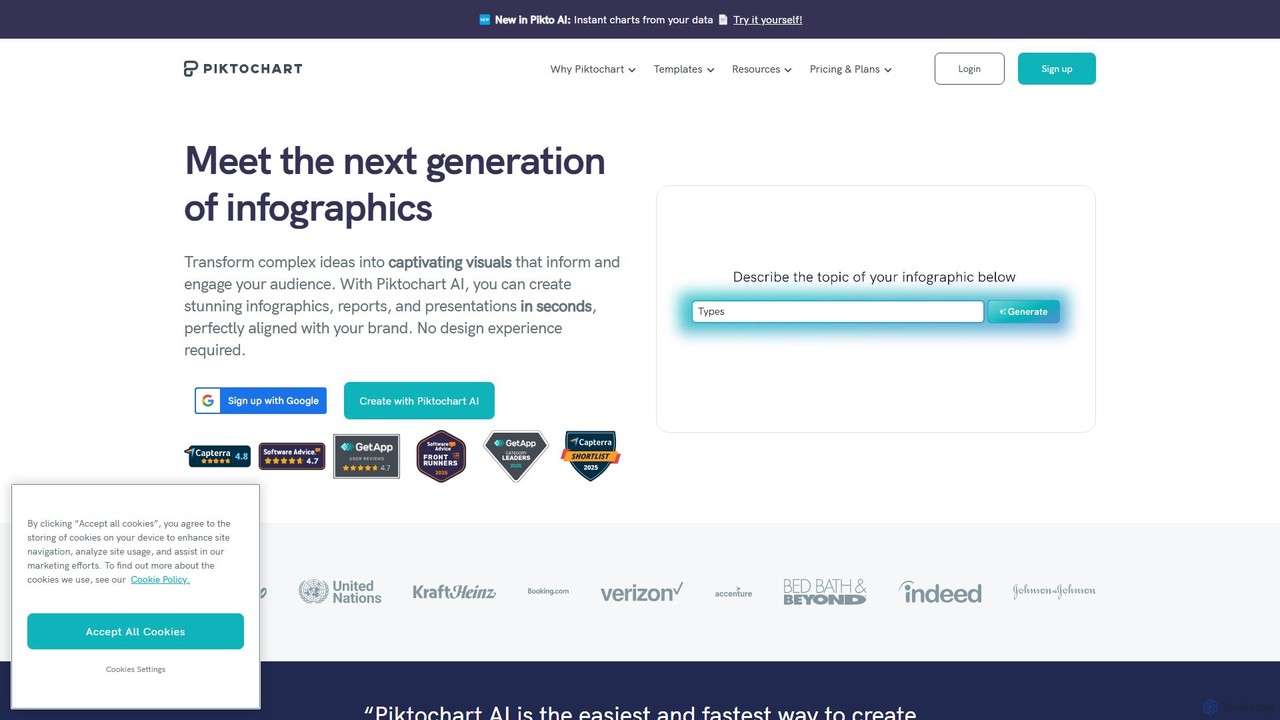
Piktochart
Piktochart is an all-in-one visual communication tool, now enhanced with AI, for creating professional infographics, presentations, reports, and …
Piktochart is an all-in-one visual communication tool, now enhanced with AI, for creating professional infographics, presentations, reports, and social media graphics. It simplifies data visualization and design, enabling users to transform text and data into compelling visuals effortlessly, with features for brand consistency and team collaboration.
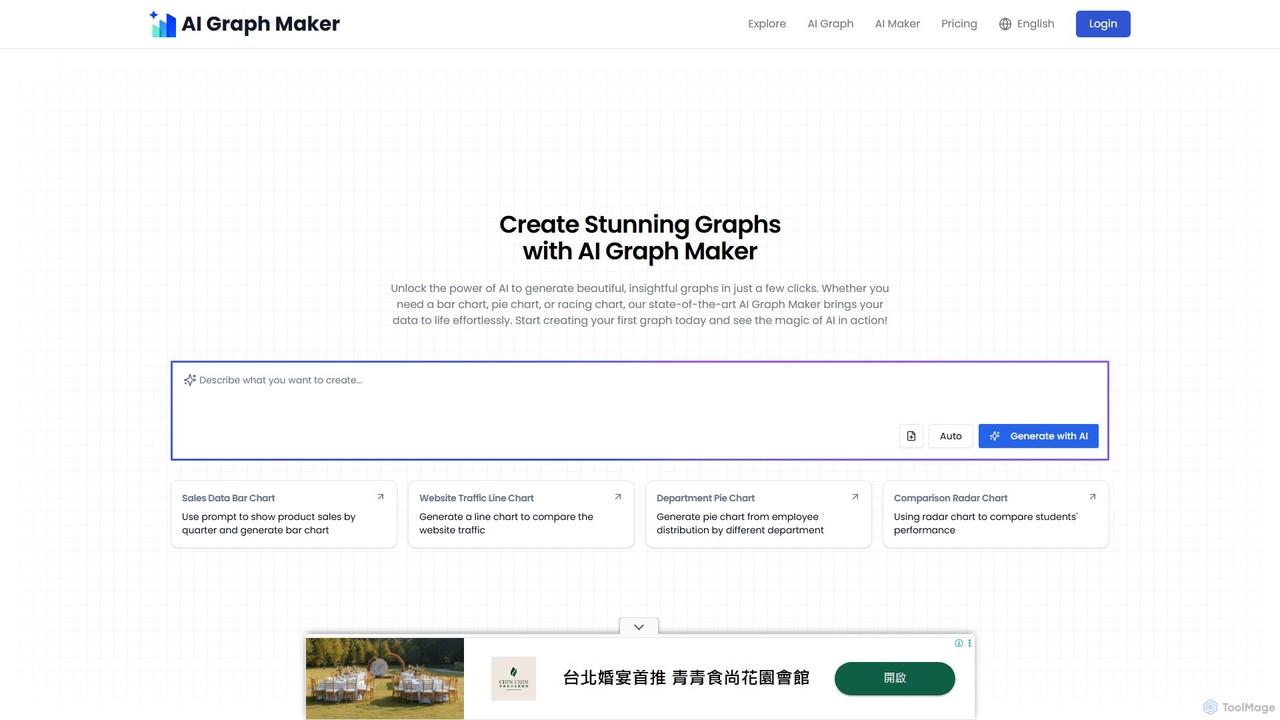
aigraphmaker
aigraphmaker is an AI-powered platform that transforms raw data and text prompts into a wide variety of professional …
aigraphmaker is an AI-powered platform that transforms raw data and text prompts into a wide variety of professional and interactive charts and diagrams. It enables users, from beginners to experts, to effortlessly create stunning visualizations like bar charts, mind maps, flowcharts, and knowledge graphs in seconds, without any coding or design skills required.
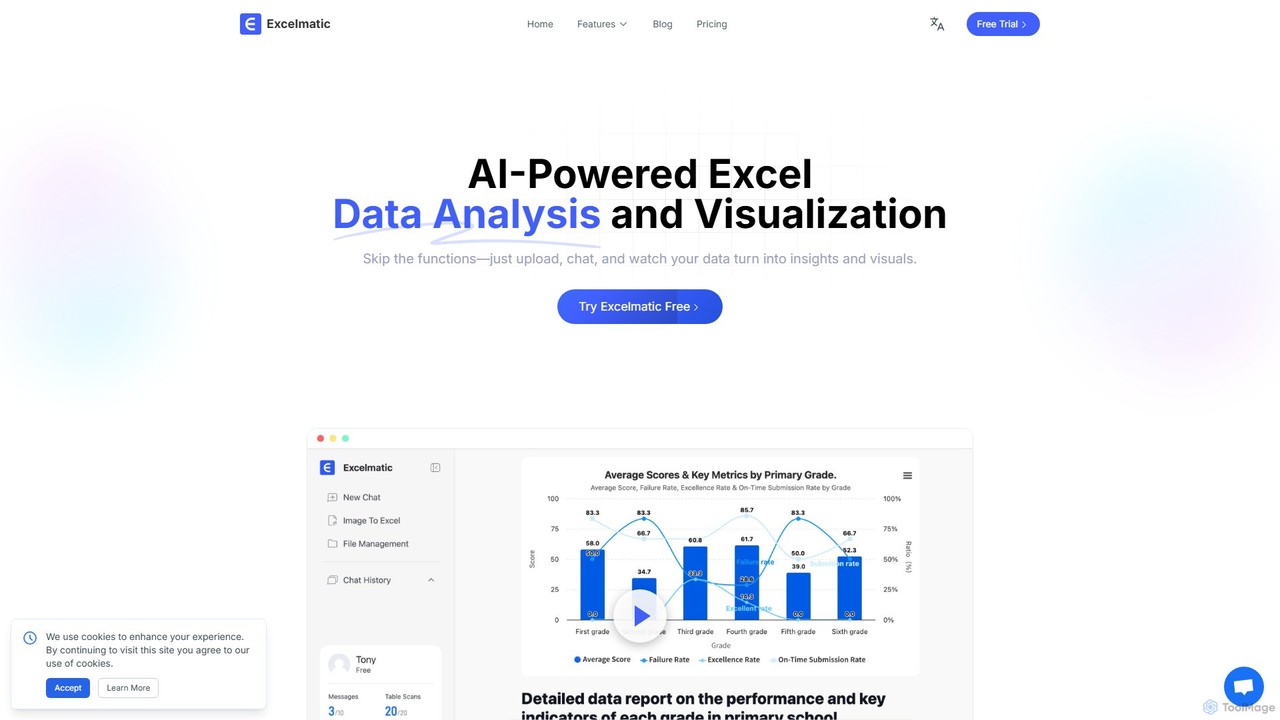
excelmatic
Excelmatic is an AI-powered assistant that transforms your Excel and spreadsheet tasks. Simply upload your data, ask questions …
Excelmatic is an AI-powered assistant that transforms your Excel and spreadsheet tasks. Simply upload your data, ask questions in plain English, and instantly get data analysis, visualizations, and generated formulas. It's a no-code solution designed to automate data cleaning, chart creation, and insight discovery, making data accessible to everyone.