Infografix
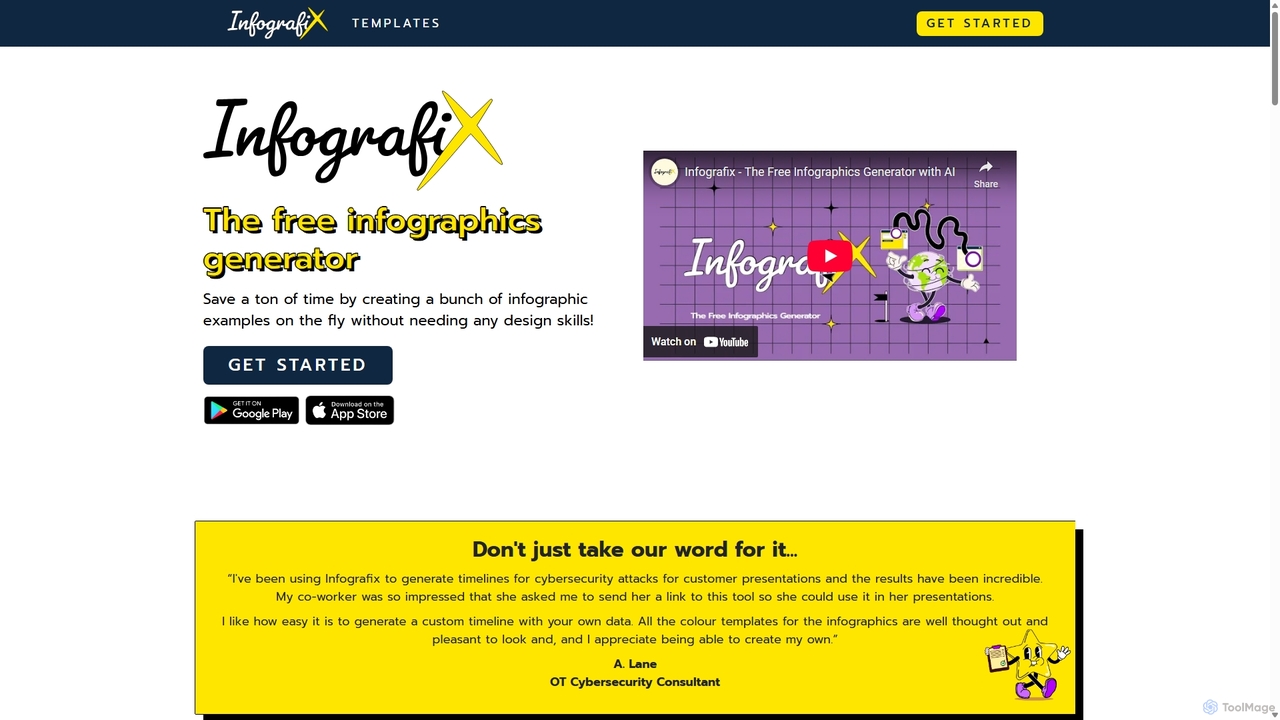
Infografix is an AI-powered infographic generator that transforms simple text prompts into professional-quality visuals. Create stunning charts, diagrams, …
Infografix is an AI-powered infographic generator that transforms simple text prompts into professional-quality visuals. Create stunning charts, diagrams, mind maps, and timelines in seconds without any design skills. Available on web and mobile, it's perfect for marketers, students, and professionals who need to visualize data quickly and effectively.
showthe.link
showthe.link is an AI-powered tool that transforms any web link into concise summaries and engaging visual content like …
showthe.link is an AI-powered tool that transforms any web link into concise summaries and engaging visual content like infographics, mind maps, or video clips. It helps users quickly grasp the core ideas of an article or webpage without reading the entire text.
infographics.so
infographics.so is an AI-powered tool that instantly transforms text into stunning, professional infographics. It supports various formats like …
infographics.so is an AI-powered tool that instantly transforms text into stunning, professional infographics. It supports various formats like timelines, roadmaps, and funnels, offering full customization to match your brand. Ideal for marketers, project managers, and content creators looking to create engaging visuals for reports, blogs, and presentations in seconds, with no design skills required.
Venngage
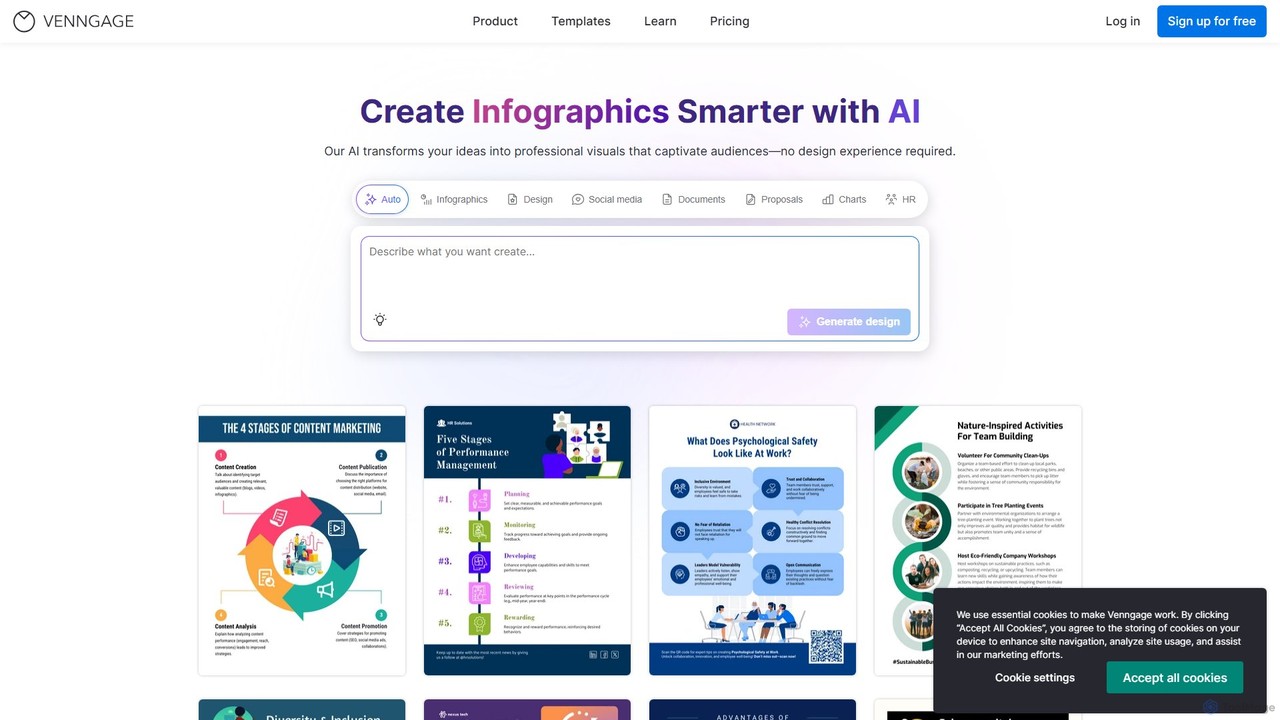
Venngage is an AI-powered online design platform that empowers users to create professional and engaging visuals like infographics, …
Venngage is an AI-powered online design platform that empowers users to create professional and engaging visuals like infographics, reports, presentations, and social media graphics. With over 10,000 templates and intelligent AI tools, it simplifies the design process, making it accessible for non-designers to produce high-quality, on-brand content. It's ideal for marketing, business communications, and data visualization.
PicDoc
PicDoc is an AI-powered text-to-visual tool that instantly transforms text into stunning infographics, flowcharts, and diagrams. Simply input …
PicDoc is an AI-powered text-to-visual tool that instantly transforms text into stunning infographics, flowcharts, and diagrams. Simply input your content, and PicDoc's AI will analyze, summarize, and visualize it in seconds, helping you communicate complex ideas effectively and create professional-looking visuals without design skills.
graphicinfo
graphicinfo is an AI-powered infographic generator that transforms your text and ideas into stunning, professional visuals in seconds. …
graphicinfo is an AI-powered infographic generator that transforms your text and ideas into stunning, professional visuals in seconds. With just one click, create customizable, data-rich infographics for marketing, education, and business, no design skills required.
Slatebox
Slatebox is an AI-powered platform that instantly transforms text prompts and data into dynamic, editable visuals like mind …
Slatebox is an AI-powered platform that instantly transforms text prompts and data into dynamic, editable visuals like mind maps, infographics, and presentations. It simplifies storytelling by creating engaging, Prezi-style visual narratives with a single click, featuring real-time collaboration and a vast template library.
Text2Infographic
Text2Infographic is an AI-powered generator that transforms text, blog posts, or data into professional-quality infographics in minutes. It …
Text2Infographic is an AI-powered generator that transforms text, blog posts, or data into professional-quality infographics in minutes. It automates research, image sourcing, and design, making it ideal for content creators, marketers, and bloggers without design skills. It supports over 20 languages and offers brand customization.
Infography
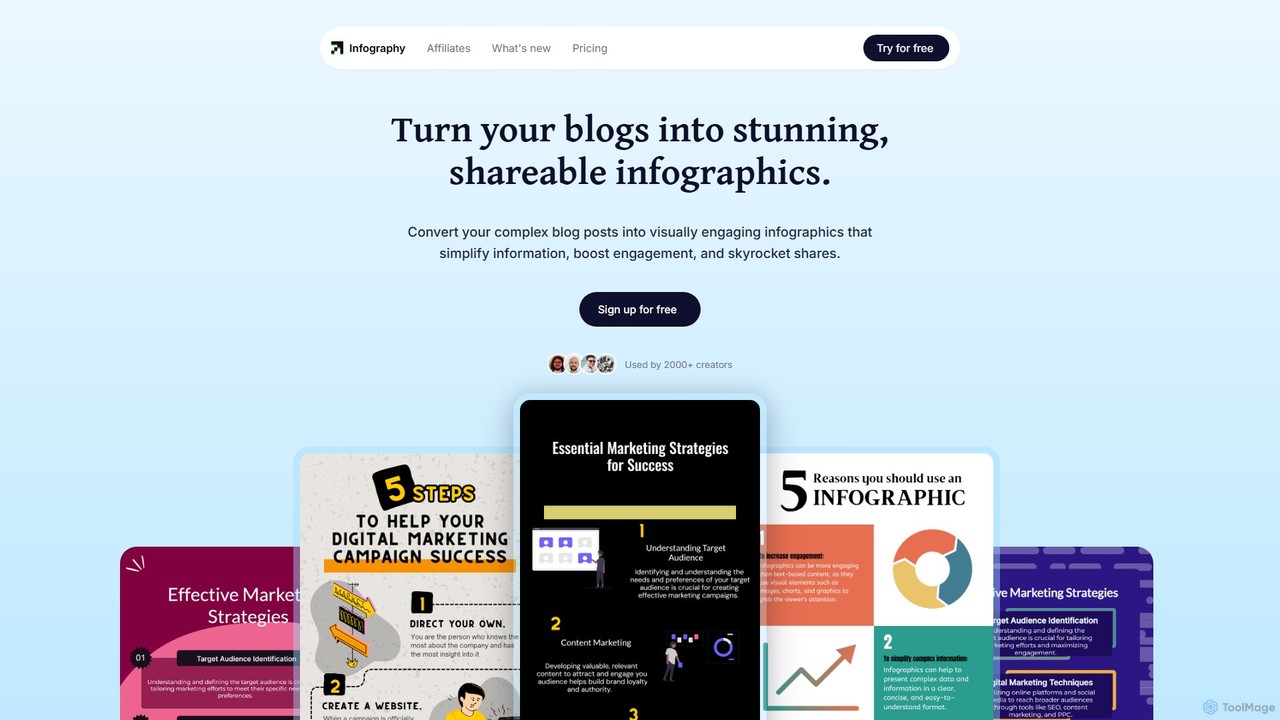
Infography is an AI-powered tool that instantly transforms blog posts, articles, or simple text into stunning, shareable infographics. …
Infography is an AI-powered tool that instantly transforms blog posts, articles, or simple text into stunning, shareable infographics. It simplifies complex information, boosts content engagement, and automates visual creation, making it ideal for marketers, creators, and businesses looking to enhance their content strategy.
MyLens
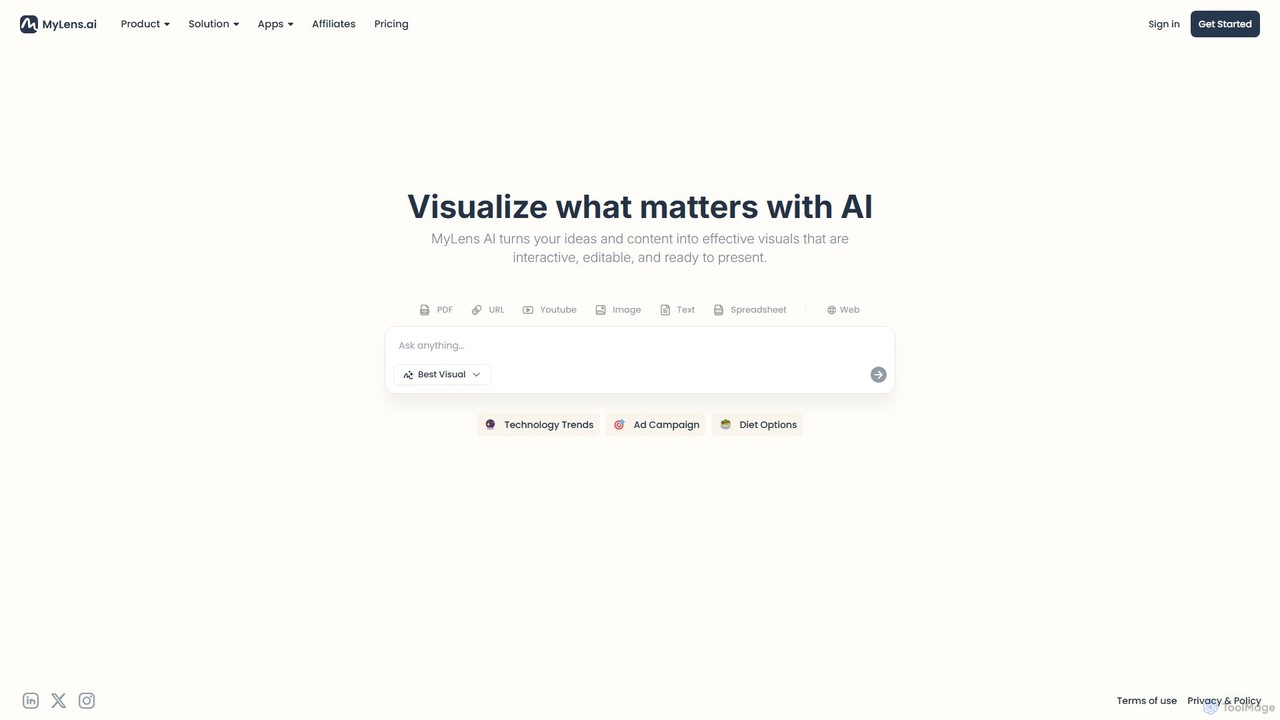
MyLens is an AI-powered visualization platform that transforms your text, data, and ideas into interactive, editable, and presentation-ready …
MyLens is an AI-powered visualization platform that transforms your text, data, and ideas into interactive, editable, and presentation-ready visuals. Effortlessly create stunning infographics, charts, diagrams, and presentations to communicate complex information with clarity and impact.
Napkin AI
Napkin AI is a visual AI tool that transforms your text into professional business visuals like diagrams, infographics, …
Napkin AI is a visual AI tool that transforms your text into professional business visuals like diagrams, infographics, flowcharts, and mind maps. It's designed for effortless business storytelling, allowing users to create compelling, editable visuals directly from their content without needing any design skills. Ideal for presentations, reports, and social media.
Outline Ninja
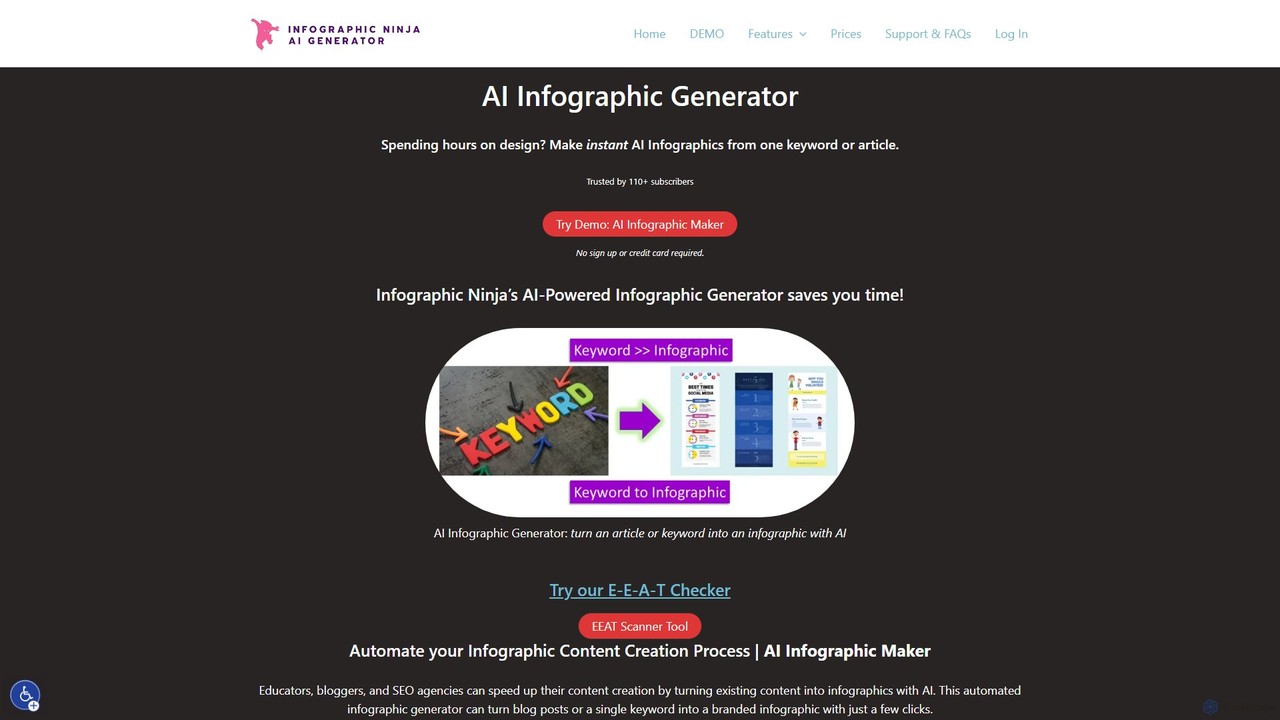
Outline Ninja is a comprehensive AI-powered suite for SEO and content creation. It features an AI Infographic Generator …
Outline Ninja is a comprehensive AI-powered suite for SEO and content creation. It features an AI Infographic Generator that turns keywords or articles into visuals instantly. The suite also includes an all-in-one topic research tool, a HowTo schema generator, and an E-E-A-T auditor to help bloggers, marketers, and agencies create high-ranking, comprehensive content efficiently.
Genially
Genially is an all-in-one online tool for creating stunning interactive and animated content. Without any coding skills, users …
Genially is an all-in-one online tool for creating stunning interactive and animated content. Without any coding skills, users can design presentations, infographics, gamified quizzes, and eLearning materials. It leverages AI to accelerate content creation, making it ideal for educators, marketers, and corporate trainers to boost audience engagement.
About Infographics
AI Infographics tools are specialized platforms that leverage artificial intelligence to simplify and automate the creation of visual data representations. These tools analyze raw data, suggest optimal chart types, and generate visually appealing infographics, transforming complex information into easily digestible visual stories. They empower marketers, educators, and business professionals to communicate insights effectively, even without extensive design skills, by streamlining the entire visualization process within the broader Design category.
Core Features
- Automated Data Visualization: Automatically converts raw data from spreadsheets or databases into various chart types and visual elements.
- Smart Template Generation: Offers AI-driven suggestions for infographic layouts and templates based on content and purpose.
- Content Summarization & Integration: Extracts key insights from text and integrates them seamlessly into visual narratives.
- Customization & Branding: Provides options to adjust colors, fonts, icons, and brand elements to match specific guidelines.
- Interactive Elements: Supports the inclusion of interactive charts, maps, and clickable elements for dynamic presentations.
Use Cases
These tools are invaluable for professionals needing to present data clearly and engagingly. Marketing teams use them to showcase campaign performance, while educators create compelling learning materials. Business analysts leverage them to visualize market trends and financial reports, making complex data accessible to stakeholders. They significantly reduce the time and effort traditionally required for graphic design, allowing users to focus on content and insights.
How to Choose
When selecting an AI Infographics tool, consider its data integration capabilities (e.g., CSV, Excel, APIs), the range of customization options for branding, and the variety of output formats (e.g., PNG, PDF, interactive web embeds). Evaluate the ease of use for non-designers, the quality of AI-generated suggestions, and any collaboration features for team projects. Pricing models and the availability of specific chart types relevant to your industry are also crucial factors.
InfographicsUse Cases
Visualizing Marketing Campaign Performance
Marketing managers can input campaign data (e.g., website traffic, conversion rates, social media engagement) into an AI infographics tool. The tool automatically generates charts and visual summaries, allowing them to quickly create compelling reports for stakeholders, highlighting key successes and areas for improvement without manual design.
Simplifying Complex Research Findings
Researchers and academics often deal with dense data and intricate concepts. Using AI infographics tools, they can transform lengthy reports and statistical analyses into clear, concise visual summaries, making their findings more accessible and engaging for a broader audience, including policymakers and the public.
Creating Engaging Educational Materials
Educators can leverage these tools to convert textbook information, historical timelines, or scientific processes into visually stimulating infographics. This helps students grasp complex subjects more easily, improves retention, and makes learning more interactive and enjoyable, enhancing the overall educational experience.
Presenting Business Reports and Financial Data
Business analysts and executives need to communicate financial performance, market trends, and strategic plans effectively. AI infographics tools enable them to quickly generate professional-looking charts, dashboards, and summary visuals from raw financial data, facilitating clearer decision-making and stakeholder communication.
Designing Social Media Content Rapidly
Social media managers constantly need fresh, engaging content. With AI infographics tools, they can quickly turn statistics, tips, or announcements into eye-catching visuals optimized for various platforms. This automates the design process, allowing for consistent content creation and increased audience engagement.
Explaining Product Features and Benefits
Product managers and sales teams can use AI infographics tools to visually articulate the features, benefits, and usage instructions of their products. By creating clear, step-by-step visual guides or comparison charts, they can enhance product understanding for customers and support sales efforts more effectively.