Infografix
Visit Website


Infografix Overview
Infografix is a revolutionary AI-driven tool designed to democratize the creation of infographics and data visualizations. It empowers users, regardless of their design expertise, to generate compelling and informative visuals instantly. By simply inputting text data or descriptive prompts, Infografix's intelligent engine interprets the information and constructs professional-grade graphics. This eliminates the time-consuming process of brainstorming layouts, searching for templates, and manually arranging elements, allowing you to focus on the message you want to convey.
The platform is built for speed and accessibility, available as a web application accessible from any desktop or mobile browser, as well as dedicated apps on the Apple App Store and Google Play. This cross-platform availability ensures you can create and share infographics from anywhere, at any time. Whether you're preparing a last-minute presentation, enhancing a blog post, or creating content for social media, Infografix streamlines the entire design workflow into a few simple steps.
How to use Infografix
Using Infografix is an incredibly straightforward process designed for maximum efficiency:
- Select a Template: Start by choosing from a vast library of pre-designed templates. These are categorized for various purposes, such as Hierarchy for organizational charts, Timeline for historical data, Process for workflows, SWOT for business analysis, or different chart types like Bar, Pie, and Line charts for data representation.
- Input Your Data: Once you've selected a template, simply type or paste your data into the provided text field. This could be a list of team members for a hierarchy chart, key dates for a timeline, or statistical figures for a bar chart. The AI will use this text to populate the infographic.
- Generate with AI: With a single click, the AI engine processes your data and generates a visually structured infographic based on your chosen template.
- Customize Your Design: After the initial generation, you have full control over the aesthetics. You can change the theme (e.g., Monochrome, Cyberpunk, Cottagecore), adjust font styles and sizes, select different aspect ratios (1:1, 16:9, etc.) to fit various platforms, and even apply pattern fills for a unique look.
- Download and Share: Once you are satisfied with your creation, you can export it in multiple high-quality formats, including JPEG, PNG, PDF, and SVG. This flexibility allows you to use your infographic in digital presentations, printed reports, websites, and social media channels.
Core Features of Infografix
- AI-Powered Generation: Instantly creates infographics from simple text prompts and data input.
- Extensive Template Library: Includes a wide range of templates for various needs, such as Hierarchy, Timeline, List, Cycle, SWOT Analysis, Process Flow, Mind Maps, and Family Trees.
- Diverse Data Visualization Options: Supports numerous chart types including Bar Charts, Pie Charts, Donut Charts, Line Charts, and Knob Charts to represent data accurately.
- Advanced Customization: Offers deep customization with multiple themes, a vast selection of fonts, adjustable aspect ratios, and unique pattern fills.
- Multi-Format Export: Allows users to download their creations in versatile formats like JPEG, PNG, PDF, and scalable SVG.
- Cross-Platform Accessibility: Seamlessly works on desktop and mobile web browsers, with dedicated applications available for iOS and Android devices.
Use Cases for Infografix
Infografix is a versatile tool suitable for a wide array of professional and personal applications:
- Marketing and Social Media: Create eye-catching visuals for social media posts, ad campaigns, and content marketing to increase engagement.
- Business and Reporting: Design clear organizational charts, project timelines, process flows, and SWOT analyses for internal reports and client presentations.
- Education and E-Learning: Students and educators can create mind maps for studying, timelines for history projects, and diagrams to explain complex concepts.
- Data Analysis: Quickly turn raw data and statistics into easy-to-understand charts and graphs for reports and dashboards.
- Content Creation: Enhance blog posts, articles, and websites with custom infographics that make information more digestible and shareable.
Advantages of Infografix
The primary advantage of Infografix is its ability to make professional design accessible to everyone. It saves significant time and resources that would otherwise be spent on manual design or hiring a graphic designer. Its intuitive, prompt-based interface drastically lowers the learning curve, while the powerful AI engine ensures a high-quality, polished output every time. The flexibility in templates, customization, and export options makes it a one-stop solution for all infographic needs.
Pricing and Plans
Infografix operates on a freemium model, making it accessible for everyone to get started.
- Free Plan: Users can start for free and receive a limited number of AI generations (e.g., 10 credits). This plan is ideal for casual users or those who want to test the platform's capabilities. It likely includes access to basic templates and standard export options.
- Paid Plans (Pro/Premium): For users with more extensive needs, Infografix is expected to offer subscription-based plans. These plans would typically include benefits such as unlimited infographic generations, access to all premium templates and design themes, watermark-free exports, higher-resolution downloads, and priority customer support.
(Note: Specific pricing details were not available on the website. The above is based on a standard freemium model for similar AI tools.)
Infografix Comments (0)
Log in to post comments
Log in nowInfografixWebsite Traffic Analysis
Latest Traffic
Status
Monthly Traffic Trend
Geography
Top 5 Countries/Regions
-
🇺🇸 United States28.78%
-
🇳🇬 Nigeria24.01%
-
🇮🇳 India18.95%
-
🇿🇦 South Africa16.98%
-
🇲🇽 Mexico11.28%
Popular Keywords
| Keyword | Cost Per Click |
|---|---|
|
$0.00
|
|
|
$0.00
|
|
|
$0.96
|
|
|
$1.05
|
|
|
$0.00
|
Infografix Alternatives
View All
infographics.so
infographics.so is an AI-powered tool that instantly transforms text into stunning, professional infographics. It supports various formats like …
infographics.so is an AI-powered tool that instantly transforms text into stunning, professional infographics. It supports various formats like timelines, roadmaps, and funnels, offering full customization to match your brand. Ideal for marketers, project managers, and content creators looking to create engaging visuals for reports, blogs, and presentations in seconds, with no design skills required.
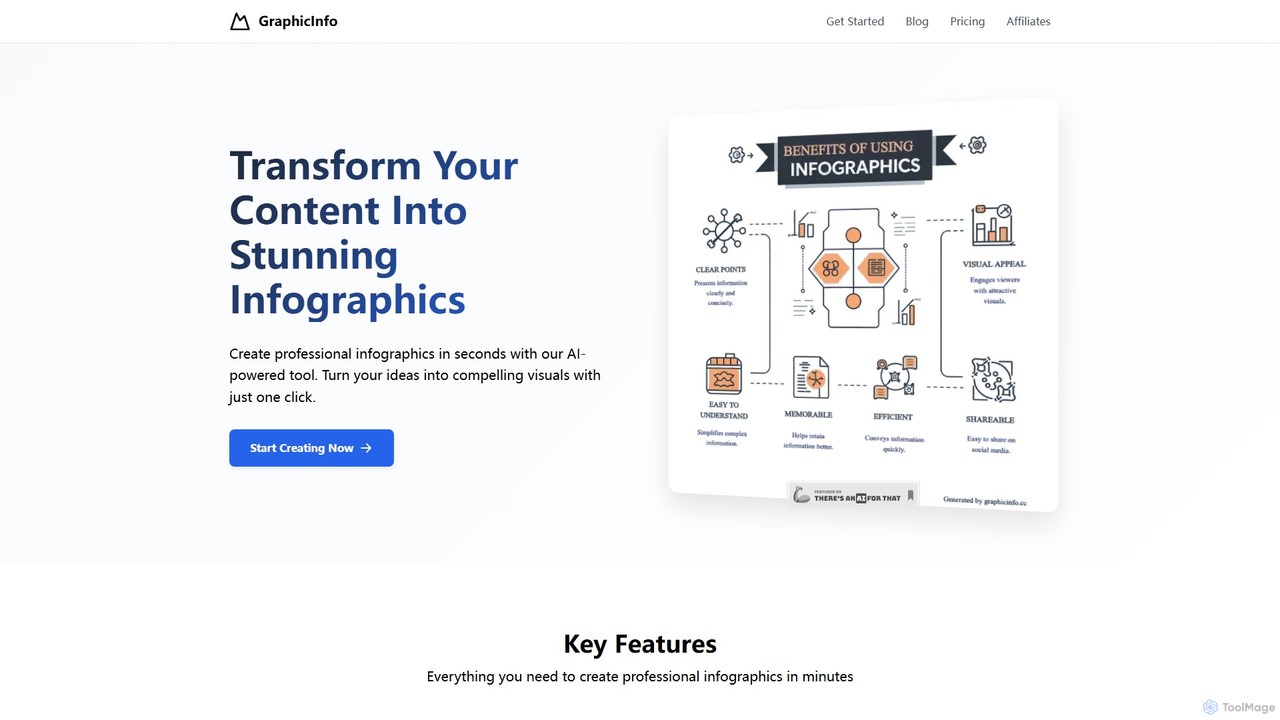
graphicinfo
graphicinfo is an AI-powered infographic generator that transforms your text and ideas into stunning, professional visuals in seconds. …
graphicinfo is an AI-powered infographic generator that transforms your text and ideas into stunning, professional visuals in seconds. With just one click, create customizable, data-rich infographics for marketing, education, and business, no design skills required.
Doc2Q
Doc2Q is an AI-powered tool that transforms documents (PDF, DOCX, images) into various formats like infographics, quizzes, diagrams, …
Doc2Q is an AI-powered tool that transforms documents (PDF, DOCX, images) into various formats like infographics, quizzes, diagrams, and datasets. It operates on a flexible pay-as-you-go credit system, allowing users to convert content quickly and efficiently for marketing, education, or data analysis purposes.
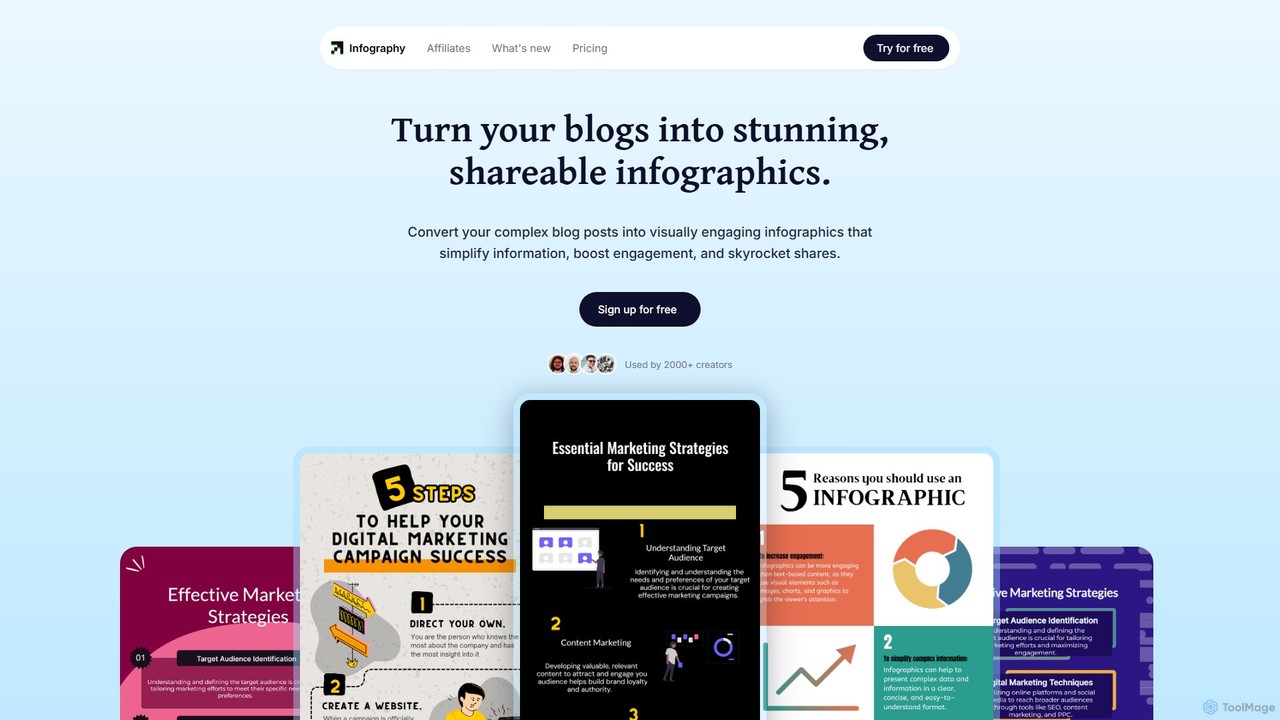
Infography
Infography is an AI-powered tool that instantly transforms blog posts, articles, or simple text into stunning, shareable infographics. …
Infography is an AI-powered tool that instantly transforms blog posts, articles, or simple text into stunning, shareable infographics. It simplifies complex information, boosts content engagement, and automates visual creation, making it ideal for marketers, creators, and businesses looking to enhance their content strategy.
SVGs
SVGs is an AI-powered platform designed to generate high-quality, consistent SVG illustrations rapidly. It empowers individuals and teams …
SVGs is an AI-powered platform designed to generate high-quality, consistent SVG illustrations rapidly. It empowers individuals and teams to create stunning, on-brand visuals for various applications, from websites and apps to marketing materials, without requiring extensive design expertise or significant time and cost investments.
PoweredTemplate AI Presentation Maker
PoweredTemplate AI Presentation Maker is a free, AI-powered tool that transforms your ideas and text into stunning, professional …
PoweredTemplate AI Presentation Maker is a free, AI-powered tool that transforms your ideas and text into stunning, professional presentations 10x faster. Instantly generate high-quality slides with unique content and captivating visuals for business, education, and marketing. It supports export to PowerPoint, Google Slides, and PDF, offering extensive customization through a vast library of templates and stock media.

Graphitup
Graphitup is an AI-powered data visualization tool that transforms raw data from Excel or Google Sheets into stunning, …
Graphitup is an AI-powered data visualization tool that transforms raw data from Excel or Google Sheets into stunning, on-brand charts and interactive dashboards. It offers robust theming, extensive customization, and easy publishing options, enabling businesses and creators to tell compelling data stories and build lasting digital assets.
showthe.link
showthe.link is an AI-powered tool that transforms any web link into concise summaries and engaging visual content like …
showthe.link is an AI-powered tool that transforms any web link into concise summaries and engaging visual content like infographics, mind maps, or video clips. It helps users quickly grasp the core ideas of an article or webpage without reading the entire text.
ChartGPT
ChartGPT is an AI-powered tool that transforms natural language prompts and raw data into stunning, customizable charts and …
ChartGPT is an AI-powered tool that transforms natural language prompts and raw data into stunning, customizable charts and graphs. Effortlessly create complex visualizations like bar charts, line graphs, and pie charts without any coding, simply by describing what you want to see.
Felo
Felo is an all-in-one AI platform that transforms search into a comprehensive creation and analysis engine. It utilizes …
Felo is an all-in-one AI platform that transforms search into a comprehensive creation and analysis engine. It utilizes intelligent agents to automate research, generate insightful reports, create stunning presentations, and build interactive web pages from a simple query or uploaded files, significantly boosting productivity for professionals.
Infografix Category
Infografix Tag
Infografix Applicable Job
Infografix AI Tool Comparison
Infografix Embed Feature
Just copy the embed code below and paste this beautiful badge on your blog, article, or official app website to drive traffic directly to this tool's detail page and quickly boost your exposure and user count!

No comments yet, be the first to comment!