ChartGPT
Visit Website
ChartGPT Overview
ChartGPT is a revolutionary AI-driven data visualization tool designed to simplify the process of creating charts and graphs. By leveraging the power of advanced large language models, ChartGPT allows users to generate complex and insightful visualizations from simple text descriptions or raw data. This eliminates the steep learning curve associated with traditional data visualization software and empowers anyone, from business analysts to students, to turn data into compelling visual stories. Whether you need to quickly visualize sales figures, analyze market trends, or present research findings, ChartGPT streamlines the entire workflow, making data analysis more accessible and efficient than ever before.
How to use ChartGPT
Using ChartGPT is an intuitive and straightforward process, designed for users of all skill levels:
- Input Your Data: Begin by providing your data. You can paste data directly from a spreadsheet, upload a file (such as CSV or Excel), or even describe the dataset in plain text.
- Describe Your Chart: In the prompt box, simply type what you want to visualize in natural language. For example, you could write, "Create a bar chart showing monthly revenue for the last year," or "Show the correlation between ad spend and website traffic with a scatter plot."
- Generate and Refine: ChartGPT's AI will instantly interpret your request and generate the appropriate chart. From there, you can easily refine it. Use further prompts to change chart types, adjust colors, add labels, or modify the title, such as, "Change the color to blue" or "Make this a line graph instead."
- Export and Share: Once you are satisfied with your visualization, you can export it in various high-quality formats like PNG, JPEG, or SVG, ready to be used in presentations, reports, or websites.
Core Features of ChartGPT
- Natural Language Processing: The core of ChartGPT is its ability to understand and process plain English commands, making chart creation as simple as having a conversation.
- Multiple Data Input Options: Supports various data formats, including direct copy-paste, CSV and Excel file uploads, and even data described in text.
- Wide Range of Chart Types: Generate a diverse array of visualizations, including bar charts, line graphs, pie charts, scatter plots, histograms, area charts, and more.
- Interactive Customization: Easily modify every aspect of your chart through conversational prompts. Change colors, fonts, labels, titles, and even switch between chart types on the fly.
- AI-Powered Insights: Beyond just visualization, ChartGPT can help identify trends, outliers, and key insights within your data, suggesting the most effective chart types for your specific dataset.
- High-Resolution Exports: Download your finished charts in multiple formats (PNG, SVG, JPEG) suitable for both digital and print use.
- Embeddable Charts: (Coming Soon) Generate embed codes to seamlessly integrate your interactive charts into websites, blogs, and online dashboards.
Use Cases for ChartGPT
ChartGPT is a versatile tool that caters to a wide range of professional and academic needs:
- Business Analysts: Quickly generate visualizations for internal reports, stakeholder presentations, and performance dashboards to track KPIs.
- Marketing Professionals: Create charts to visualize campaign performance, customer segmentation, market research data, and social media engagement.
- Students and Researchers: Effortlessly create graphs and charts for academic papers, theses, and presentations to clearly illustrate research findings.
- Content Creators and Journalists: Enhance articles, blog posts, and reports with data-driven infographics and visuals to make information more engaging.
- Product Managers: Visualize user behavior data, feature adoption rates, and A/B test results to make informed product decisions.
Advantages of ChartGPT
ChartGPT offers significant advantages over traditional tools:
- Speed and Efficiency: Go from raw data to a finished chart in seconds, dramatically reducing the time spent on manual chart creation.
- Accessibility: No coding or complex software knowledge is required. If you can describe it, you can create it.
- Intuitive Workflow: The conversational interface removes friction and makes the data visualization process feel natural and effortless.
- Flexibility: Supports a wide variety of data sources and visualization types, adapting to your specific needs.
- Enhanced Data Storytelling: By making visualization easy, ChartGPT helps users focus on crafting a clear and impactful narrative with their data.
Pricing and Plans
ChartGPT offers a flexible pricing structure to suit different needs:
- Free Plan: Perfect for casual users and students. Includes a limited number of chart generations per month with basic features and a ChartGPT watermark.
- Pro Plan ($15/month): Ideal for professionals and power users. Offers unlimited chart generations, advanced customization options, high-resolution exports, and no watermarks.
- Team Plan ($50/month for 5 users): Designed for collaboration. Includes all Pro features plus shared workspaces, team management, and priority support.
- Enterprise Plan (Custom Pricing): For larger organizations requiring custom integrations, API access, and dedicated support. Contact sales for a quote.
ChartGPT Comments (0)
Log in to post comments
Log in nowChartGPT Alternatives
View All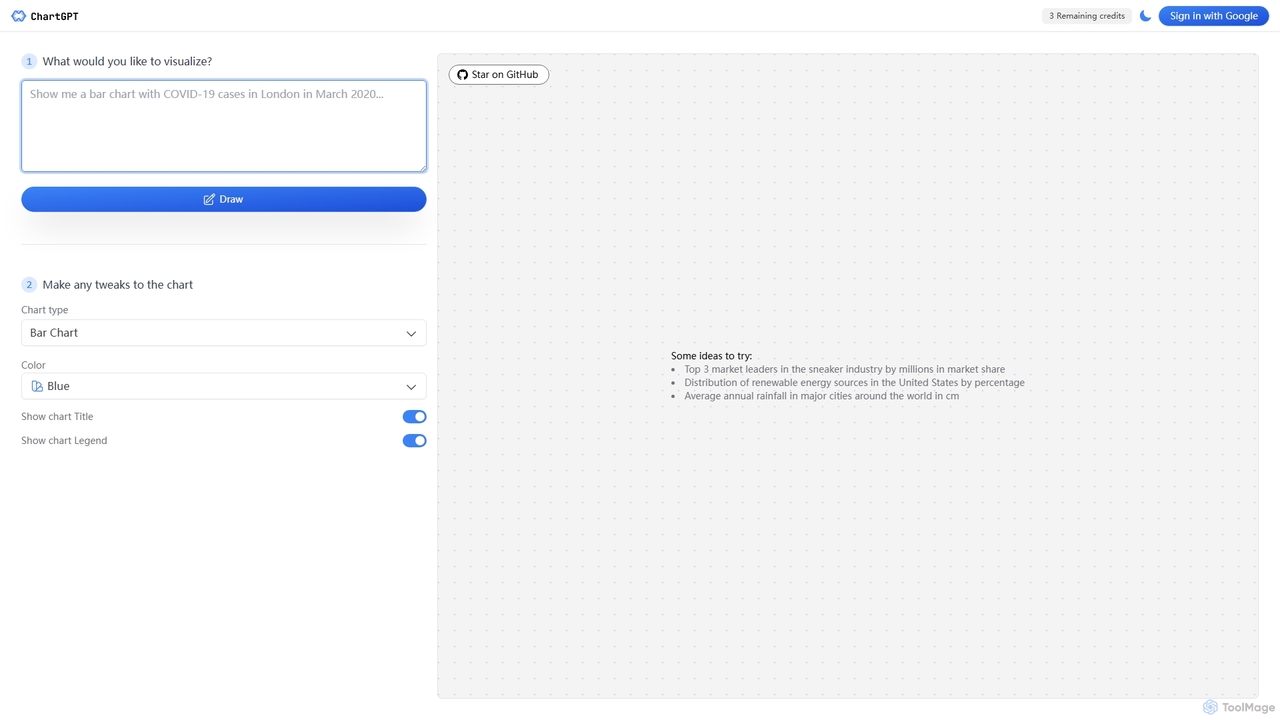
ChartGPT
ChartGPT is an AI-powered tool that transforms natural language text prompts into a wide variety of stunning charts …
ChartGPT is an AI-powered tool that transforms natural language text prompts into a wide variety of stunning charts and graphs. Simply describe the data you want to visualize, and ChartGPT instantly generates customizable charts, making data visualization accessible to everyone, regardless of technical skill.
SlickAlgo
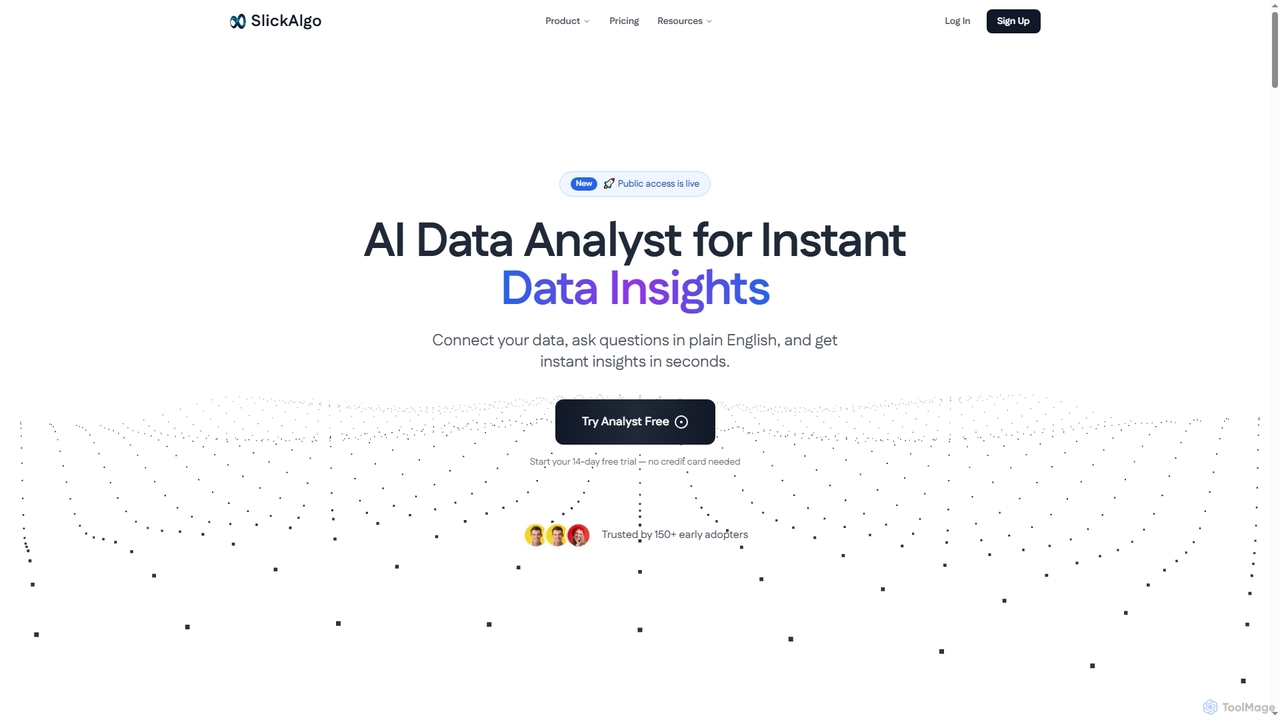
SlickAlgo is an AI data analyst platform that transforms natural language questions into instant data insights, Python code, …
SlickAlgo is an AI data analyst platform that transforms natural language questions into instant data insights, Python code, and interactive dashboards. It connects to over 50 data sources, enabling businesses to make data-driven decisions without coding.

Viewit Ai Chatbot
An AI-powered chatbot that transforms your data into insightful visualizations and summaries through simple, natural language conversations. Upload …
An AI-powered chatbot that transforms your data into insightful visualizations and summaries through simple, natural language conversations. Upload your dataset, ask questions, and instantly receive charts, graphs, and key metrics, making data analysis accessible to everyone without needing complex software or coding skills.
ChartGen
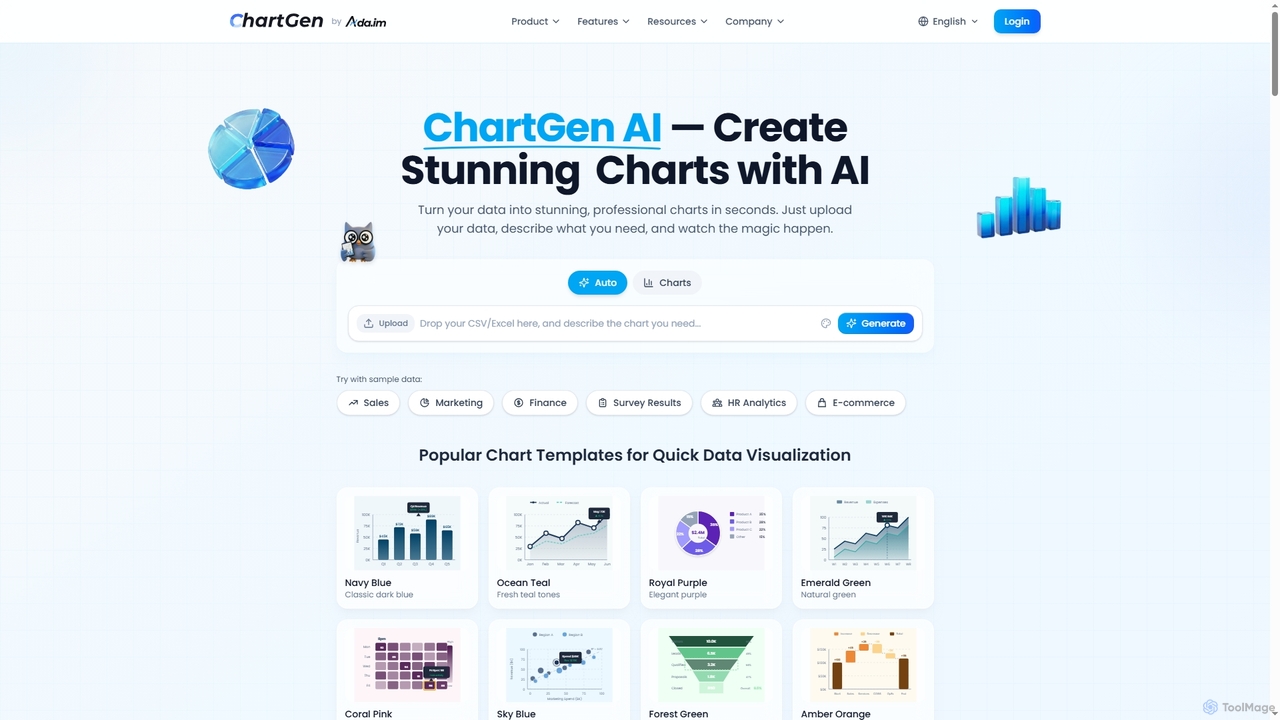
ChartGen is an AI-powered chart generator that transforms raw data into stunning, professional visualizations in seconds. Users simply …
ChartGen is an AI-powered chart generator that transforms raw data into stunning, professional visualizations in seconds. Users simply upload CSV or Excel files, describe their desired chart in plain English, and the AI instantly creates various chart types like bar, line, and pie charts. It's designed for quick, effortless data visualization without requiring design or coding skills.
Powerdrill
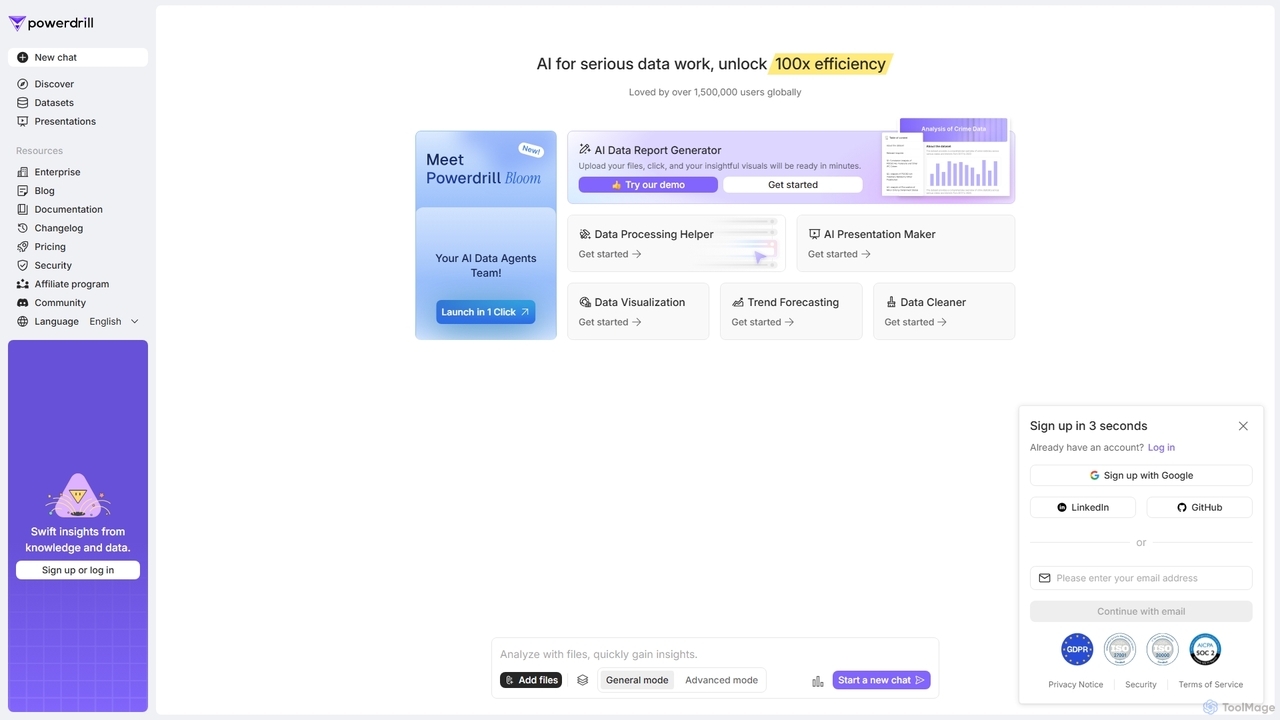
Powerdrill is an AI-powered data analysis platform designed for serious data work, enabling users to unlock 100x efficiency. …
Powerdrill is an AI-powered data analysis platform designed for serious data work, enabling users to unlock 100x efficiency. It automates the entire process from data processing and cleaning to visualization, report generation, and trend forecasting. Simply upload your files (Excel, CSV, PDF) or connect to a database, and let the AI generate actionable insights, interactive charts, and comprehensive presentations in minutes.
ChatwithData
ChatwithData is a powerful AI tool designed for interactive document analysis. It allows users to upload various file …
ChatwithData is a powerful AI tool designed for interactive document analysis. It allows users to upload various file types, including PDFs, Word, CSV, Excel, and SQL databases, and extract insights using natural language queries. Its features have now been integrated and enhanced within the AI Chat platform.
Komo
Komo is an AI-powered research companion that revolutionizes information discovery. It integrates advanced web search, knowledge browsing, and …
Komo is an AI-powered research companion that revolutionizes information discovery. It integrates advanced web search, knowledge browsing, and AI assistance, providing access to top models like DeepSeek, GPT, Claude, and Gemini. Features include AI-driven search, chat, mind mapping, and fact-checking to help users efficiently research topics, explain concepts, and gain deeper insights.
Infografix
Infografix is an AI-powered infographic generator that transforms simple text prompts into professional-quality visuals. Create stunning charts, diagrams, …
Infografix is an AI-powered infographic generator that transforms simple text prompts into professional-quality visuals. Create stunning charts, diagrams, mind maps, and timelines in seconds without any design skills. Available on web and mobile, it's perfect for marketers, students, and professionals who need to visualize data quickly and effectively.
AskNews
AskNews is an AI-powered news intelligence platform providing high-quality, licensed global news data through a powerful API. It …
AskNews is an AI-powered news intelligence platform providing high-quality, licensed global news data through a powerful API. It offers enriched news analytics, a conversational AI for insights, and monetization tools for publishers. Ideal for developers, analysts, and researchers needing reliable, structured, and real-time news information.
Metatable
Metatable is an AI-powered data assistant that revolutionizes how you interact with spreadsheets and tabular data. Simply use …
Metatable is an AI-powered data assistant that revolutionizes how you interact with spreadsheets and tabular data. Simply use natural language prompts to clean, analyze, transform, and visualize your data instantly. It eliminates complex formulas and manual tasks, making data analysis accessible to everyone, from data analysts to business managers.
ChartGPT Category
ChartGPT Tag
ChartGPT Applicable Job
ChartGPT AI Tool Comparison
ChartGPT Embed Feature
Just copy the embed code below and paste this beautiful badge on your blog, article, or official app website to drive traffic directly to this tool's detail page and quickly boost your exposure and user count!

No comments yet, be the first to comment!