Graphy
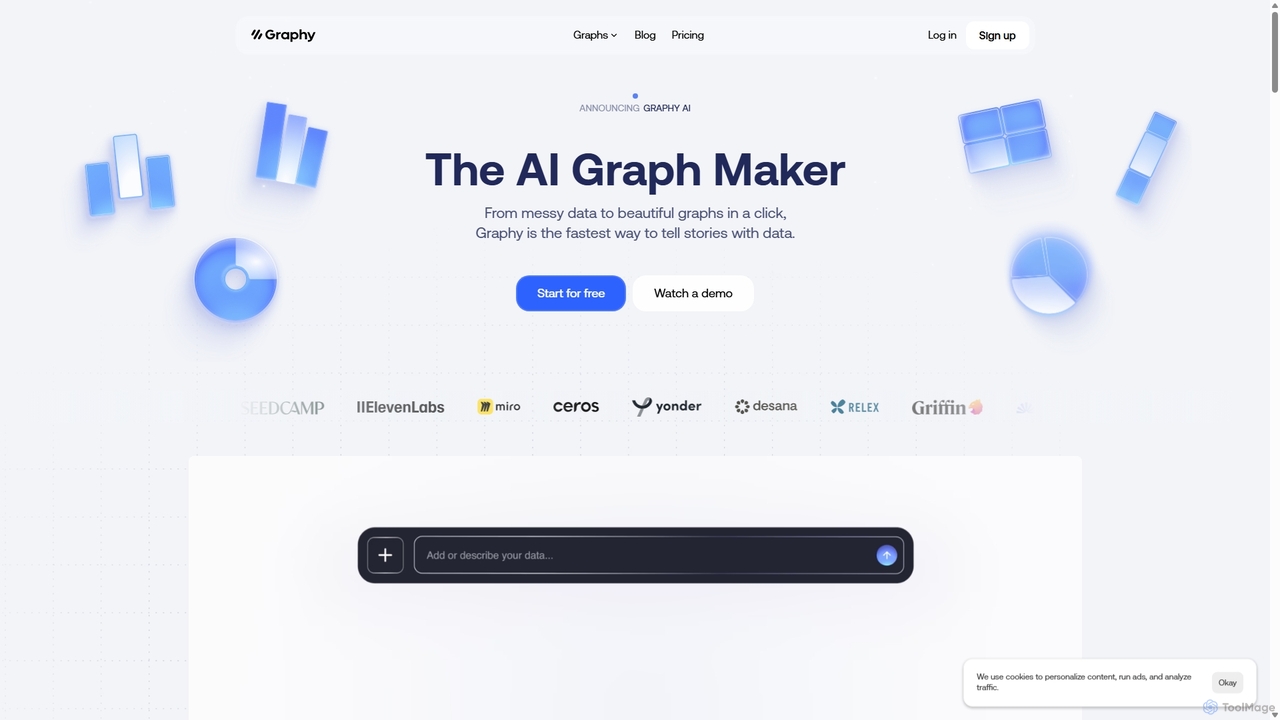
Graphy is an AI-powered data visualization tool that transforms raw data into beautiful, interactive charts and graphs in …
Graphy is an AI-powered data visualization tool that transforms raw data into beautiful, interactive charts and graphs in seconds. It simplifies data storytelling by automatically identifying key insights, allowing users to chat with their data, and offering extensive customization. Ideal for marketers, analysts, and teams who need to create compelling visual reports and presentations without complex software.
ChartGPT
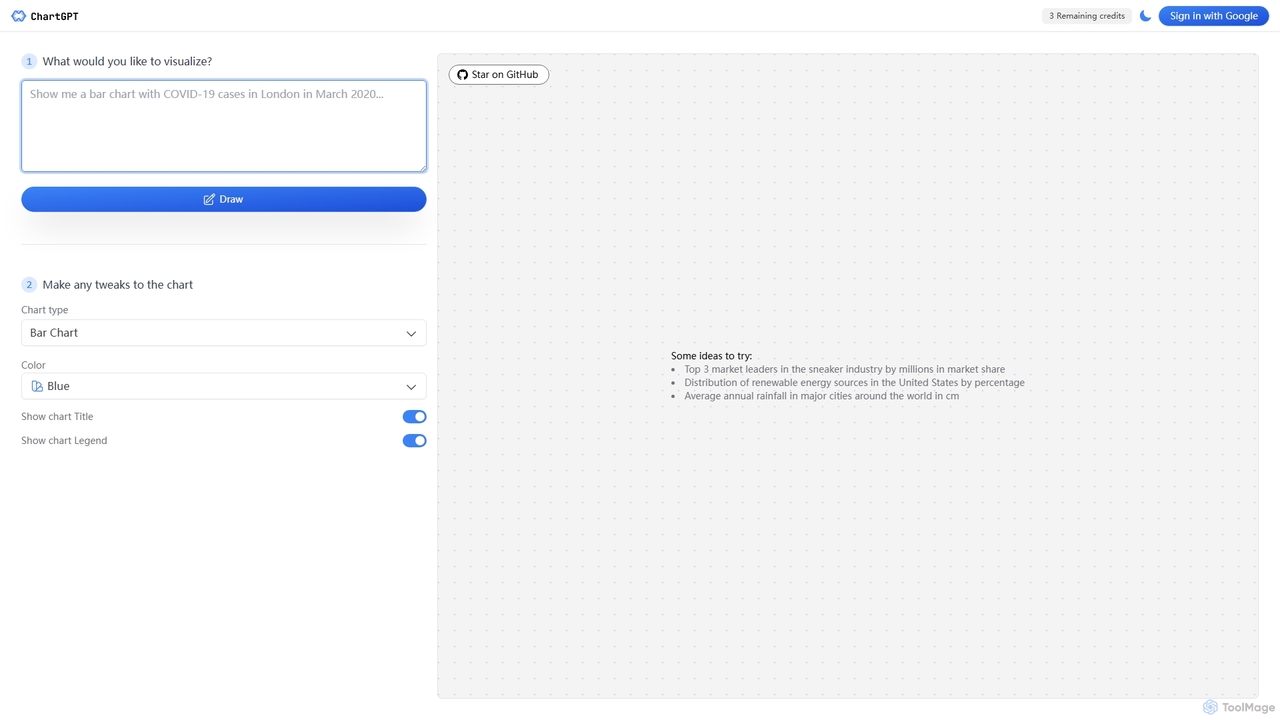
ChartGPT is an AI-powered tool that transforms natural language text prompts into a wide variety of stunning charts …
ChartGPT is an AI-powered tool that transforms natural language text prompts into a wide variety of stunning charts and graphs. Simply describe the data you want to visualize, and ChartGPT instantly generates customizable charts, making data visualization accessible to everyone, regardless of technical skill.
ChartGPT
ChartGPT is an AI-powered tool that transforms natural language prompts and raw data into stunning, customizable charts and …
ChartGPT is an AI-powered tool that transforms natural language prompts and raw data into stunning, customizable charts and graphs. Effortlessly create complex visualizations like bar charts, line graphs, and pie charts without any coding, simply by describing what you want to see.
CalcGen AI
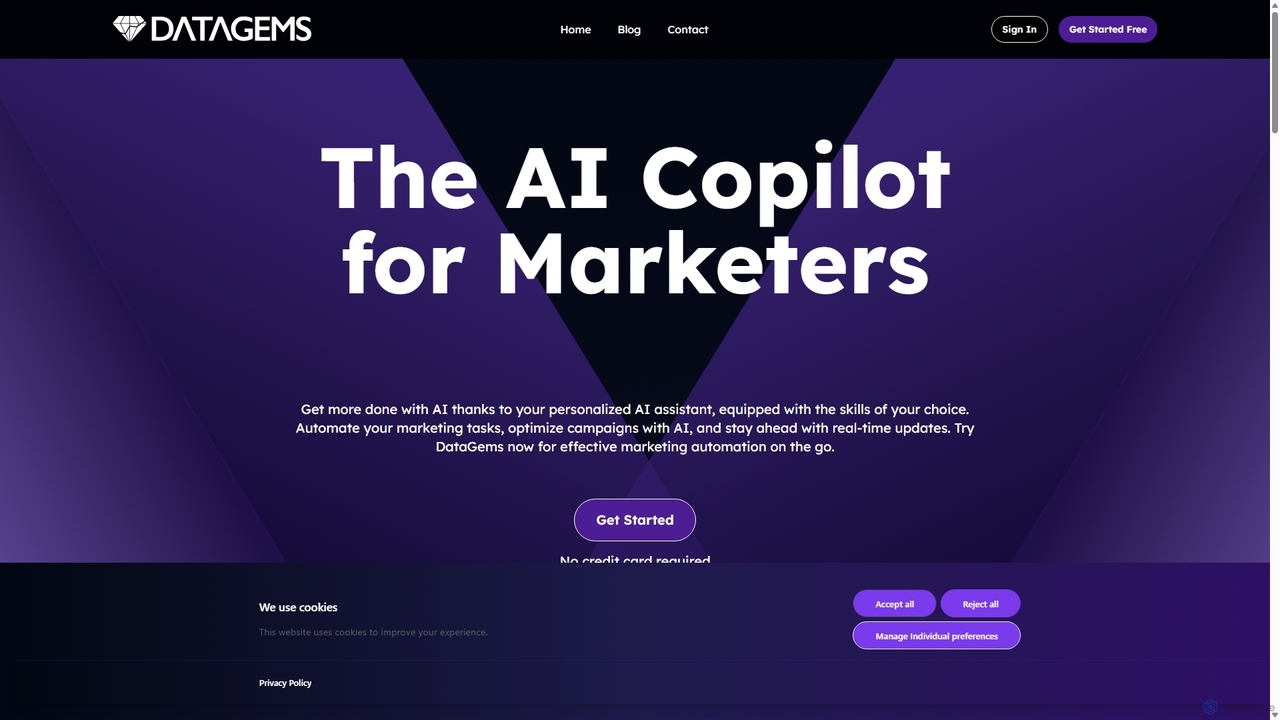
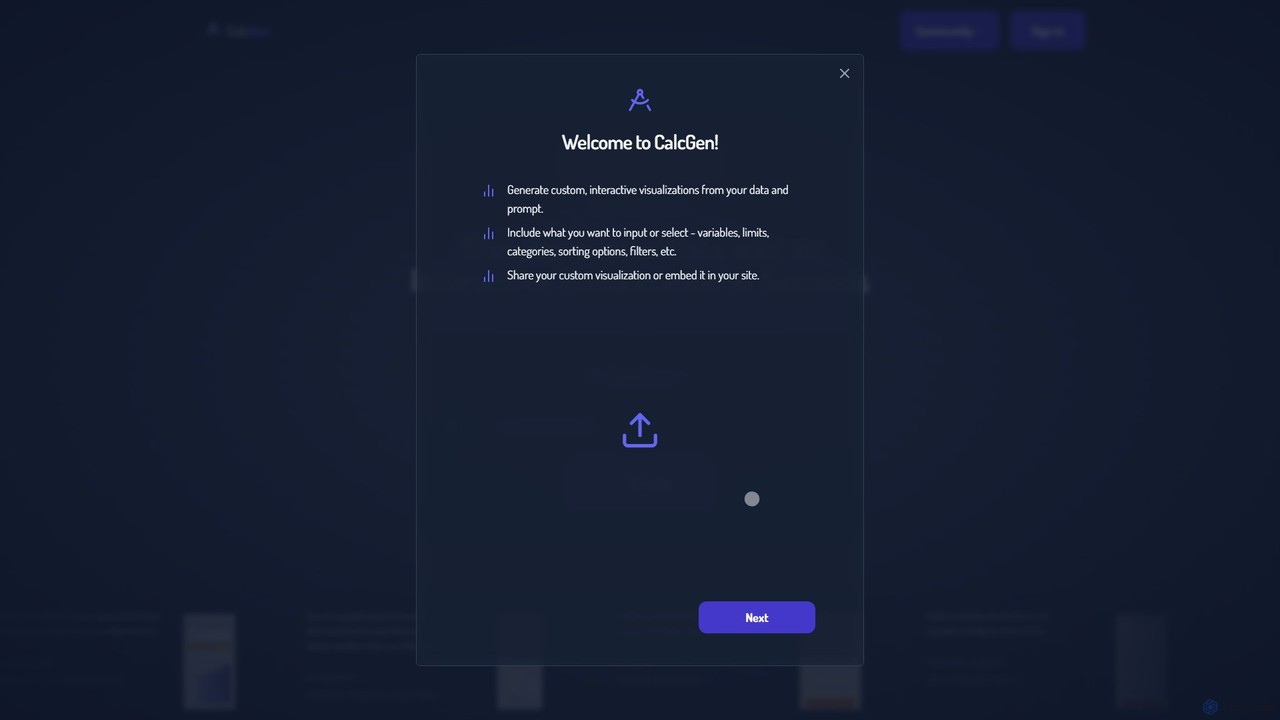
CalcGen AI is a no-code platform that transforms natural language prompts into interactive calculators, charts, and data visualizations. …
CalcGen AI is a no-code platform that transforms natural language prompts into interactive calculators, charts, and data visualizations. Effortlessly create custom tools for finance, science, business, and more, simply by describing what you need. Upload your data or provide parameters to generate embeddable widgets in seconds.
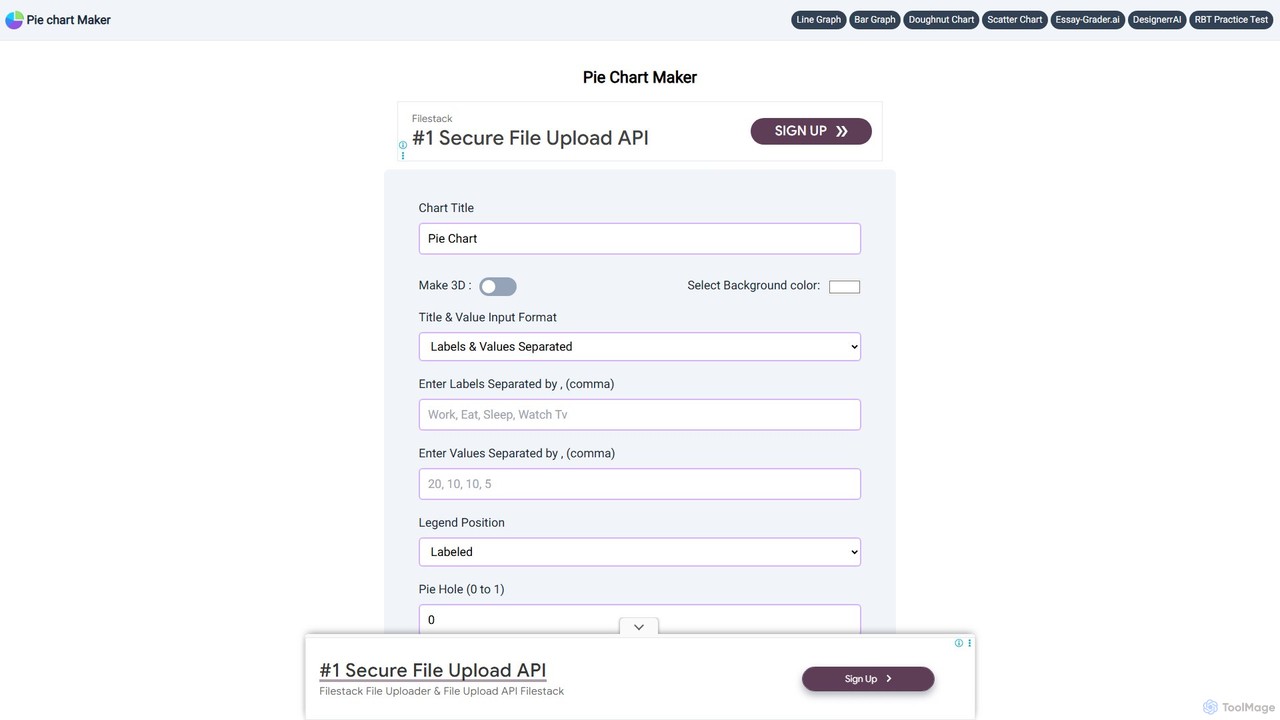
Pie Chart Maker
A free, user-friendly online tool for creating beautiful and customizable pie charts, doughnut charts, and line graphs in …
A free, user-friendly online tool for creating beautiful and customizable pie charts, doughnut charts, and line graphs in just a few clicks. Instantly visualize your data by simply entering labels and values, and download your charts in various formats like PNG, JPEG, and SVG.
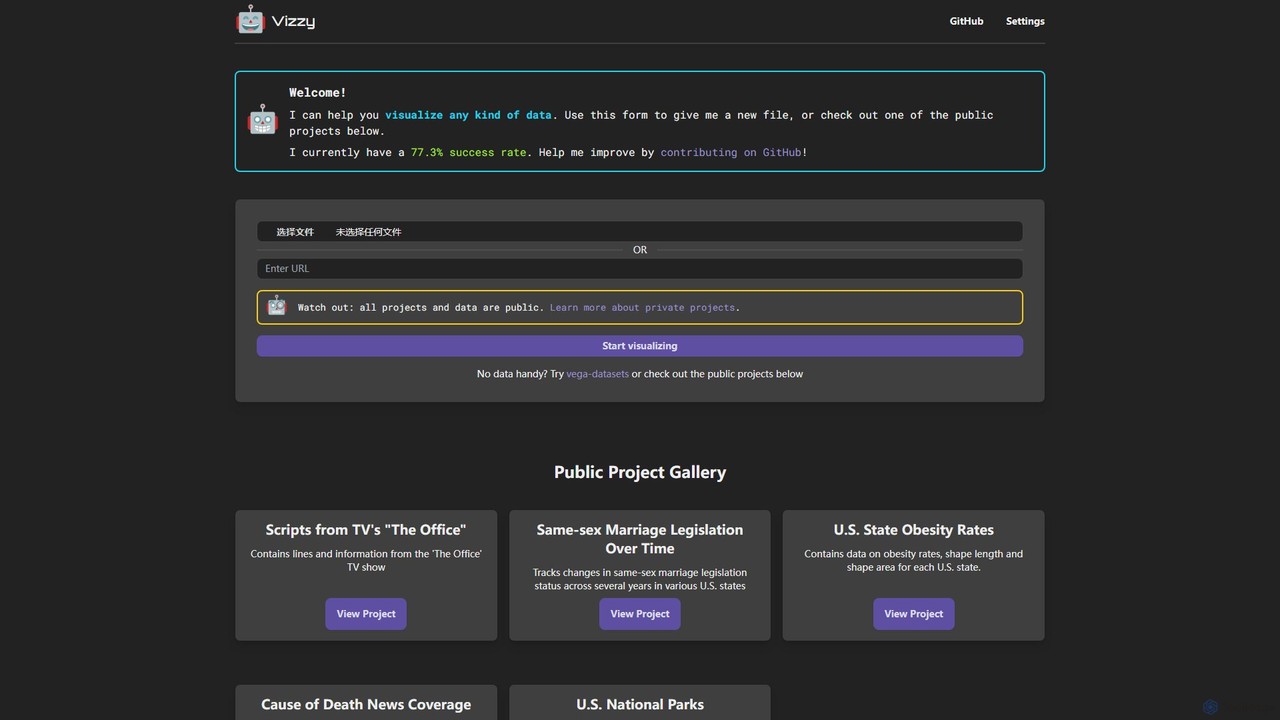
Vizzy
Vizzy is an AI-powered tool that leverages Large Language Models (LLMs) for rapid data visualization. Simply upload your …
Vizzy is an AI-powered tool that leverages Large Language Models (LLMs) for rapid data visualization. Simply upload your data file, and Vizzy's AI will analyze it to automatically generate insightful charts, graphs, and maps. It's a no-code, open-source platform designed to make data analysis accessible to everyone, from researchers to business analysts. Explore public datasets or visualize your own, turning raw numbers into clear visuals in seconds.
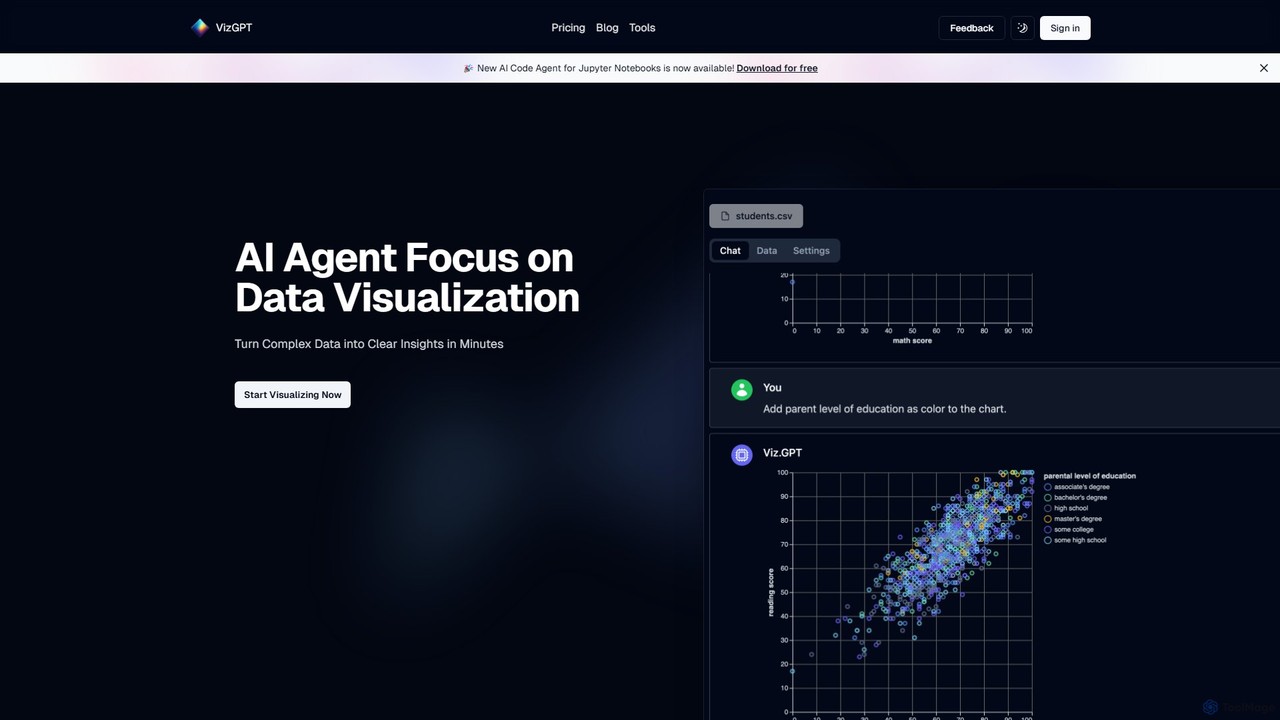
vizGPT
vizGPT is an AI-powered data visualization tool that transforms complex data into clear insights using natural language. Simply …
vizGPT is an AI-powered data visualization tool that transforms complex data into clear insights using natural language. Simply ask questions in plain English to generate charts and graphs instantly, without any coding. It supports various data sources and offers both a conversational interface and a no-code drag-and-drop editor, making data analysis accessible to everyone.