
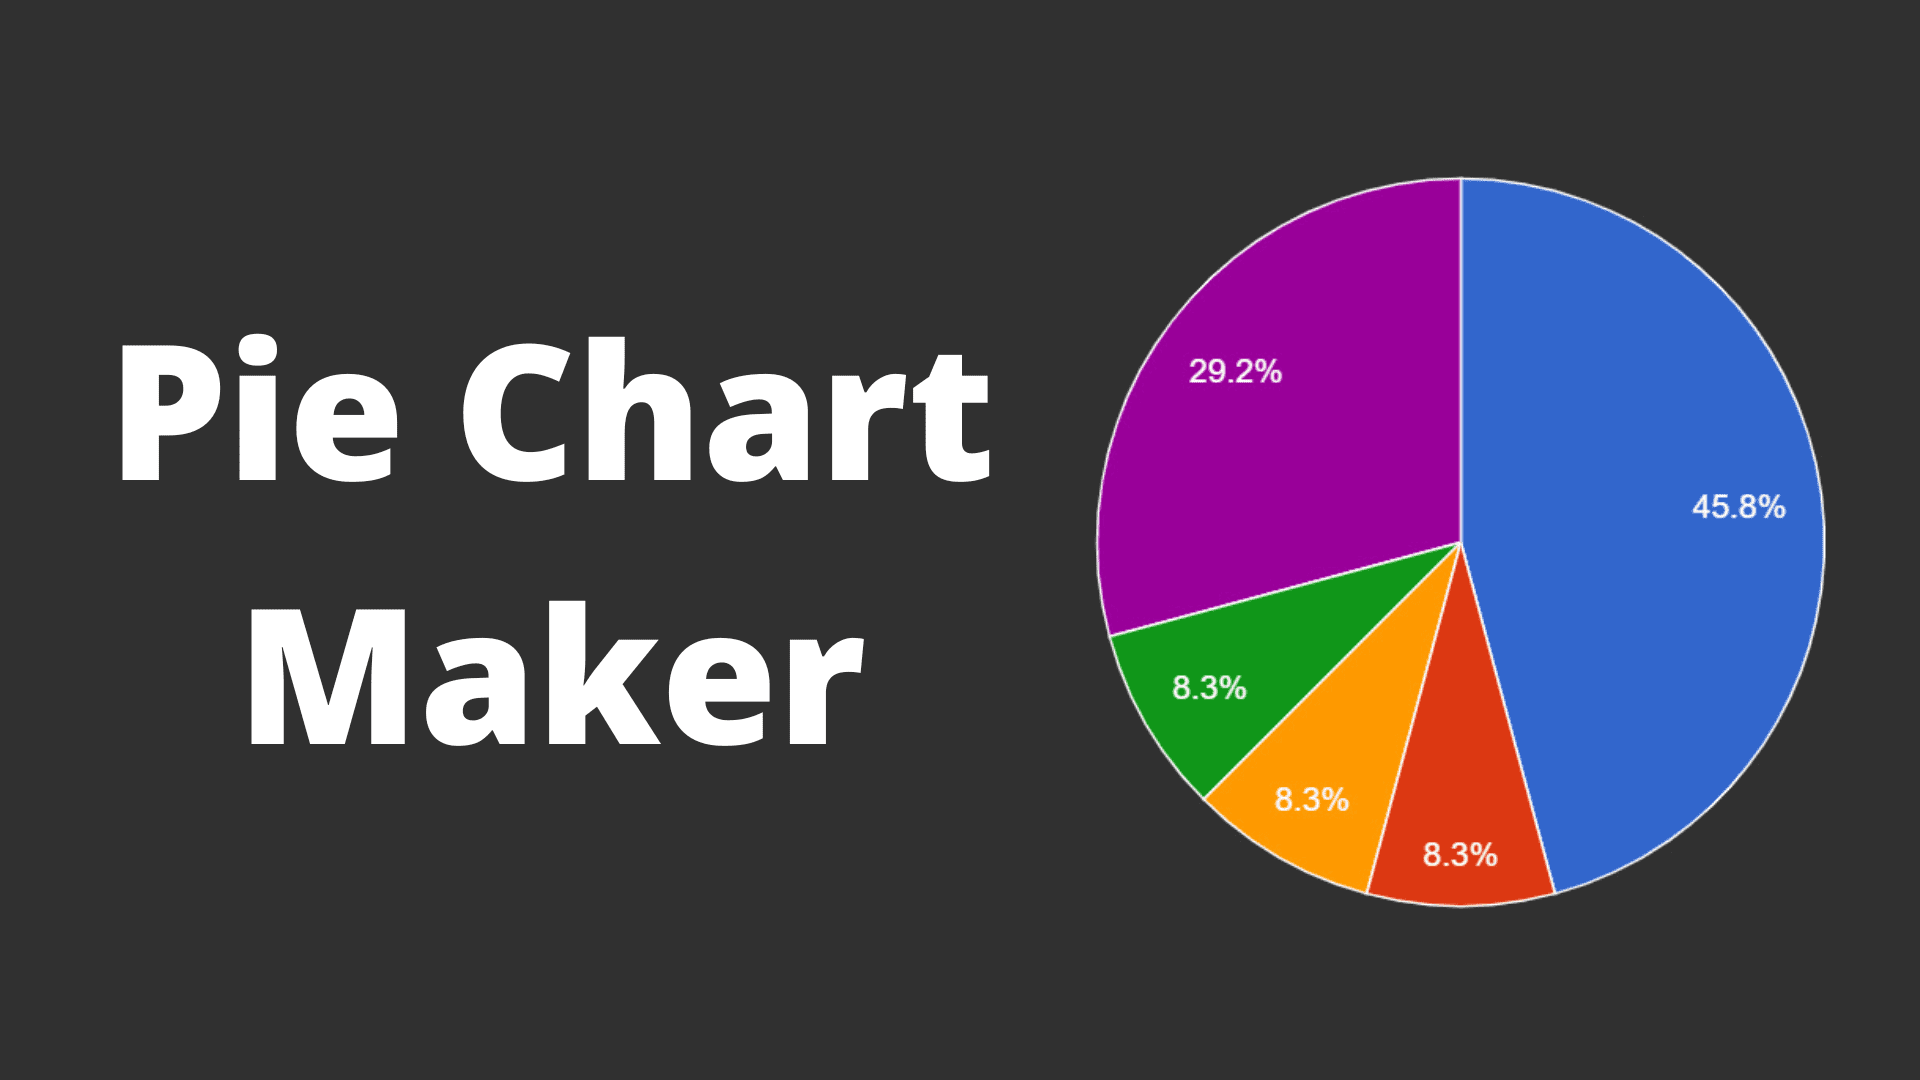
Pie Chart Maker Overview
Pie Chart Maker is a dedicated online tool designed to transform raw data into captivating and easy-to-understand visual narratives. Founded in 2020 by a group of data enthusiasts, the platform was created to bridge the gap between complex data and clear understanding, making data visualization accessible to everyone. It eliminates the need for complex, traditional applications by offering an intuitive, web-based interface that allows users to generate professional-looking charts in seconds. Whether you're a student working on a project, a professional preparing a report, or a blogger looking to enhance your content, Pie Chart Maker provides the essential tools to communicate your insights effectively.
The platform supports the creation of not only standard pie charts but also doughnut charts and line graphs, offering flexibility for different data representation needs. The core philosophy is simplicity and accessibility; users can create and customize charts without any prior design or technical experience. The entire process is streamlined to be as efficient as possible, from data entry to final download.
How to use Pie Chart Maker
Using Pie Chart Maker is a straightforward process that requires just a few simple steps:
- Select Chart Type: Navigate to the desired chart maker on the website, such as the Pie Chart Maker or Line Graph Maker.
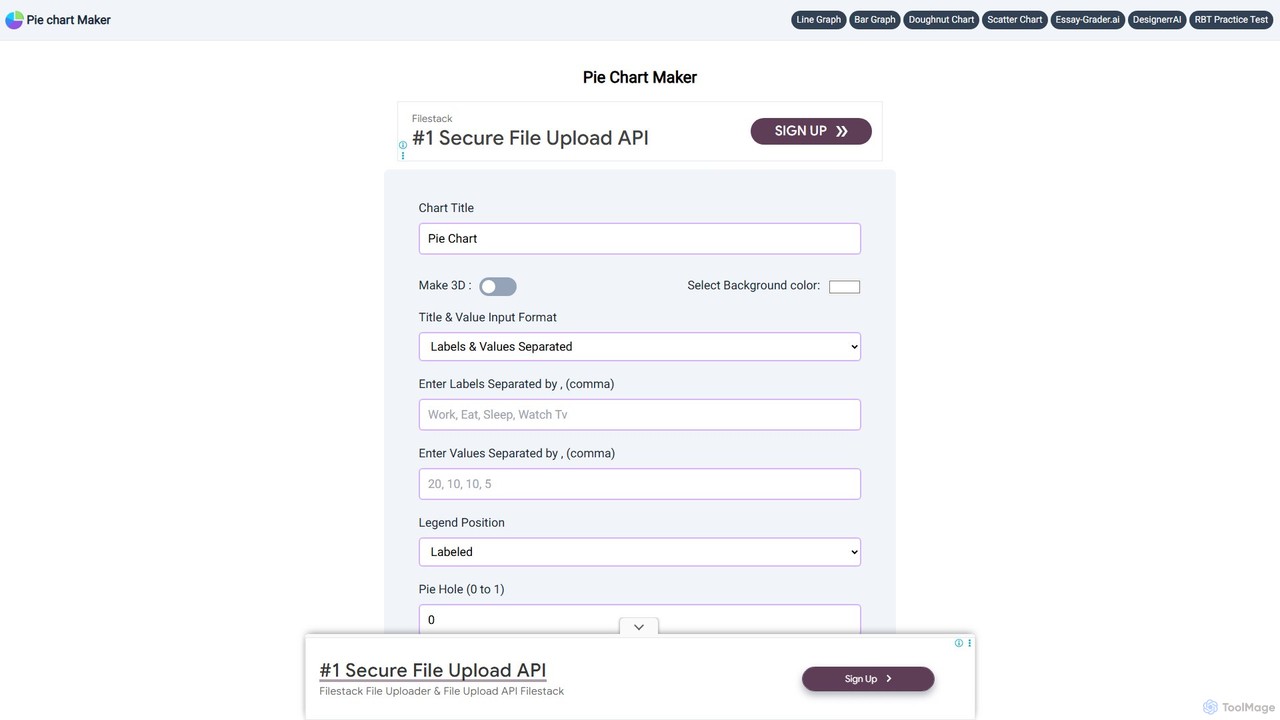
- Enter Data: Input your data into the provided fields. For pie and line charts, you'll enter the 'Labels' (e.g., Work, Eat, Sleep) and 'Values' (e.g., 8, 2, 7) in separate text boxes, with each item separated by a comma.
- Customize Your Chart: Tailor the visual appearance of your chart. You can add a 'Chart Title', choose a background color, and select specific colors for the title text and legend font.
- Fine-Tune the Details: The tool offers specific options for each chart type. For pie charts, you can enable a '3D' effect, adjust the 'Pie Hole' to create a doughnut chart, change the legend position (Top, Bottom, Left, Right, or None), and decide what text appears on each slice (Percentage, Value, or Label). You can also rotate the chart for better presentation. For line graphs, you can set titles for the vertical and horizontal axes and choose between a straight or curved line style.
- Generate and Download: Once you've configured your options, click the 'Generate Graph' button to see a live preview. If you're satisfied with the result, you can download the chart in high-quality PNG, JPEG, or SVG formats with a single click.
Core Features of Pie Chart Maker
- Multiple Chart Types: Create classic pie charts, modern doughnut charts, and informative line graphs.
- Intuitive Data Input: Simply enter comma-separated labels and values to populate your chart.
- Extensive Customization: Adjust background colors, title colors, legend colors, and font styles to match your branding or presentation theme.
- 3D Pie Charts: Add depth to your pie charts with a single-click 3D effect.
- Doughnut Chart Creation: Easily convert a pie chart into a doughnut chart by adjusting the 'Pie Hole' setting.
- Flexible Legend Positioning: Place the legend at the top, bottom, left, or right of the chart, or hide it completely.
- Data Label Options: Display percentages, raw values, or category labels directly on the pie slices for clarity.
- Chart Rotation: Rotate the pie chart to the exact angle you need for optimal visual appeal.
- Vector and Raster Downloads: Export your finished charts as high-resolution PNG, JPEG, or scalable SVG files, suitable for both web and print.
- Completely Free: The tool is 100% free to use, with no hidden fees, subscriptions, or sign-ups required.
Use Cases for Pie Chart Maker
Pie Chart Maker is a versatile tool suitable for a wide range of applications:
- Education: Students can use it to create visuals for homework, school projects, and presentations, helping to illustrate survey results, time management breakdowns, or scientific data.
- Business and Marketing: Professionals can quickly generate charts for reports, presentations, and dashboards to show market share, budget allocations, sales distribution by region, or customer demographics.
- Content Creation: Bloggers, journalists, and social media managers can create engaging infographics and visual aids to make their articles and posts more compelling and easier to digest.
- Personal Finance: Individuals can visualize their monthly expenses, investment portfolio distribution, or savings goals.
- Research: Researchers can use it for preliminary data analysis to represent proportions and distributions in small datasets.
Advantages of Pie Chart Maker
The primary advantage of Pie Chart Maker is its combination of simplicity, speed, and power. Unlike heavyweight software like Excel or dedicated data analysis platforms, it focuses on doing one thing exceptionally well: creating beautiful charts quickly. It's entirely web-based, meaning no downloads or installations are necessary. The tool is free, making it accessible to everyone, regardless of budget. The ability to download in SVG format is a significant plus for professionals who need scalable graphics for high-quality designs and print materials.
Pricing and Plans
Pie Chart Maker is completely free to use. The founders are committed to keeping data visualization accessible to all, and as such, there are no subscription plans, usage limits, or premium features hidden behind a paywall. All functionalities, including customization options and high-resolution downloads, are available to every user at no cost.
Traffic
Latest traffic
Status
Monthly traffic trend
- 2025-9: 68.2K
- 2026-1: 46.6K
- 2026-2: 69.0K
- 2026-3: 50.8K
- 2026-4: 54.9K
- 2026-5: 50.0K
Geography
Top 5 countries / regions
- 🇺🇸United States57.0%
- 🇵🇭Philippines12.3%
- 🇬🇧United Kingdom12.0%
- 🇮🇳India9.4%
- 🇮🇩Indonesia9.3%
Traffic sources
| Source type | Percentage |
|---|---|
Direct | 80.1% |
Referral | 14.3% |
Email | 5.5% |
Top keywords
| Keyword | Cost per click |
|---|---|
| pie chart | $1.75 |
| pie chart creator | $0.80 |
| pie chart generator | $0.67 |
| pie chart maker | $0.70 |
| pie graph maker | $0.44 |
Pie Chart Maker Alternatives
Line Graph Maker
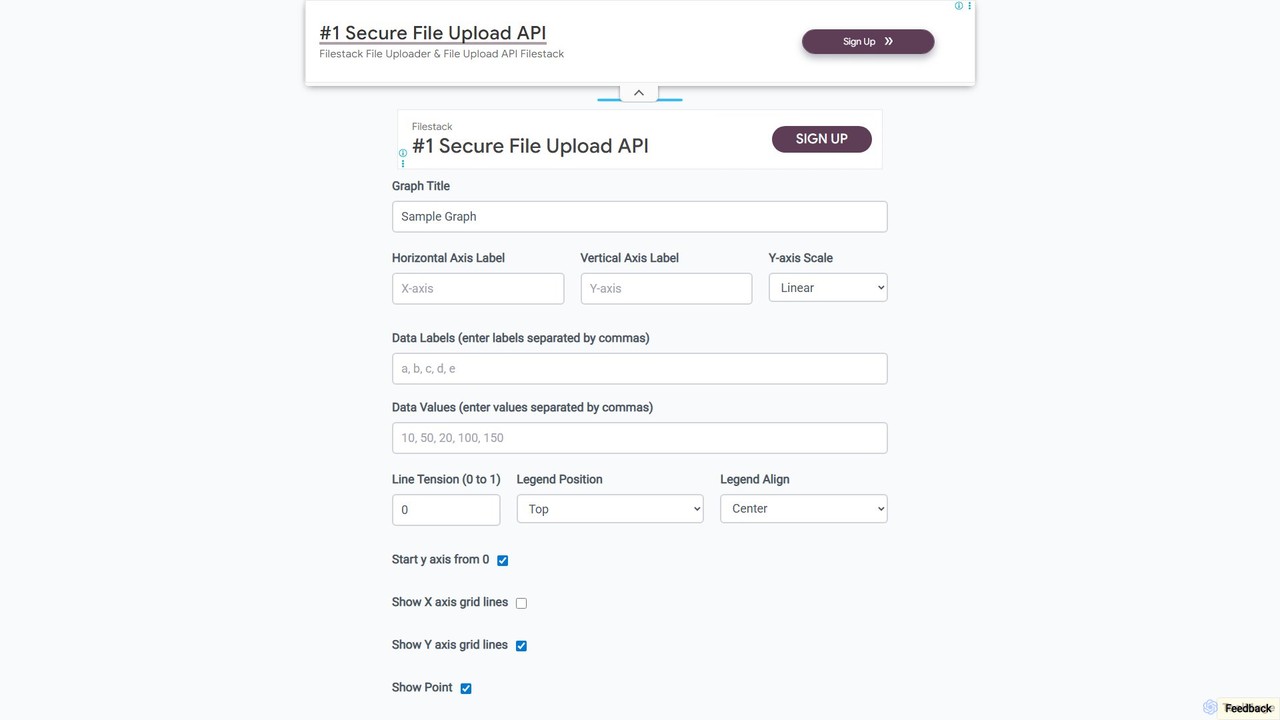
A free, web-based tool for instantly creating custom line and bar graphs. Input your data, customize labels, colors, and styles, then download your chart in PNG, JPG, or SVG format. Ideal for students, educators, and professionals for quick data visualization.
Charts & Graphs
Infografix
Infografix is an AI-powered infographic generator that transforms simple text prompts into professional-quality visuals. Create stunning charts, diagrams, mind maps, and timelines in seconds without any design skills. Available on web and mobile, it's perfect for marketers, students, and professionals who need to visualize data quickly and effectively.
Infographics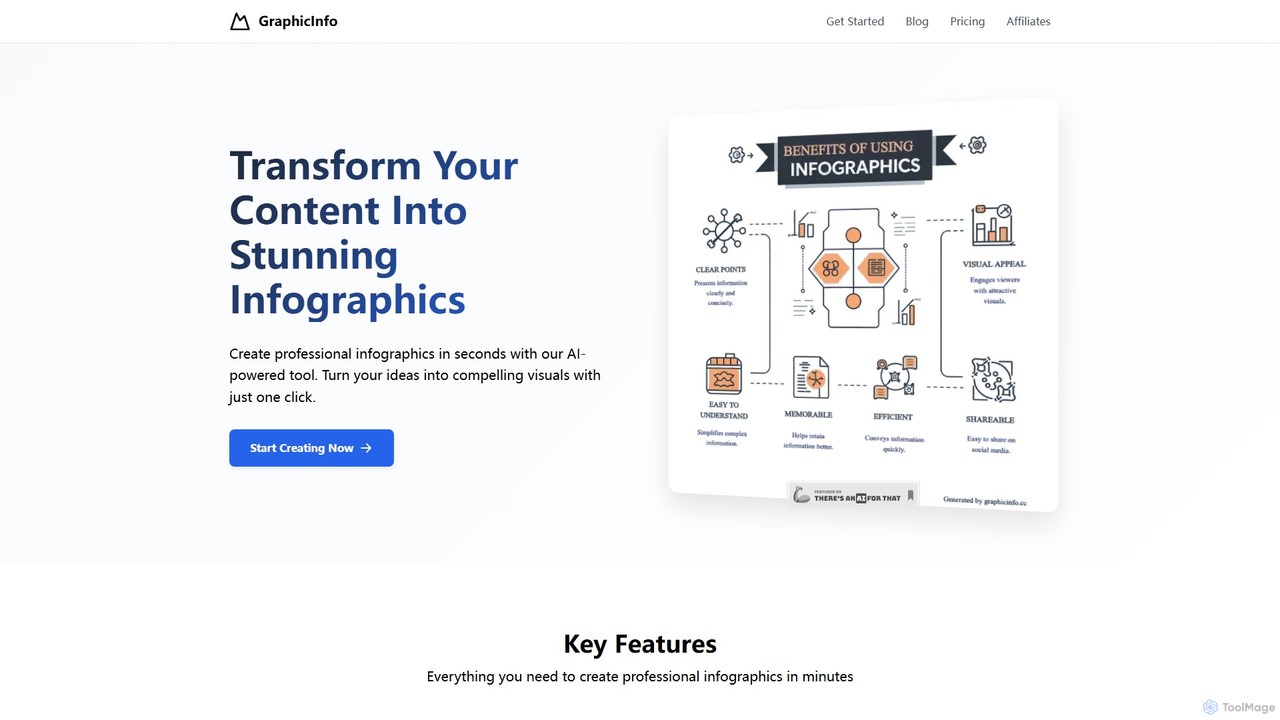
graphicinfo
graphicinfo is an AI-powered infographic generator that transforms your text and ideas into stunning, professional visuals in seconds. With just one click, create customizable, data-rich infographics for marketing, education, and business, no design skills required.
Infographics
Autoppt
Autoppt is an AI-powered presentation generator that creates stunning PowerPoint slides in seconds. Simply provide a topic or upload a document (PDF, Word, etc.), and Autoppt will instantly generate a professional, fully-editable presentation using its vast library of templates. It's designed for users of all skill levels to save time and effort on creating visually appealing slideshows.
Student Tools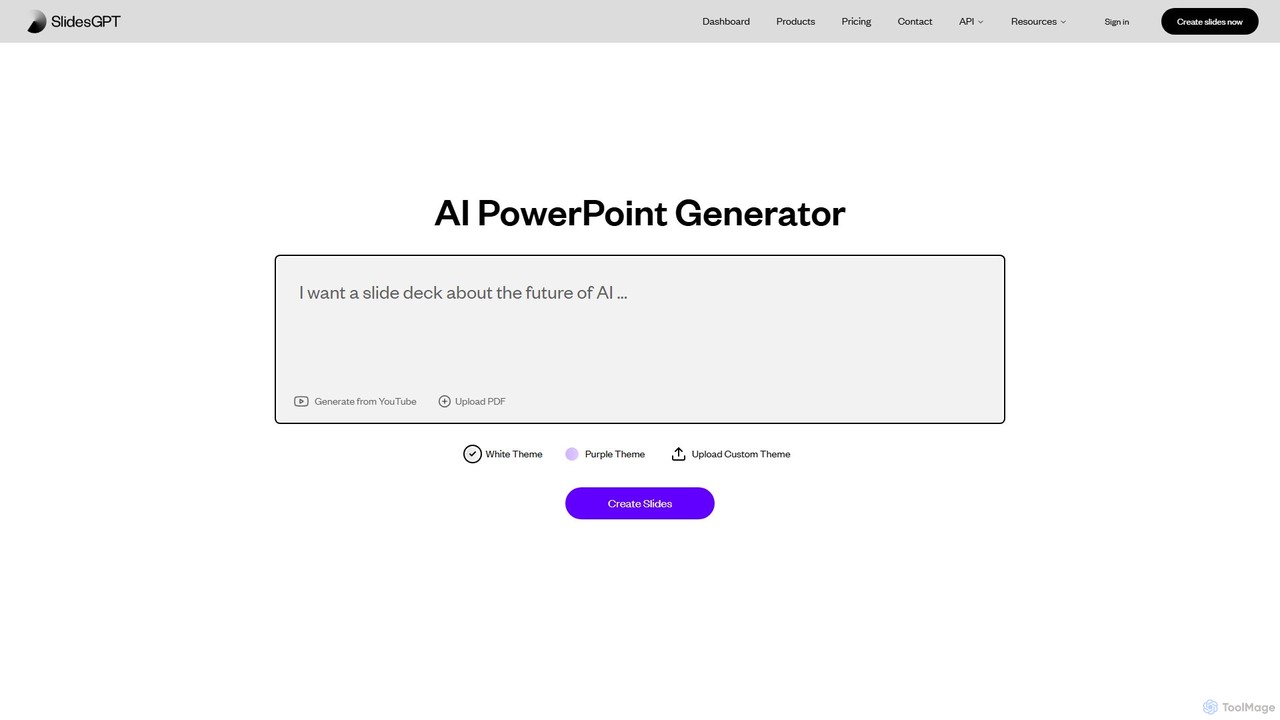
SlidesGPT
SlidesGPT is an AI-powered presentation generator that creates professional PowerPoint and Google Slides presentations from text, prompts, PDFs, or YouTube videos. It automates the slide creation process, saving users hours of work and enabling them to produce engaging slideshows 10x faster.
SalesPie Chart Maker Categories
Pie Chart Maker Embed Widget
Copy this embed code to place the badge on your blog, article, or product site and send readers directly to this ToolMage detail page.

Related AI tools
Graphy
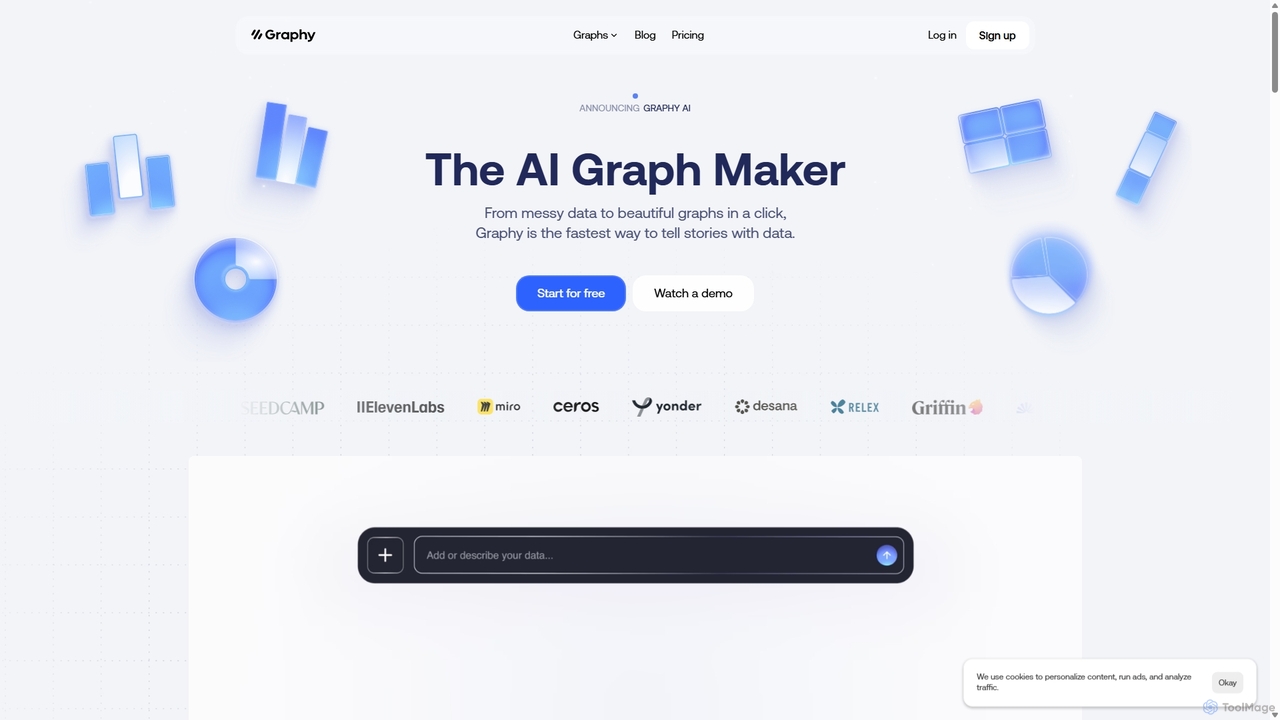
Graphy is an AI-powered data visualization tool that transforms raw data into beautiful, interactive charts and graphs in seconds. It simplifies data storytelling by automatically identifying key insights, allowing users to chat with their data, and offering extensive customization. Ideal for marketers, analysts, and teams who need to create compelling visual reports and presentations without complex software.
3D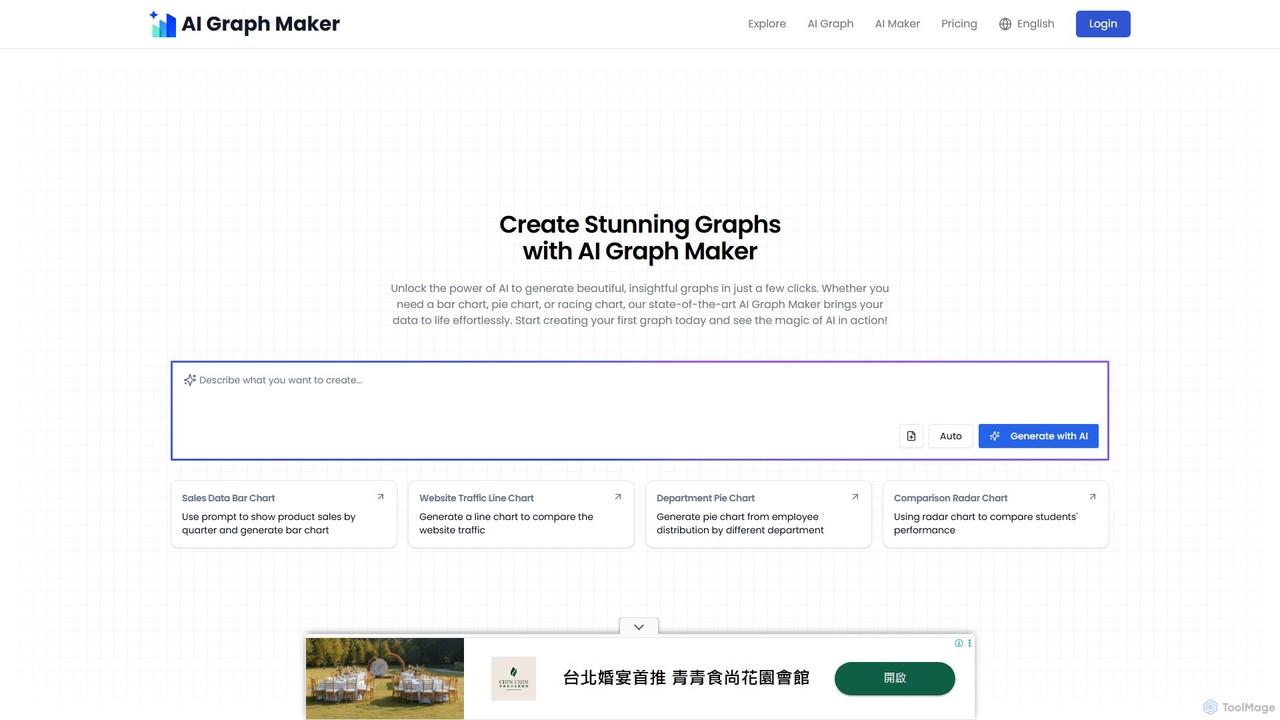
aigraphmaker
aigraphmaker is an AI-powered platform that transforms raw data and text prompts into a wide variety of professional and interactive charts and diagrams. It enables users, from beginners to experts, to effortlessly create stunning visualizations like bar charts, mind maps, flowcharts, and knowledge graphs in seconds, without any coding or design skills required.
Analytics
Jyek
Jyek is an AI agent platform that understands objectives, creates execution plans, uses tools, and delivers verifiable results for complex, multi-step tasks.
Automation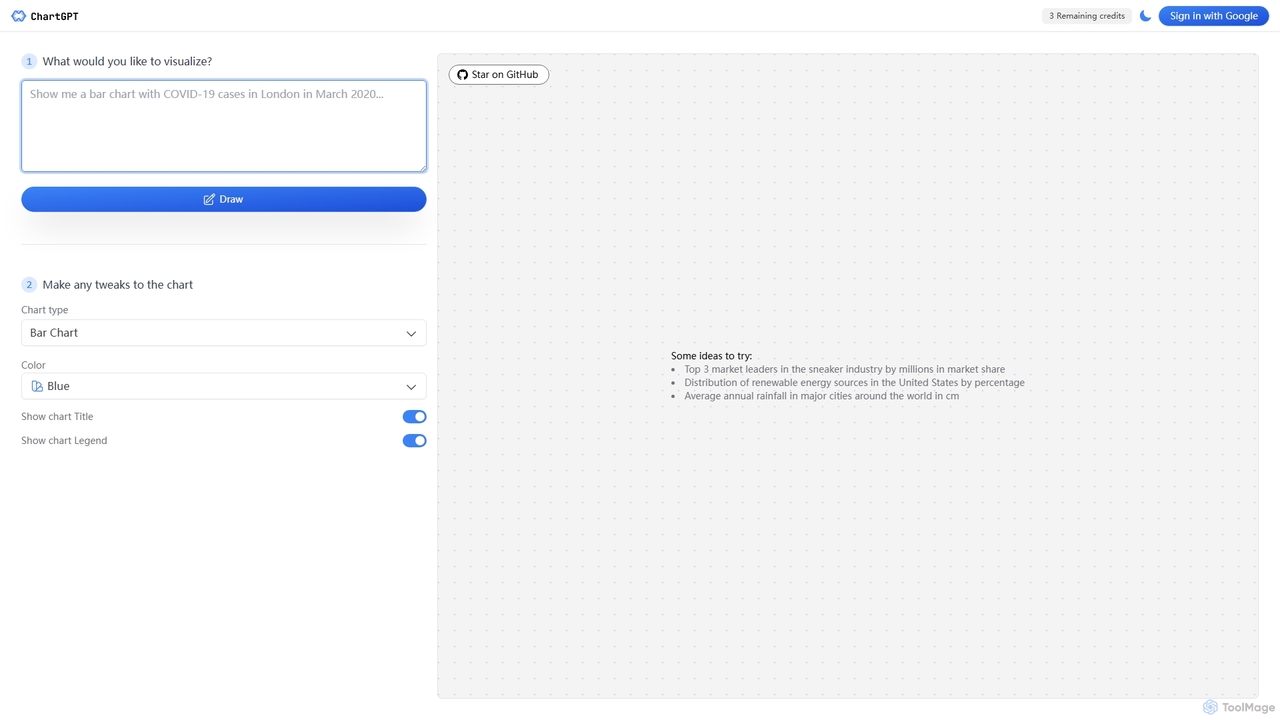
ChartGPT
ChartGPT is an AI-powered tool that transforms natural language text prompts into a wide variety of stunning charts and graphs. Simply describe the data you want to visualize, and ChartGPT instantly generates customizable charts, making data visualization accessible to everyone, regardless of technical skill.
Business Intelligence
ChartGPT
ChartGPT is an AI-powered tool that transforms natural language prompts and raw data into stunning, customizable charts and graphs. Effortlessly create complex visualizations like bar charts, line graphs, and pie charts without any coding, simply by describing what you want to see.
Infographics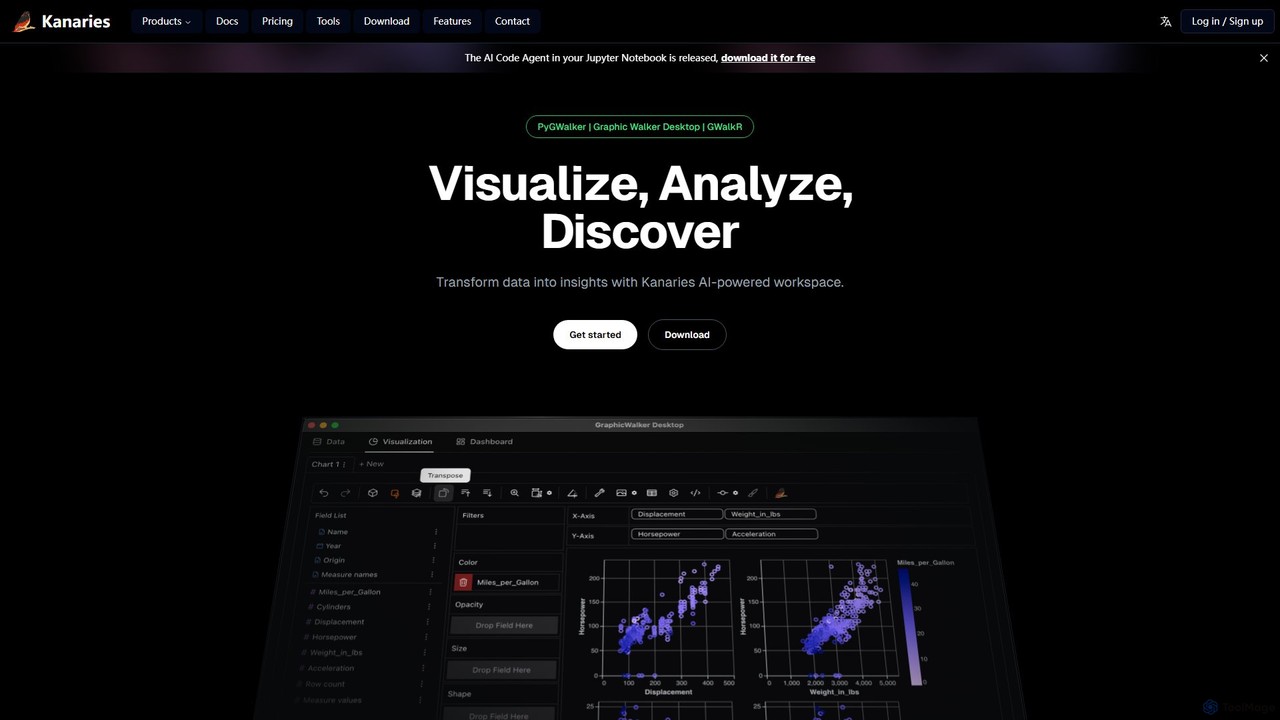
Kanaries
Kanaries is an AI-powered workspace designed for exploratory data analysis (EDA) and visualization. It offers a suite of tools, including PyGWalker for Python and GWalkR for R, that transform dataframes into interactive visual analytics applications with a single line of code. It features a drag-and-drop interface, AI-powered chat for data querying, and collaborative features, streamlining the entire data-to-insight workflow for analysts, data scientists, and developers.
3D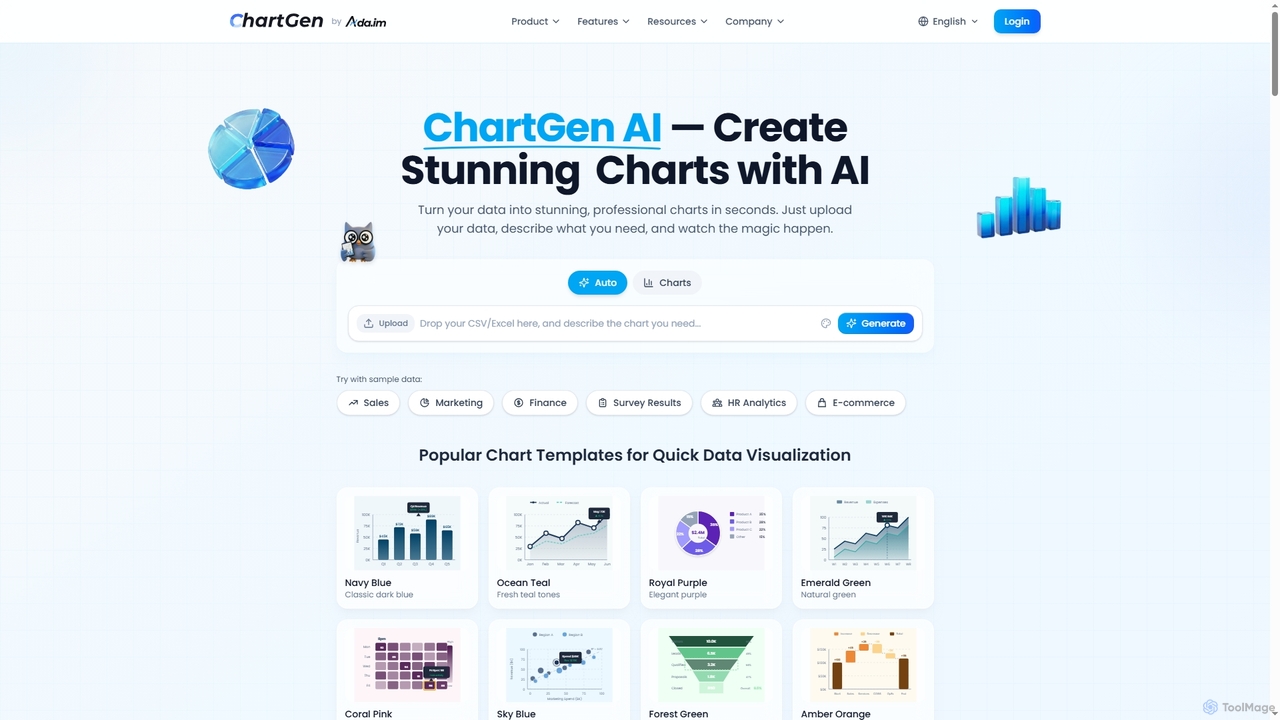
ChartGen
ChartGen is an AI-powered chart generator that transforms raw data into stunning, professional visualizations in seconds. Users simply upload CSV or Excel files, describe their desired chart in plain English, and the AI instantly creates various chart types like bar, line, and pie charts. It's designed for quick, effortless data visualization without requiring design or coding skills.
Charts & Graphs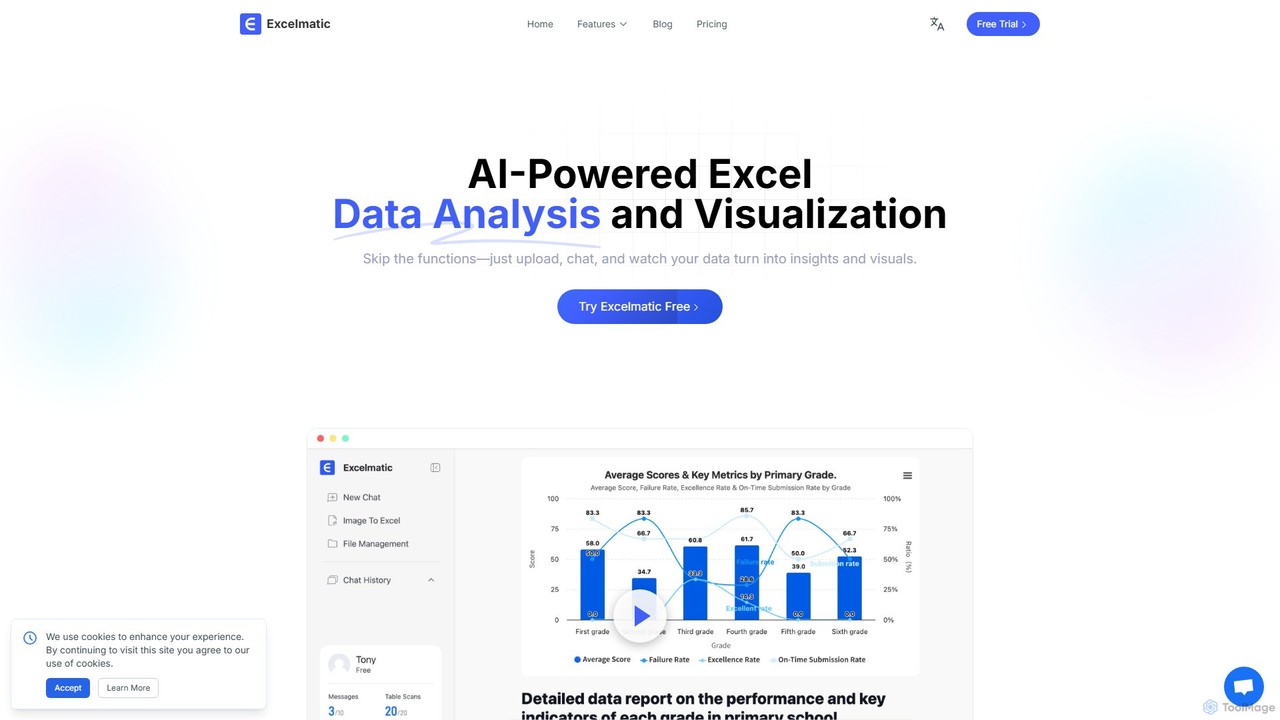
excelmatic
Excelmatic is an AI-powered assistant that transforms your Excel and spreadsheet tasks. Simply upload your data, ask questions in plain English, and instantly get data analysis, visualizations, and generated formulas. It's a no-code solution designed to automate data cleaning, chart creation, and insight discovery, making data accessible to everyone.
Business Intelligence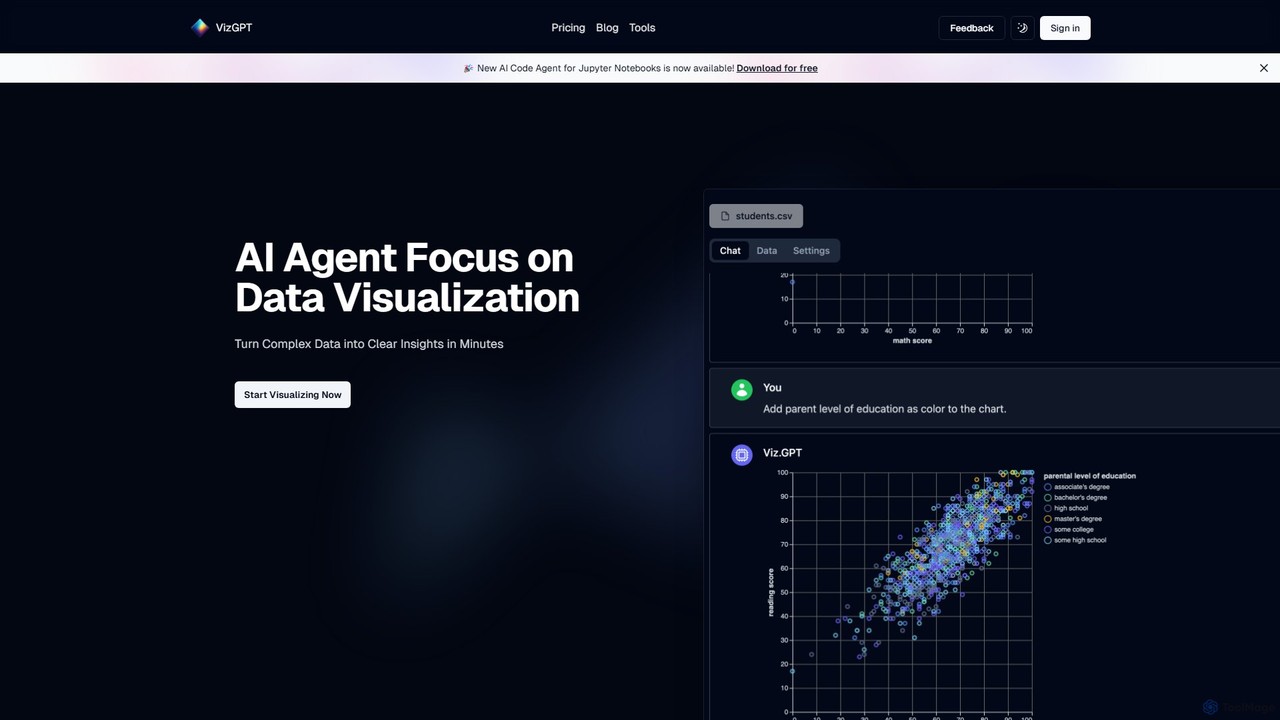
vizGPT
vizGPT is an AI-powered data visualization tool that transforms complex data into clear insights using natural language. Simply ask questions in plain English to generate charts and graphs instantly, without any coding. It supports various data sources and offers both a conversational interface and a no-code drag-and-drop editor, making data analysis accessible to everyone.
Jupyter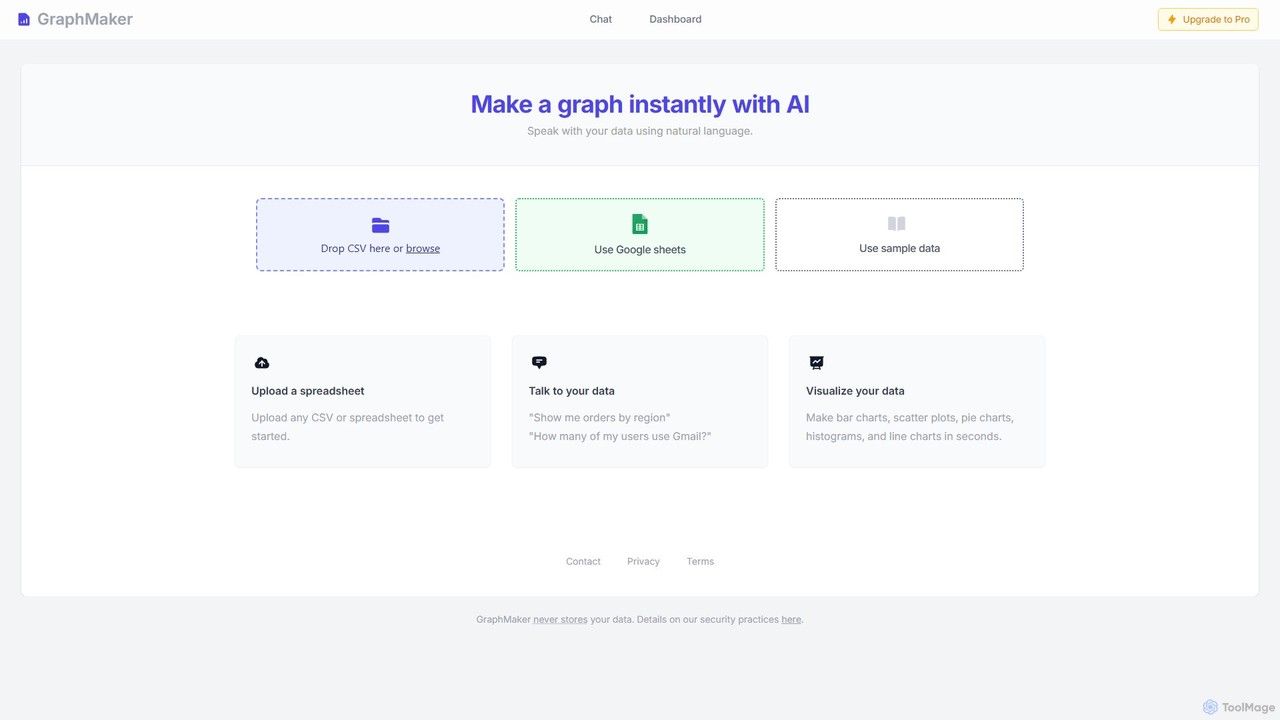
GraphMaker
GraphMaker is an AI-powered data visualization tool that allows you to create various charts and graphs in seconds. Simply upload your data from a CSV file or Google Sheets, and use natural language commands to generate insightful visualizations like bar charts, pie charts, and histograms. It's designed for speed, simplicity, and security, as it never stores your data.
Business Intelligence
CalcGen AI
CalcGen AI is a no-code platform that transforms natural language prompts into interactive calculators, charts, and data visualizations. Effortlessly create custom tools for finance, science, business, and more, simply by describing what you need. Upload your data or provide parameters to generate embeddable widgets in seconds.
Calculators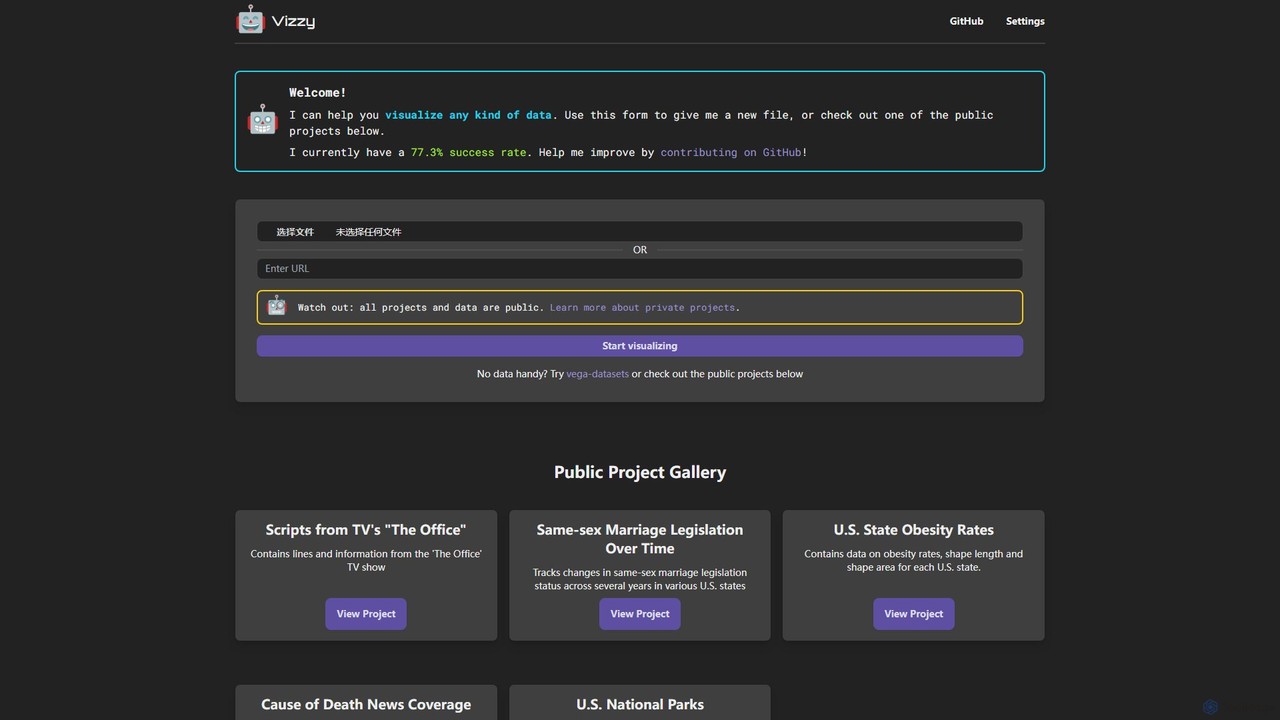
Vizzy
Vizzy is an AI-powered tool that leverages Large Language Models (LLMs) for rapid data visualization. Simply upload your data file, and Vizzy's AI will analyze it to automatically generate insightful charts, graphs, and maps. It's a no-code, open-source platform designed to make data analysis accessible to everyone, from researchers to business analysts. Explore public datasets or visualize your own, turning raw numbers into clear visuals in seconds.
VisualizationLine Graph Maker
A free, web-based tool for instantly creating custom line and bar graphs. Input your data, customize labels, colors, and styles, then download your chart in PNG, JPG, or SVG format. Ideal for students, educators, and professionals for quick data visualization.
Charts & GraphsInfografix
Infografix is an AI-powered infographic generator that transforms simple text prompts into professional-quality visuals. Create stunning charts, diagrams, mind maps, and timelines in seconds without any design skills. Available on web and mobile, it's perfect for marketers, students, and professionals who need to visualize data quickly and effectively.
Infographics
Pie Chart Maker Comments (0)
Sign in to comment.
Sign inNo comments yet.