ChartGPT
Visit Website
ChartGPT Overview
ChartGPT is a revolutionary AI-driven data visualization tool designed to simplify the process of creating charts and graphs. By leveraging the power of advanced language models, it allows users to generate complex visualizations simply by typing a text description. This eliminates the need for manual data entry, complex spreadsheet software, or coding knowledge, making it an indispensable asset for professionals, students, and anyone looking to communicate data effectively. The platform's intuitive interface prompts you to describe your visualization, and with a single click, it produces an accurate and aesthetically pleasing chart that can be further customized to fit your specific needs.
The core philosophy behind ChartGPT is to democratize data visualization. Whether you're a marketing manager tracking campaign performance, a financial analyst presenting market trends, or a student preparing a research paper, ChartGPT streamlines your workflow. It supports a comprehensive range of chart types, ensuring that you can always find the perfect way to represent your data story. The open-source interface also fosters transparency and community-driven improvements, making it a dynamic and evolving platform.
How to use ChartGPT
Using ChartGPT is a straightforward, three-step process designed for maximum efficiency:
- Describe Your Data: In the main input box, type a clear and descriptive sentence about the data you want to visualize. For example, you could type "Top 5 largest tech companies by 2023 revenue in billions" or "Monthly website traffic for the last six months showing organic vs. paid users."
- Generate the Chart: After typing your prompt, click the "Draw" button. The AI will process your request, fetch the relevant data if necessary, and generate an appropriate chart in seconds.
- Customize and Export: Once the chart is generated, you can use the sidebar options to make adjustments. You can change the chart type (e.g., from a bar chart to a pie chart), modify the color scheme, and toggle the visibility of the chart title and legend. When you are satisfied with the result, you can download the chart as a high-quality PNG image for use in presentations, reports, or websites.
Core Features of ChartGPT
- Natural Language Processing: The tool's core is a powerful AI that understands and interprets text prompts to create accurate data visualizations.
- Extensive Chart Library: Supports a wide variety of chart types, including Bar Chart, Area Chart, Line Chart, Pie Chart, Scatter Chart, Radar Chart, Treemap, and Funnel Chart, catering to diverse visualization needs.
- Easy Customization: Offers simple controls to change chart types, select from multiple color palettes (Blue, Purple, Green, Pink, Yellow), and manage elements like titles and legends.
- Instant Generation: Creates charts almost instantaneously, significantly speeding up the workflow for data analysis and reporting.
- PNG Export: Allows users to download their finished charts as high-resolution PNG files, ready for immediate use.
- Open-Source Interface: The front-end is open source, allowing for community contributions and transparency.
- Upcoming PowerPoint Export: A planned feature to allow direct export of charts into PowerPoint presentations, further enhancing its utility for business professionals.
Use Cases for ChartGPT
ChartGPT is versatile and can be used across various professions and industries:
- Business Analysts: Quickly visualize market trends, competitor analysis (e.g., "Top 3 market leaders in the sneaker industry by millions in market share"), and internal performance metrics for reports and meetings.
- Marketing Managers: Create charts to display campaign results, customer demographics, social media engagement, and website traffic data for presentations to stakeholders.
- Students and Academics: Generate graphs for research papers, theses, and presentations, visualizing data like "Average annual rainfall in major cities around the world in cm" without needing to master complex software.
- Content Creators and Journalists: Produce data-driven infographics and visuals for articles and blog posts, making complex information like "Distribution of renewable energy sources in the United States by percentage" easy to understand.
- Product Managers: Track user engagement metrics, feature adoption rates, and other KPIs to make informed product decisions.
Advantages of ChartGPT
The primary advantage of ChartGPT is its unparalleled simplicity and speed. It bridges the gap between raw data and insightful visualization, empowering users without a technical background to create professional-quality charts. This accessibility saves valuable time and resources that would otherwise be spent on learning complex tools or relying on data analysts for simple visualization tasks. Its flexibility in chart types and customization options ensures that the output is not only fast but also tailored to the user's specific communication goals.
Pricing and Plans
ChartGPT operates on a credit-based system, offering a straightforward and commitment-free pricing model. Users can purchase credits for chart generations as needed.
- 100 Credits: Available for a one-time payment of $20.
Each purchase includes access to the open-source interface and the ability to download generated charts as PNG files. The upcoming PowerPoint export feature will also be included for users with credits.
ChartGPT Comments (0)
Log in to post comments
Log in nowChartGPTWebsite Traffic Analysis
Latest Traffic
Status
Monthly Traffic Trend
Geography
Top 5 Countries/Regions
-
🇮🇳 India30.21%
-
🇻🇳 Vietnam28.08%
-
🇺🇸 United States18.69%
-
🇦🇺 Australia12.96%
-
🇵🇰 Pakistan10.06%
ChartGPT Alternatives
View All
ChartGPT
ChartGPT is an AI-powered tool that transforms natural language prompts and raw data into stunning, customizable charts and …
ChartGPT is an AI-powered tool that transforms natural language prompts and raw data into stunning, customizable charts and graphs. Effortlessly create complex visualizations like bar charts, line graphs, and pie charts without any coding, simply by describing what you want to see.
SlickAlgo
SlickAlgo is an AI data analyst platform that transforms natural language questions into instant data insights, Python code, …
SlickAlgo is an AI data analyst platform that transforms natural language questions into instant data insights, Python code, and interactive dashboards. It connects to over 50 data sources, enabling businesses to make data-driven decisions without coding.
Ada
Ada is an AI-powered data analyst platform that connects to diverse data sources to automatically generate enterprise-grade reports. …
Ada is an AI-powered data analyst platform that connects to diverse data sources to automatically generate enterprise-grade reports. It transforms complex data into visual insights and strategic recommendations in minutes, featuring a flexible editor for human refinement.

EasyAIBridge
EasyAIBridge transforms your spreadsheets into instant, actionable insights using advanced AI. Simply type your questions in natural language, …
EasyAIBridge transforms your spreadsheets into instant, actionable insights using advanced AI. Simply type your questions in natural language, and AI automatically generates charts, reports, and data extractions from Google Sheets, Excel, and CSV files, making complex data analysis effortless and secure.
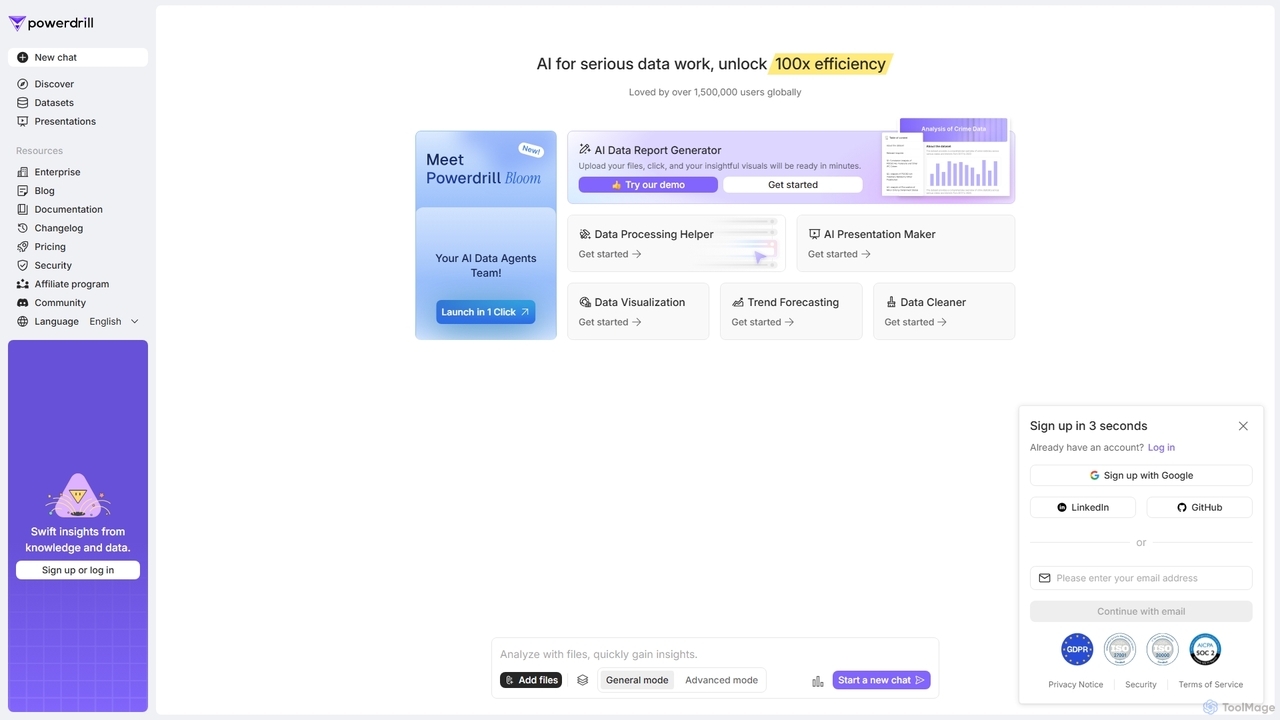
Powerdrill
Powerdrill is an AI-powered data analysis platform designed for serious data work, enabling users to unlock 100x efficiency. …
Powerdrill is an AI-powered data analysis platform designed for serious data work, enabling users to unlock 100x efficiency. It automates the entire process from data processing and cleaning to visualization, report generation, and trend forecasting. Simply upload your files (Excel, CSV, PDF) or connect to a database, and let the AI generate actionable insights, interactive charts, and comprehensive presentations in minutes.
Infografix
Infografix is an AI-powered infographic generator that transforms simple text prompts into professional-quality visuals. Create stunning charts, diagrams, …
Infografix is an AI-powered infographic generator that transforms simple text prompts into professional-quality visuals. Create stunning charts, diagrams, mind maps, and timelines in seconds without any design skills. Available on web and mobile, it's perfect for marketers, students, and professionals who need to visualize data quickly and effectively.
Chat With Your Database
An open-source AI tool that allows you to interact with your PostgreSQL database using natural language. Ask questions, …
An open-source AI tool that allows you to interact with your PostgreSQL database using natural language. Ask questions, get insights, and perform operations through a simple chat interface, eliminating the need for complex SQL queries.
Tila
Tila is a multi-agent AI platform that combines workflow automation and content creation in a unified visual workspace. …
Tila is a multi-agent AI platform that combines workflow automation and content creation in a unified visual workspace. It offers an infinite canvas where users can connect various AI models like GPT-4o, Claude 3.5, and DALL-E 3 to generate text, images, videos, and audio. Its smart multi-agent technology automates complex tasks, from data analysis to app development, streamlining creative and productive workflows without needing multiple subscriptions.

Viewit Ai Chatbot
An AI-powered chatbot that transforms your data into insightful visualizations and summaries through simple, natural language conversations. Upload …
An AI-powered chatbot that transforms your data into insightful visualizations and summaries through simple, natural language conversations. Upload your dataset, ask questions, and instantly receive charts, graphs, and key metrics, making data analysis accessible to everyone without needing complex software or coding skills.
Graphy
Graphy is an AI-powered data visualization tool that transforms raw data into beautiful, interactive charts and graphs in …
Graphy is an AI-powered data visualization tool that transforms raw data into beautiful, interactive charts and graphs in seconds. It simplifies data storytelling by automatically identifying key insights, allowing users to chat with their data, and offering extensive customization. Ideal for marketers, analysts, and teams who need to create compelling visual reports and presentations without complex software.
ChartGPT Category
ChartGPT Tag
ChartGPT Applicable Job
ChartGPT AI Tool Comparison
ChartGPT Embed Feature
Just copy the embed code below and paste this beautiful badge on your blog, article, or official app website to drive traffic directly to this tool's detail page and quickly boost your exposure and user count!

No comments yet, be the first to comment!