

CSVLens Overview
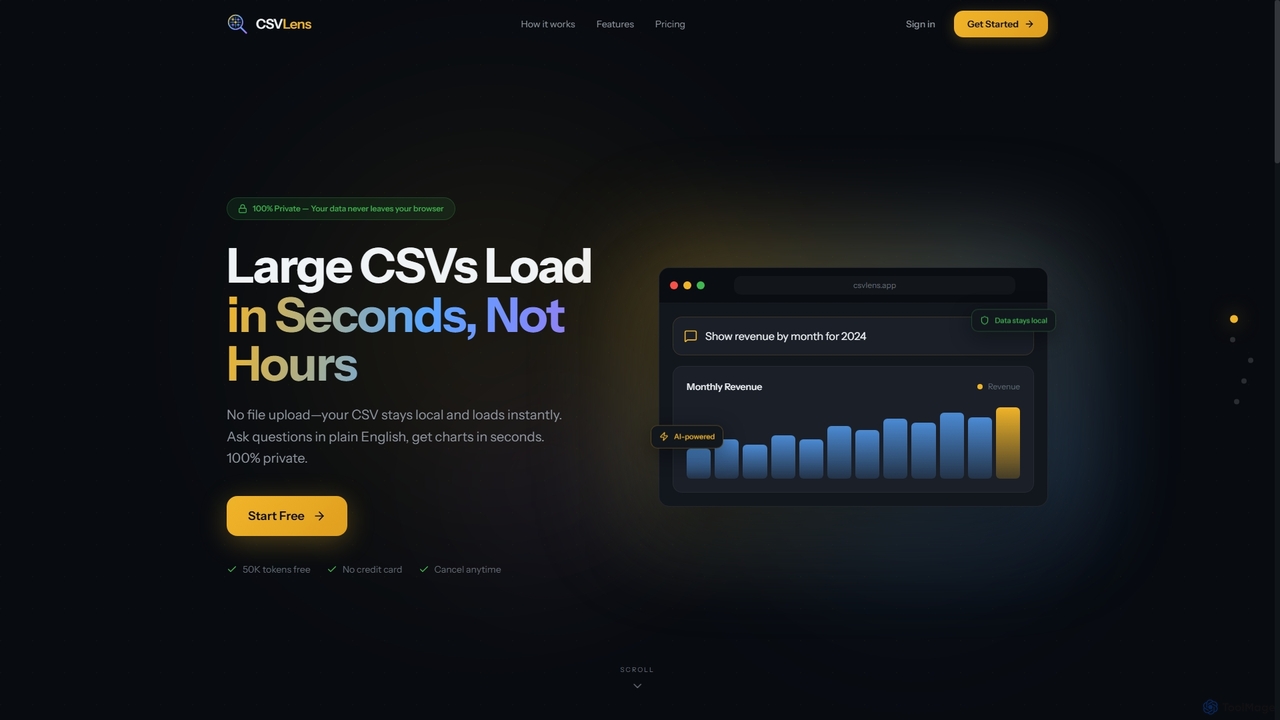
CSVLens revolutionizes CSV data analysis by combining the power of AI with a privacy-first, local processing approach. Designed for data analysts, business users, and anyone needing quick insights, it eliminates the need for complex tools or SQL knowledge. Users can simply drag and drop massive CSV files, which load in seconds, not hours, thanks to local processing with DuckDB WASM. Then, by typing natural language questions, users receive instant answers and auto-generated charts, making data exploration intuitive and efficient.
How to use CSVLens
Using CSVLens is straightforward and requires no technical expertise. First, simply drag and drop your CSV file(s) directly into the browser interface; your data remains local and is never uploaded. Next, type your questions in plain English, such as "What's the average order value?" or "Show me monthly trends." The AI will interpret your query and generate the appropriate SQL. Finally, CSVLens provides instant answers with automatically generated charts, which you can pin to build custom dashboards in seconds.
Core Features of CSVLens
- 100% Private Data Processing: Your CSV data never leaves your browser, running locally with DuckDB WASM.
- Blazing Fast Performance: Load massive CSVs in seconds, not hours, with DuckDB processing millions of rows instantly.
- Natural Language Querying: Ask questions in plain English without needing to learn SQL syntax.
- Multi-Dataset Analysis: Load and analyze up to 5 CSVs (unlimited for Pro users), with easy joining and cross-analysis capabilities.
- Smart Chart Generation: Automatically selects the best visualization type for your data, providing instant insights.
- Agentic Analysis: For complex questions, enable "deep analysis mode" where the AI breaks down problems into multiple steps.
- Dashboard Builder: Pin your favorite queries and charts to create custom dashboards quickly.
- Flexible Export Options: Copy results, download CSV, copy generated SQL (Free tier); export charts as high-resolution PNGs and dashboards as PDF reports (Pro tier).
- SQL View and Edit: For advanced users, view and fine-tune the AI-generated SQL queries.
Use Cases for CSVLens
CSVLens is ideal for a wide range of data analysis tasks. Business users can quickly generate reports on sales trends, customer behavior, or operational metrics without relying on data teams. Data analysts can rapidly explore new datasets, validate hypotheses, and create preliminary visualizations before diving into more complex analyses. It's also perfect for ad-hoc queries, market research, financial reporting, and educational purposes, allowing anyone to gain insights from their data efficiently and privately.
Advantages of CSVLens
The primary advantages of CSVLens include its unparalleled privacy, as all data processing occurs locally in your browser. Its speed in handling large datasets is a significant benefit, eliminating long upload and processing times. The natural language interface makes data analysis accessible to everyone, regardless of SQL proficiency. Furthermore, the AI-powered insights and smart chart generation streamline the analytical process, allowing users to focus on understanding their data rather than wrestling with tools. The freemium model also makes it highly accessible for individuals and small teams.
Pricing and Plans
CSVLens offers simple, transparent pricing with a free tier and a Pro plan:
- Free Plan ($0/month): Includes 50,000 tokens per month (approximately 150-200 queries), support for up to 5 datasets, all chart types, agentic analysis, and the dashboard builder. No credit card is required to start.
- Pro Plan ($12/month): Offers 1,000,000 tokens per month (approximately 3,000-4,000 queries), unlimited datasets, priority AI processing, enhanced export options (PDF & PNG), and priority support.
CSVLens FAQ
Traffic
Latest traffic
Status
Monthly traffic trend
- 2026-1: 0
- 2026-2: 0
- 2026-3: 1.7K
- 2026-4: 794
- 2026-5: 318
Geography
Top 5 countries / regions
- 🇮🇩Indonesia100.0%
CSVLens Alternatives
ChartGen
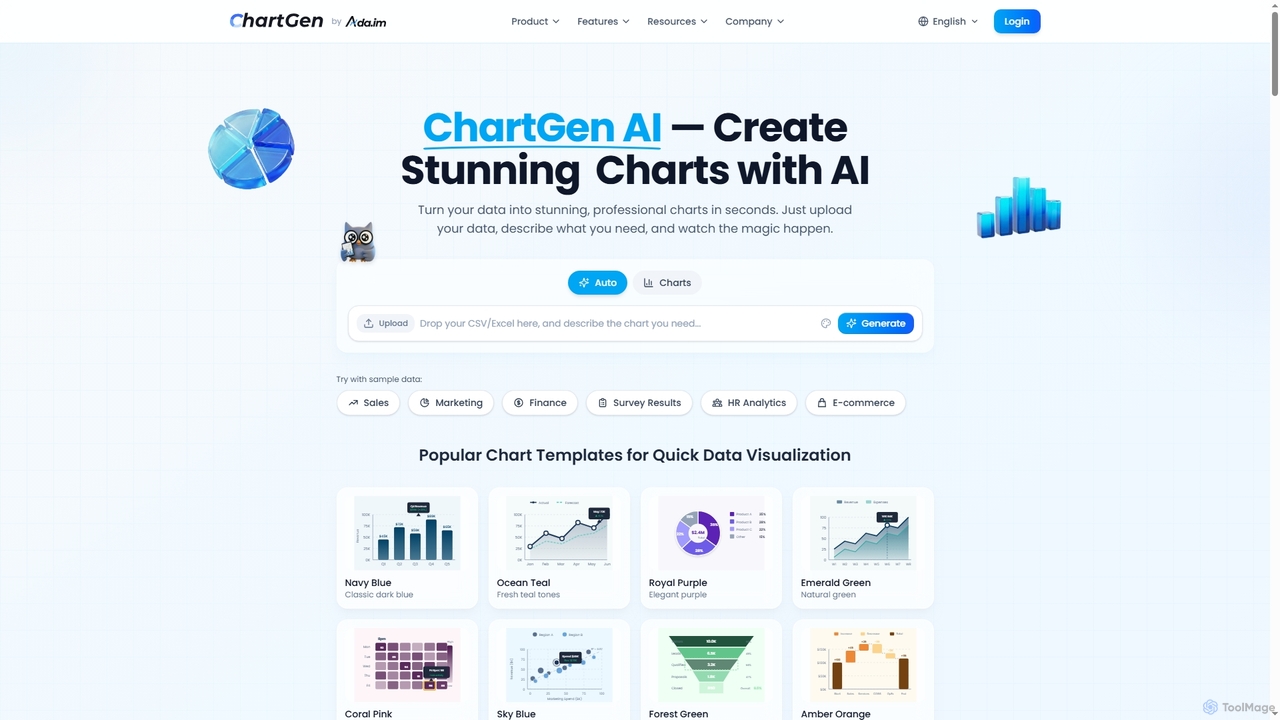
ChartGen is an AI-powered chart generator that transforms raw data into stunning, professional visualizations in seconds. Users simply upload CSV or Excel files, describe their desired chart in plain English, and the AI instantly creates various chart types like bar, line, and pie charts. It's designed for quick, effortless data visualization without requiring design or coding skills.
Charts & Graphs
Lumenore
Lumenore is an AI-powered, no-code business intelligence and data analytics platform designed to transform complex data into actionable insights. It offers a complete analytics workspace with advanced features like Gen AI-powered Natural Language Query (NLQ), automated insights, and data storytelling, enabling businesses to make faster, informed decisions without requiring deep technical expertise.
3D
Viewit Ai Chatbot
An AI-powered chatbot that transforms your data into insightful visualizations and summaries through simple, natural language conversations. Upload your dataset, ask questions, and instantly receive charts, graphs, and key metrics, making data analysis accessible to everyone without needing complex software or coding skills.
Business Intelligence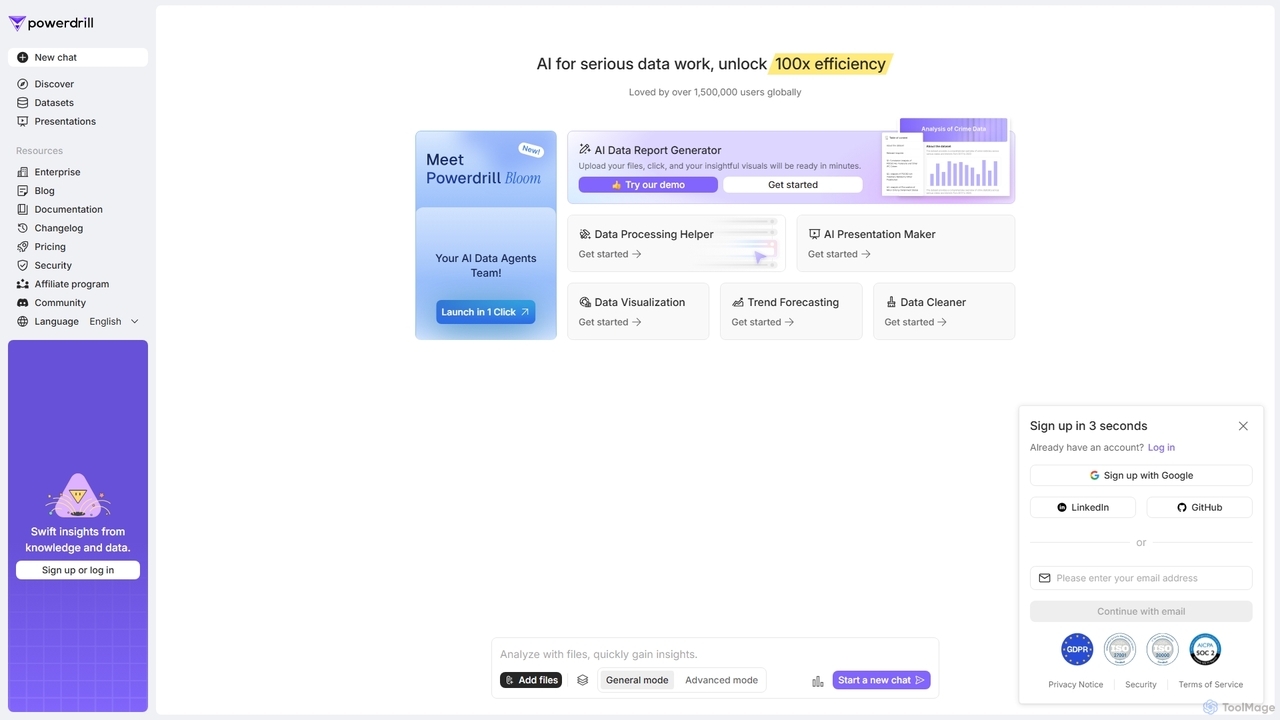
Powerdrill
Powerdrill is an AI-powered data analysis platform designed for serious data work, enabling users to unlock 100x efficiency. It automates the entire process from data processing and cleaning to visualization, report generation, and trend forecasting. Simply upload your files (Excel, CSV, PDF) or connect to a database, and let the AI generate actionable insights, interactive charts, and comprehensive presentations in minutes.
Business IntelligenceCSVLens Categories
CSVLens Jobs
CSVLens Embed Widget
Copy this embed code to place the badge on your blog, article, or product site and send readers directly to this ToolMage detail page.

Related AI tools
ChartGen
ChartGen is an AI-powered chart generator that transforms raw data into stunning, professional visualizations in seconds. Users simply upload CSV or Excel files, describe their desired chart in plain English, and the AI instantly creates various chart types like bar, line, and pie charts. It's designed for quick, effortless data visualization without requiring design or coding skills.
Charts & GraphsViewit Ai Chatbot
An AI-powered chatbot that transforms your data into insightful visualizations and summaries through simple, natural language conversations. Upload your dataset, ask questions, and instantly receive charts, graphs, and key metrics, making data analysis accessible to everyone without needing complex software or coding skills.
Business Intelligence
ChatBiReport
ChatBiReport is an AI-powered business intelligence assistant that transforms raw data into stunning, interactive charts and reports using natural language descriptions. It simplifies data visualization and reporting for businesses.
3D
MotionExcel
MotionExcel is an AI-powered spreadsheet editor that integrates artificial intelligence, Python, and SQL to transform data analysis and automation. It helps users analyze data faster, create better insights, and work smarter with intelligent agents and advanced features.
Spreadsheet
Alemia
Alemia is an AI-powered data analytics platform that transforms raw data into actionable insights, visualizations, and reports. It enables users to ask questions in plain English and receive instant, intelligent analysis, making data-driven decision-making accessible to everyone without requiring technical skills.
3D
ChartGPT
ChartGPT is an AI-powered tool that transforms natural language prompts and raw data into stunning, customizable charts and graphs. Effortlessly create complex visualizations like bar charts, line graphs, and pie charts without any coding, simply by describing what you want to see.
Infographics
Metatable
Metatable is an AI-powered data assistant that revolutionizes how you interact with spreadsheets and tabular data. Simply use natural language prompts to clean, analyze, transform, and visualize your data instantly. It eliminates complex formulas and manual tasks, making data analysis accessible to everyone, from data analysts to business managers.
AnalyticsPowerdrill
Powerdrill is an AI-powered data analysis platform designed for serious data work, enabling users to unlock 100x efficiency. It automates the entire process from data processing and cleaning to visualization, report generation, and trend forecasting. Simply upload your files (Excel, CSV, PDF) or connect to a database, and let the AI generate actionable insights, interactive charts, and comprehensive presentations in minutes.
Business Intelligence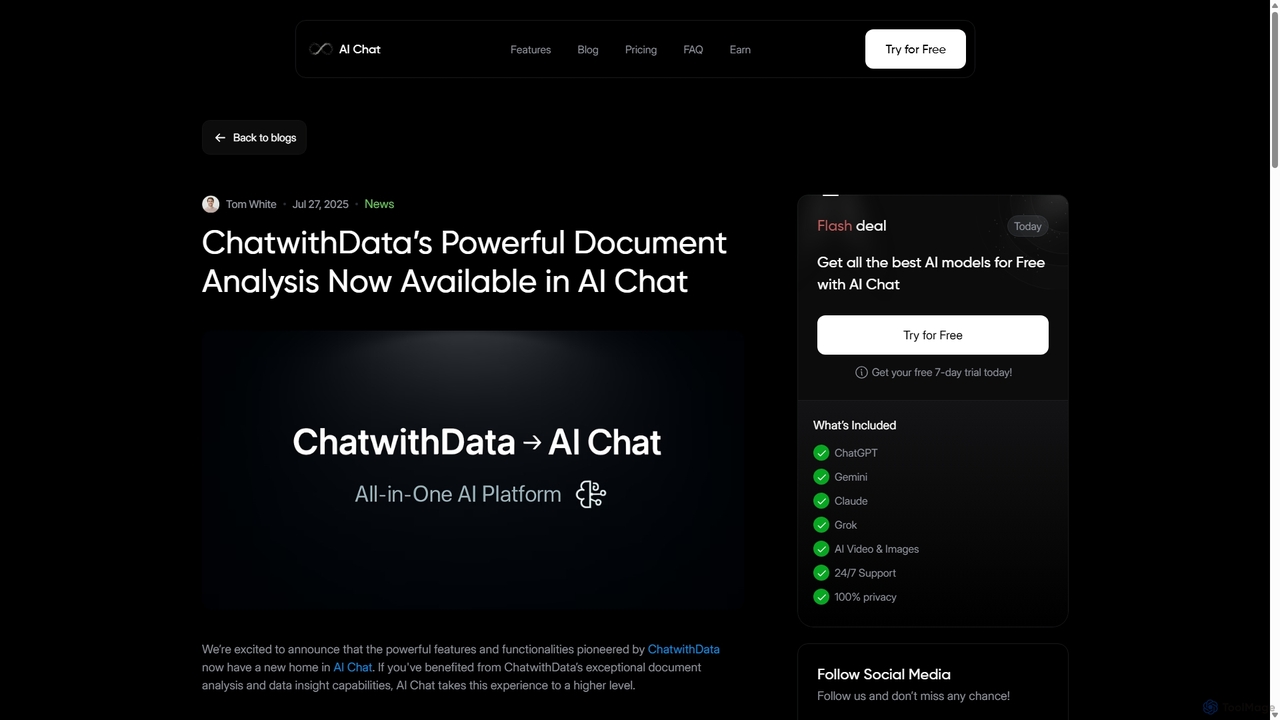
ChatwithData
ChatwithData is a powerful AI tool designed for interactive document analysis. It allows users to upload various file types, including PDFs, Word, CSV, Excel, and SQL databases, and extract insights using natural language queries. Its features have now been integrated and enhanced within the AI Chat platform.
Ai Chatbot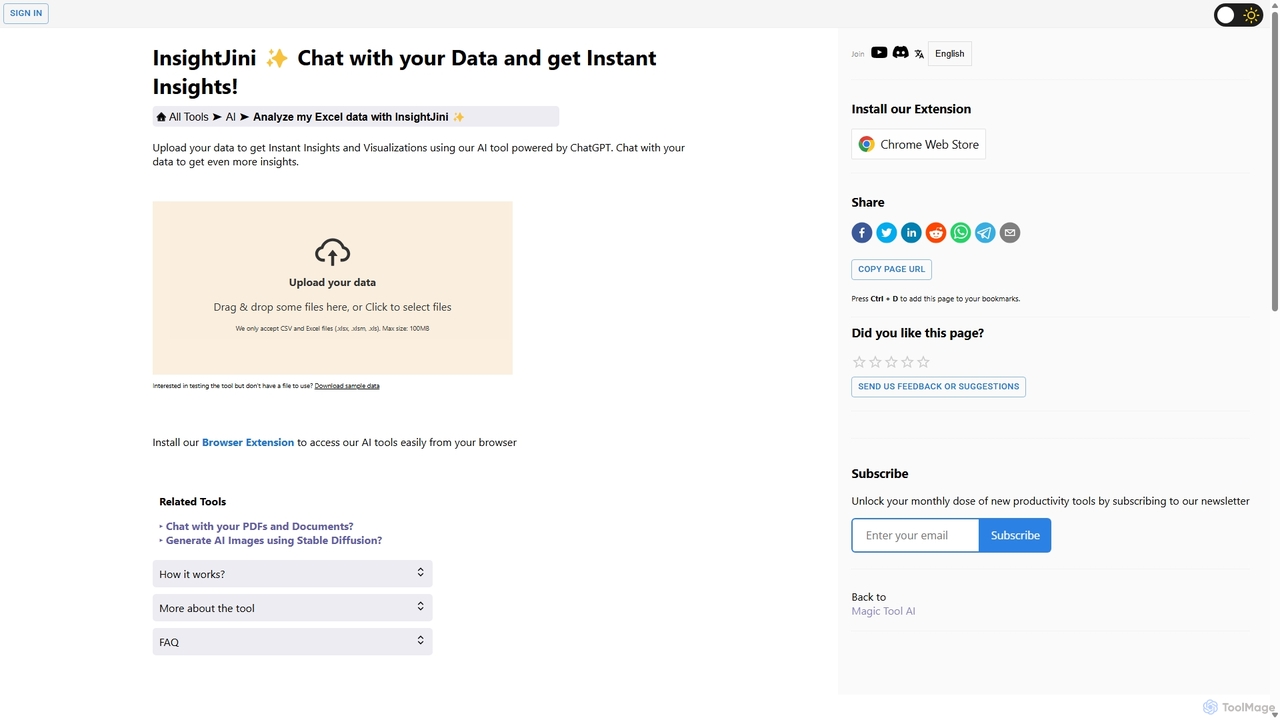
InsightJini
InsightJini is an AI-powered data analysis tool that lets you chat with your Excel and CSV files. Upload your data to instantly generate visualizations and insights without any coding. Its conversational interface, powered by ChatGPT, makes data exploration intuitive and accessible for everyone.
Business Intelligence
EasyAIBridge
EasyAIBridge transforms your spreadsheets into instant, actionable insights using advanced AI. Simply type your questions in natural language, and AI automatically generates charts, reports, and data extractions from Google Sheets, Excel, and CSV files, making complex data analysis effortless and secure.
Business Intelligence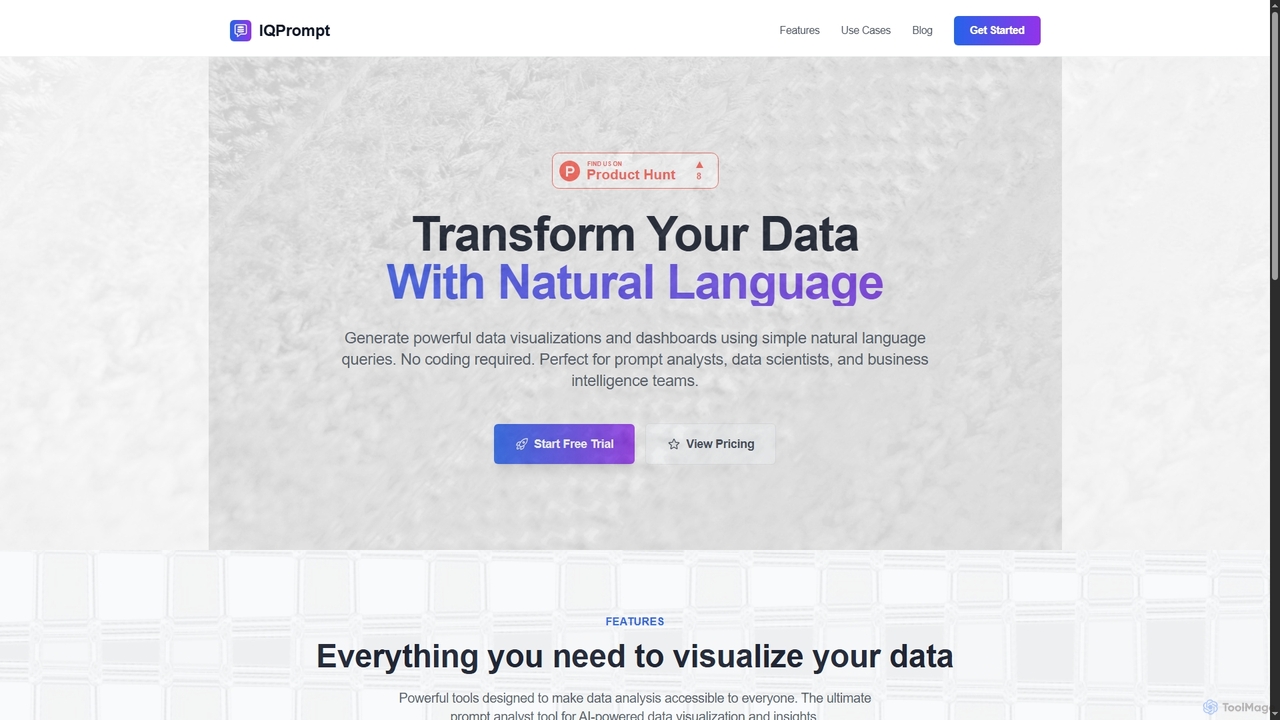
IQPrompt
IQPrompt is an AI-powered data analysis tool that transforms natural language queries into powerful data visualizations and dashboards. It enables prompt analysts, data scientists, and business teams to gain instant insights without requiring any coding or SQL knowledge, supporting connections to major databases.
Visualization
Jyek
Jyek is an AI agent platform that understands objectives, creates execution plans, uses tools, and delivers verifiable results for complex, multi-step tasks.
Automation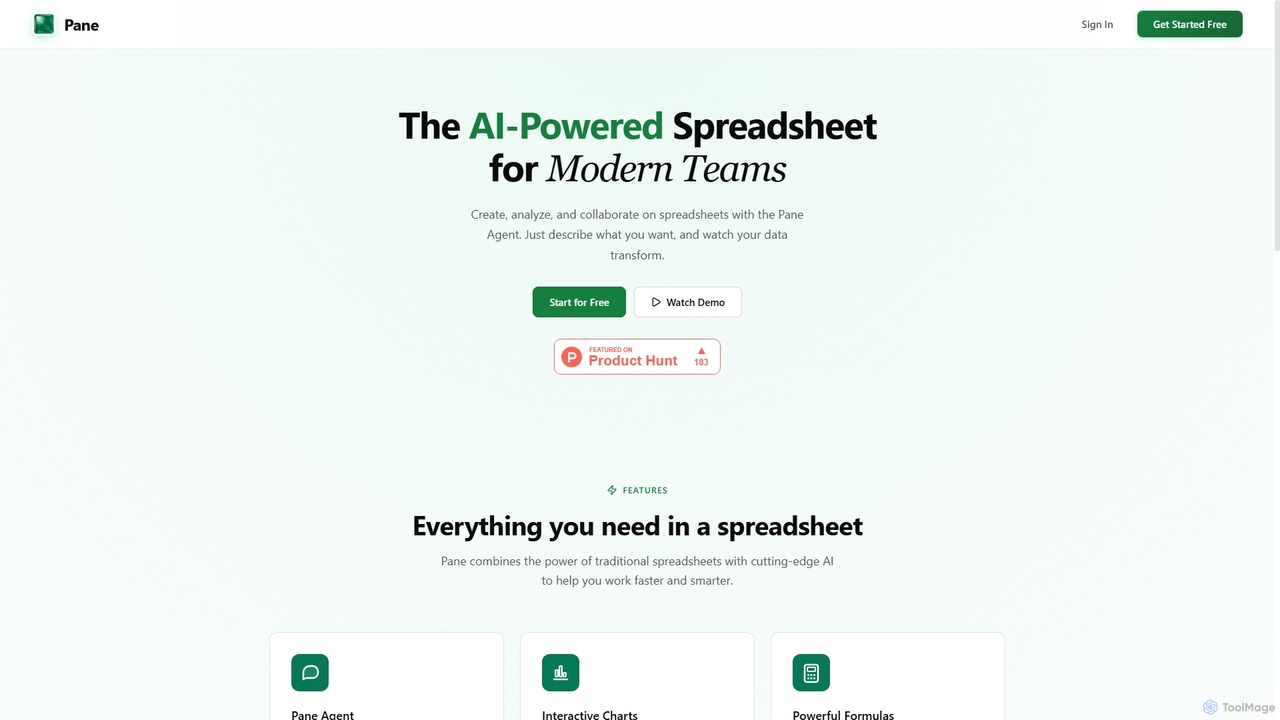
Pane
Pane is an AI-native spreadsheet designed for modern teams, integrating artificial intelligence to streamline data creation, analysis, and collaboration. It allows users to interact with their data using natural language commands, automate tasks, and generate professional dashboards effortlessly, enhancing productivity and insights.
Teamwork
CSVLens Comments (0)
Sign in to comment.
Sign inNo comments yet.