Pane
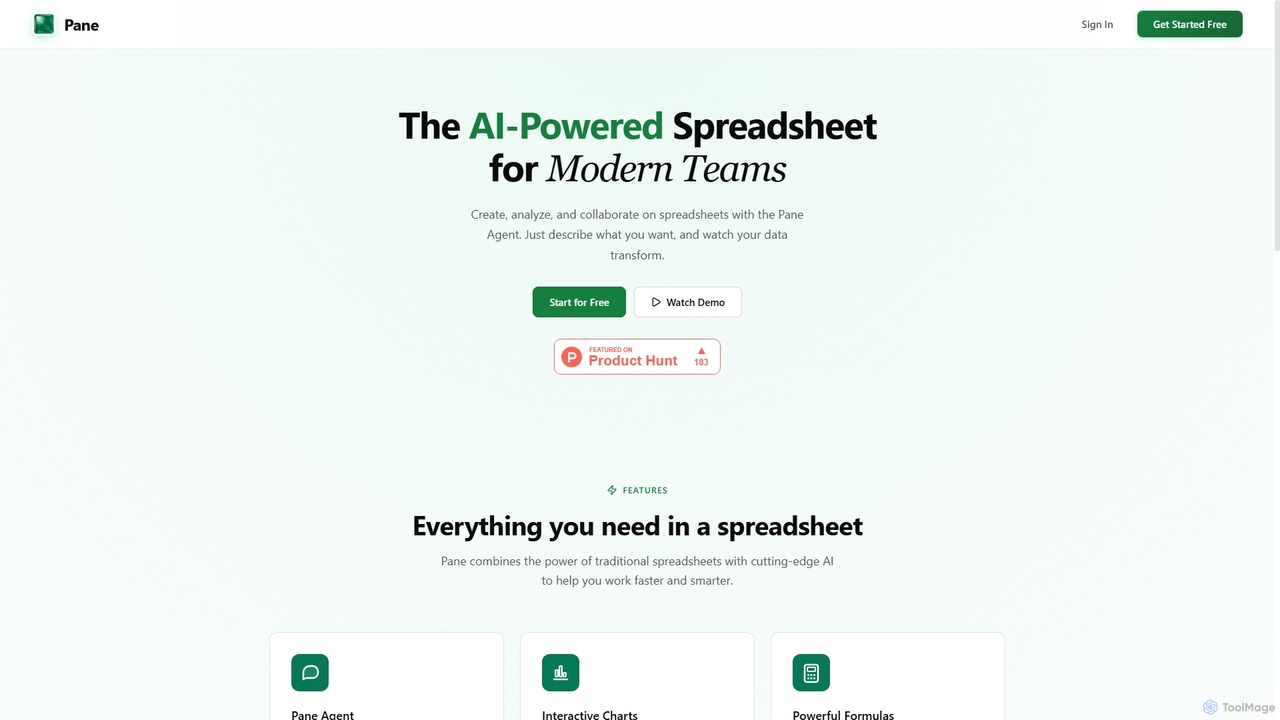
Pane is an AI-native spreadsheet designed for modern teams, integrating artificial intelligence to streamline data creation, analysis, and …
Pane is an AI-native spreadsheet designed for modern teams, integrating artificial intelligence to streamline data creation, analysis, and collaboration. It allows users to interact with their data using natural language commands, automate tasks, and generate professional dashboards effortlessly, enhancing productivity and insights.
IQPrompt
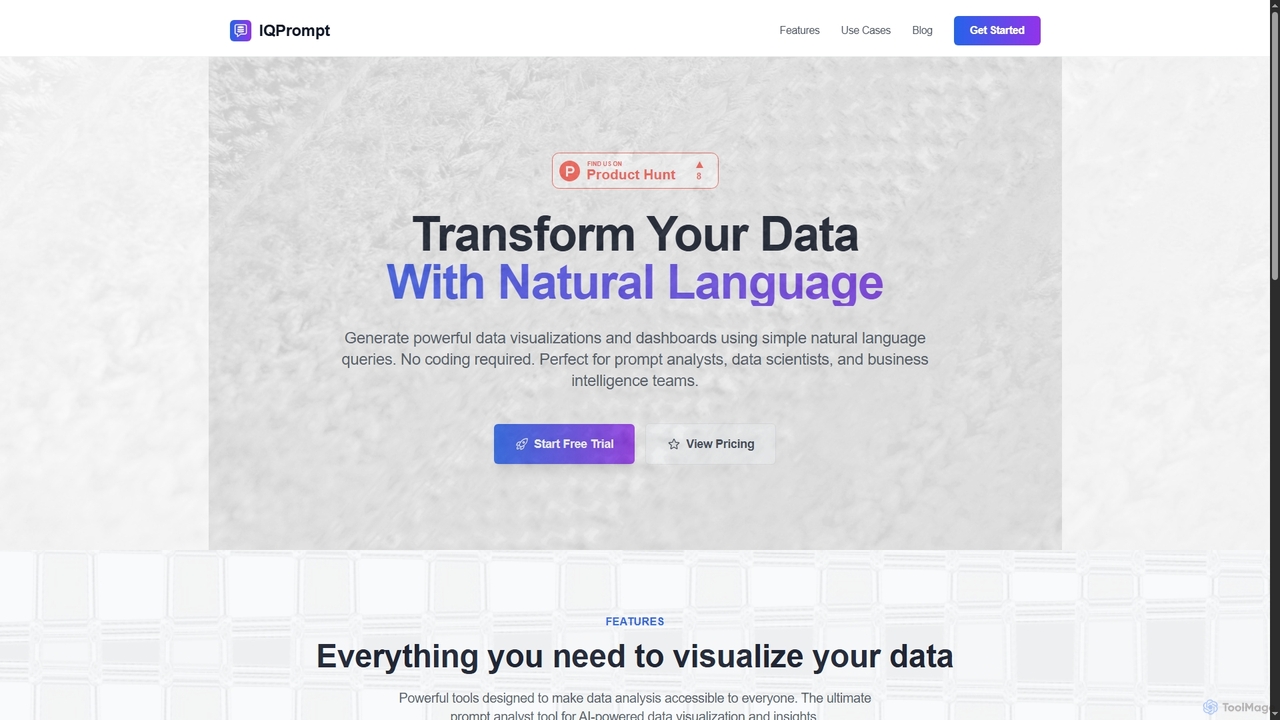
IQPrompt is an AI-powered data analysis tool that transforms natural language queries into powerful data visualizations and dashboards. …
IQPrompt is an AI-powered data analysis tool that transforms natural language queries into powerful data visualizations and dashboards. It enables prompt analysts, data scientists, and business teams to gain instant insights without requiring any coding or SQL knowledge, supporting connections to major databases.
Formula Bot
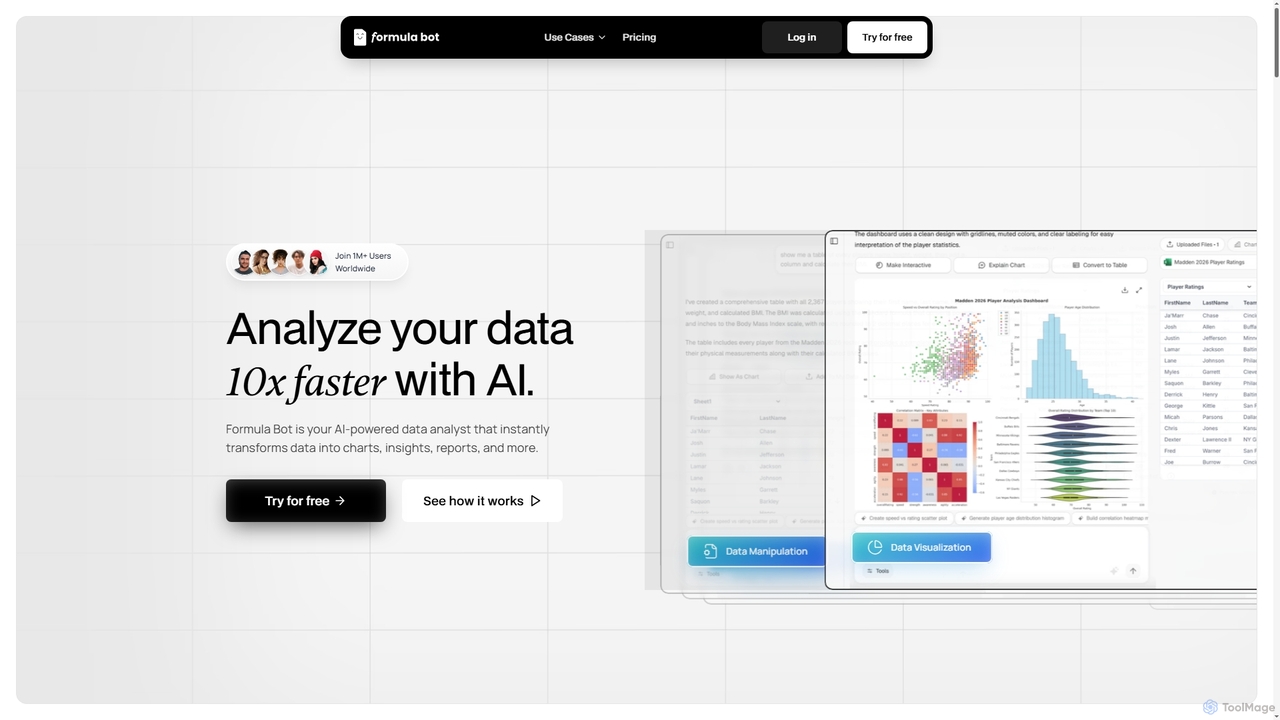
Formula Bot is an AI-powered data analyst that instantly transforms raw data into actionable insights, stunning charts, and …
Formula Bot is an AI-powered data analyst that instantly transforms raw data into actionable insights, stunning charts, and comprehensive reports. It also offers specialized AI tools for generating Excel formulas, converting PDFs to Excel, and providing step-by-step homework assistance across various subjects, streamlining data handling and learning processes for users worldwide.
Data Analyzer
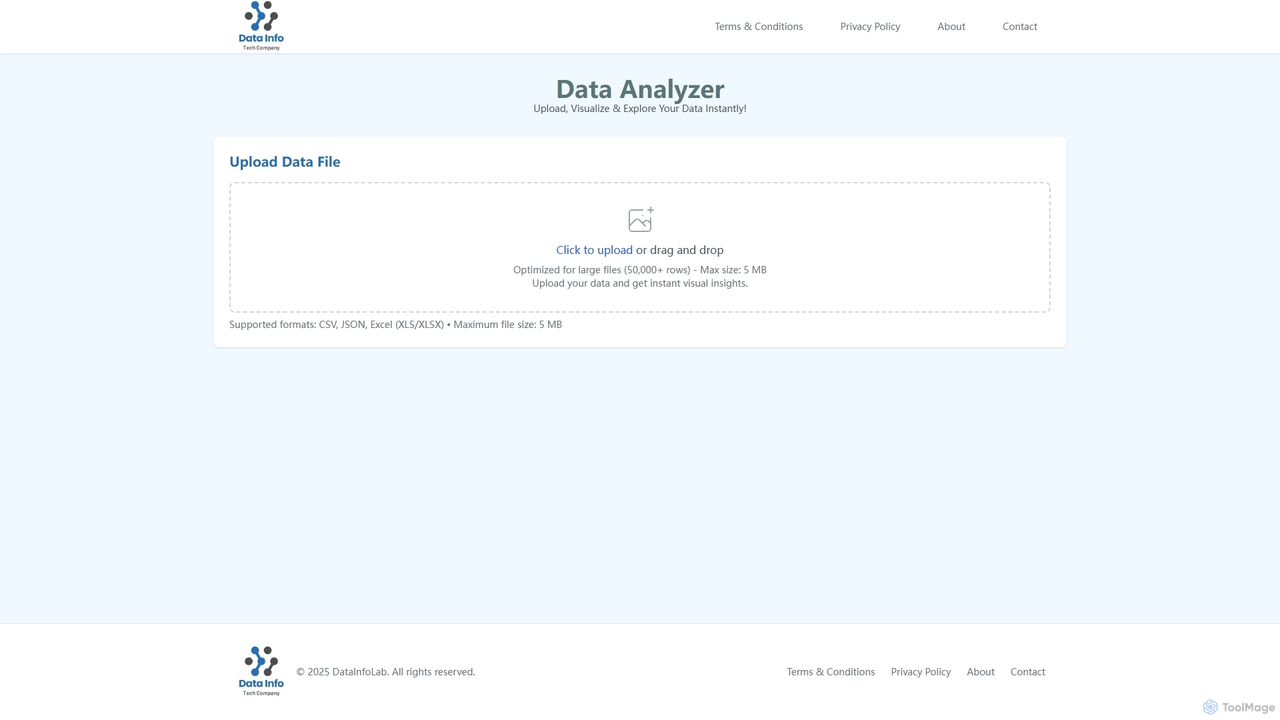
Data Analyzer is an intuitive AI-powered tool designed for instant data visualization and exploration. Users can upload various …
Data Analyzer is an intuitive AI-powered tool designed for instant data visualization and exploration. Users can upload various data file formats like CSV, JSON, and Excel to quickly gain visual insights and understand global statistics, trends, and data patterns. It's optimized to handle large datasets, making complex data analysis accessible and efficient.
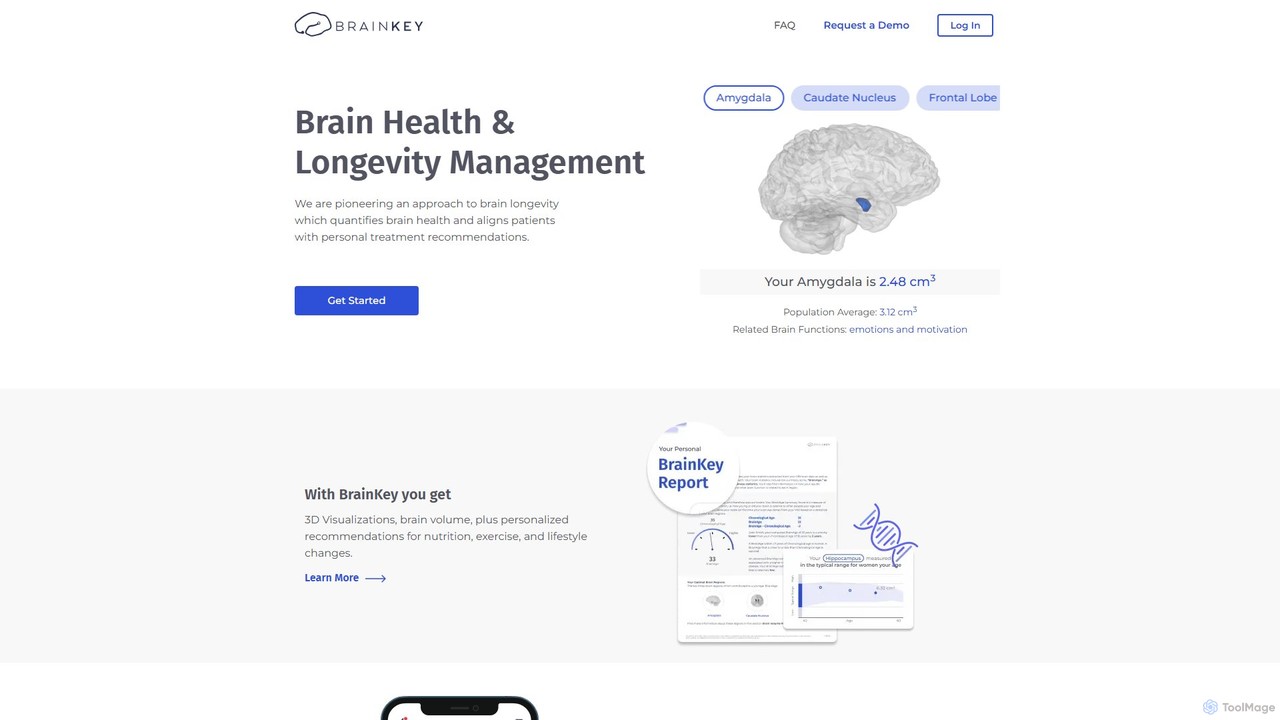
BrainKey
BrainKey is an AI-powered platform that transforms brain MRI scans into interactive 3D visualizations and actionable health insights. …
BrainKey is an AI-powered platform that transforms brain MRI scans into interactive 3D visualizations and actionable health insights. It quantifies brain volume, calculates your BrainAge, and provides personalized recommendations for nutrition, exercise, and lifestyle to promote brain health and longevity. It empowers individuals and clinicians to proactively monitor and manage brain health.
About Visualization
Visualization tools are AI-powered platforms that transform complex datasets into intuitive visual representations. They leverage artificial intelligence to automate chart generation, identify hidden patterns, and enable interactive data exploration. These tools empower users to quickly grasp insights, communicate findings effectively, and make data-driven decisions. Their advanced capabilities extend beyond traditional charting, offering predictive and prescriptive visual analytics.
Core Features
- Automated Chart Generation: AI suggests and creates optimal charts (e.g., bar, line, scatter, heatmaps) based on data characteristics and user queries.
- Interactive Dashboards: Dynamic, customizable dashboards allow users to drill down into data, filter, and explore relationships in real-time.
- Anomaly Detection: AI algorithms automatically highlight unusual data points or outliers that might indicate critical issues or opportunities.
- Natural Language Query (NLQ): Users can ask questions in plain language (e.g., "Show me sales by region last quarter") to generate visualizations instantly.
- Predictive Visualization: Tools can forecast future trends and visualize potential outcomes based on historical data and AI models.
Applicable Scenarios
Business analysts use visualization tools to create performance dashboards, tracking KPIs like sales, marketing ROI, and operational efficiency. Data scientists leverage them for exploratory data analysis, identifying correlations and distributions in large datasets. Marketing teams utilize these tools to visualize campaign performance, customer behavior, and market trends, optimizing strategies for better engagement.
How to Choose
When selecting an AI visualization tool, consider its data source compatibility (e.g., databases, cloud services, spreadsheets), the range of visualization types offered, and its ease of use for non-technical users. Evaluate the AI capabilities for automated insights and natural language processing, as well as integration options with existing business intelligence platforms. Scalability for large datasets and pricing models are also crucial factors.
VisualizationUse Cases
Real-time Business Performance Monitoring
Business leaders and operations managers use AI visualization tools to create dynamic, real-time dashboards that track key performance indicators (KPIs) across departments. By connecting to various data sources, these tools automatically update charts and graphs, highlighting critical trends, anomalies, and areas needing immediate attention, enabling proactive decision-making and operational adjustments.
Market Trend Analysis for Product Development
Product managers and market researchers leverage visualization tools to analyze vast amounts of market data, including customer feedback, sales figures, and competitor activity. AI-driven visualizations reveal emerging trends, unmet customer needs, and market gaps, informing product roadmap decisions and helping to prioritize features that align with market demand.
Financial Data Exploration and Reporting
Financial analysts and accountants utilize AI visualization to transform complex financial statements, transaction data, and investment portfolios into clear, interactive reports. These tools help identify spending patterns, revenue streams, and risk factors, making it easier to present financial health to stakeholders and support strategic financial planning.
Healthcare Patient Data Insights
Medical researchers and healthcare administrators employ visualization tools to analyze anonymized patient data, including treatment outcomes, disease prevalence, and demographic trends. AI helps uncover correlations between different health factors, aiding in epidemiological studies, improving patient care strategies, and optimizing resource allocation within healthcare systems.
Supply Chain Optimization Visualization
Supply chain managers use these tools to visualize the entire logistics network, from raw material sourcing to final product delivery. AI-powered dashboards track inventory levels, shipping routes, supplier performance, and potential bottlenecks, allowing for proactive adjustments to minimize delays, reduce costs, and enhance overall supply chain resilience.
Social Media Engagement Analysis
Marketing and social media specialists apply visualization tools to interpret engagement metrics, audience demographics, and content performance across various platforms. AI helps to visualize sentiment analysis, identify viral trends, and understand which content types resonate most with specific audience segments, guiding future content strategy and campaign optimization.