Data Analyzer
Visit Website
Data Analyzer Overview
Data Analyzer is a cutting-edge AI tool that simplifies the process of data analysis and visualization. It allows users to effortlessly upload their data files and receive instant visual insights, transforming raw data into actionable intelligence. Optimized for performance, Data Analyzer can process large datasets, specifically supporting files with over 50,000 rows, ensuring robust analysis capabilities for diverse needs. Its user-friendly interface makes data exploration accessible to professionals across various industries, enabling them to uncover global statistics, identify trends, and derive meaningful data insights without requiring extensive technical expertise.
How to use Data Analyzer
Using Data Analyzer is straightforward. Simply navigate to the platform and locate the 'Upload Data File' section. You can either click to open a file selection dialog or drag and drop your data file directly into the designated area. Ensure your file is in a supported format (CSV, JSON, or Excel - XLS/XLSX) and does not exceed the 5 MB maximum size. Once uploaded, Data Analyzer will instantly process your data and present you with visual insights and exploration options.
Core Features of Data Analyzer
- Instant Data Visualization: Get immediate visual insights upon data upload.
- Data Exploration: Tools to interactively explore your uploaded datasets.
- Large File Optimization: Capable of processing files with over 50,000 rows.
- Multiple Format Support: Accepts CSV, JSON, and Excel (XLS/XLSX) file types.
- File Size Limit: Supports files up to a maximum of 5 MB.
Use Cases for Data Analyzer
Data Analyzer is ideal for a wide range of applications, including business intelligence, market research, academic studies, and trend analysis. Businesses can use it to quickly visualize sales data, customer behavior, or operational metrics to make informed decisions. Researchers can analyze survey results or experimental data to identify patterns and draw conclusions. Anyone needing to rapidly understand complex datasets and extract key insights will find Data Analyzer an invaluable tool for global statistics, data insights, and trend identification.
Advantages of Data Analyzer
The primary advantages of Data Analyzer include its speed and ease of use, providing instant visual insights without a steep learning curve. Its optimization for large files ensures that even substantial datasets can be processed efficiently. The support for common data formats (CSV, JSON, Excel) makes it versatile for various data sources. By automating the visualization process, it saves significant time and effort, allowing users to focus on interpreting results rather than data preparation.
Data Analyzer Frequently Asked Questions
Data Analyzer Comments (0)
Log in to post comments
Log in nowData Analyzer Alternatives
View All
Lection
Lection is an AI-powered web scraping agent that allows users to extract structured data from any website using …
Lection is an AI-powered web scraping agent that allows users to extract structured data from any website using natural language. It automates data collection, integrates with popular workflows, and provides clean, validated data without requiring any coding expertise.
IQPrompt
IQPrompt is an AI-powered data analysis tool that transforms natural language queries into powerful data visualizations and dashboards. …
IQPrompt is an AI-powered data analysis tool that transforms natural language queries into powerful data visualizations and dashboards. It enables prompt analysts, data scientists, and business teams to gain instant insights without requiring any coding or SQL knowledge, supporting connections to major databases.
Graphy
Graphy is an AI-powered data visualization tool that transforms raw data into beautiful, interactive charts and graphs in …
Graphy is an AI-powered data visualization tool that transforms raw data into beautiful, interactive charts and graphs in seconds. It simplifies data storytelling by automatically identifying key insights, allowing users to chat with their data, and offering extensive customization. Ideal for marketers, analysts, and teams who need to create compelling visual reports and presentations without complex software.

EasyAIBridge
EasyAIBridge transforms your spreadsheets into instant, actionable insights using advanced AI. Simply type your questions in natural language, …
EasyAIBridge transforms your spreadsheets into instant, actionable insights using advanced AI. Simply type your questions in natural language, and AI automatically generates charts, reports, and data extractions from Google Sheets, Excel, and CSV files, making complex data analysis effortless and secure.
Formula Bot
Formula Bot is an AI-powered data analyst that instantly transforms raw data into actionable insights, stunning charts, and …
Formula Bot is an AI-powered data analyst that instantly transforms raw data into actionable insights, stunning charts, and comprehensive reports. It also offers specialized AI tools for generating Excel formulas, converting PDFs to Excel, and providing step-by-step homework assistance across various subjects, streamlining data handling and learning processes for users worldwide.
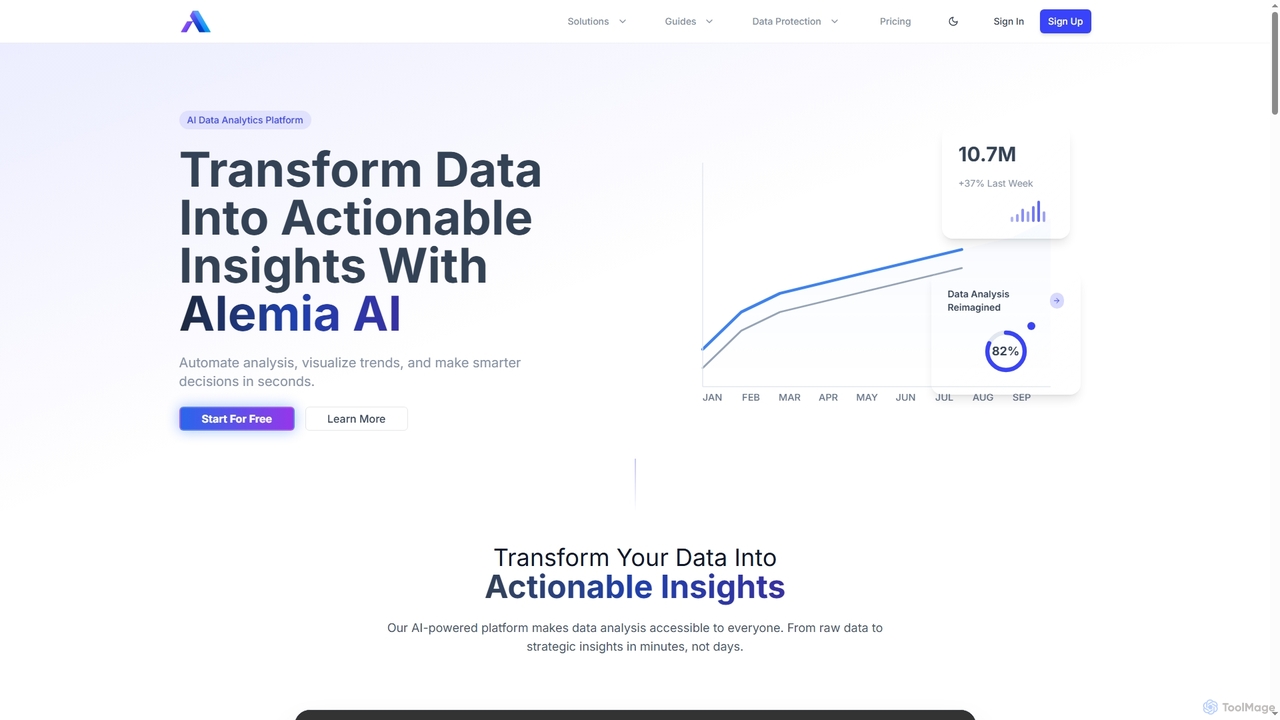
Alemia
Alemia is an AI-powered data analytics platform that transforms raw data into actionable insights, visualizations, and reports. It …
Alemia is an AI-powered data analytics platform that transforms raw data into actionable insights, visualizations, and reports. It enables users to ask questions in plain English and receive instant, intelligent analysis, making data-driven decision-making accessible to everyone without requiring technical skills.
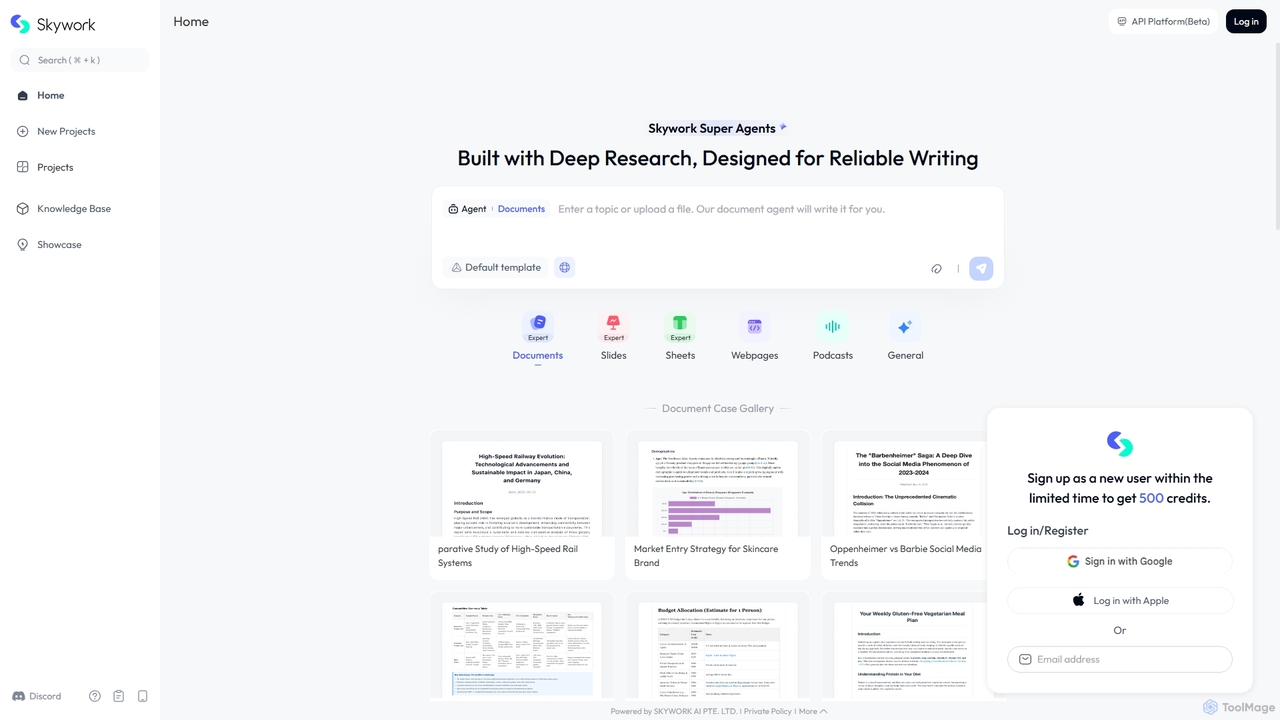
Skywork
Skywork is an advanced AI research and writing platform featuring 'Super Agents' that automate the creation of complex, …
Skywork is an advanced AI research and writing platform featuring 'Super Agents' that automate the creation of complex, data-driven documents, presentations, and spreadsheets. It combines deep research capabilities with multi-format content generation to deliver reliable, high-quality outputs for business, marketing, and academic needs, significantly boosting productivity.
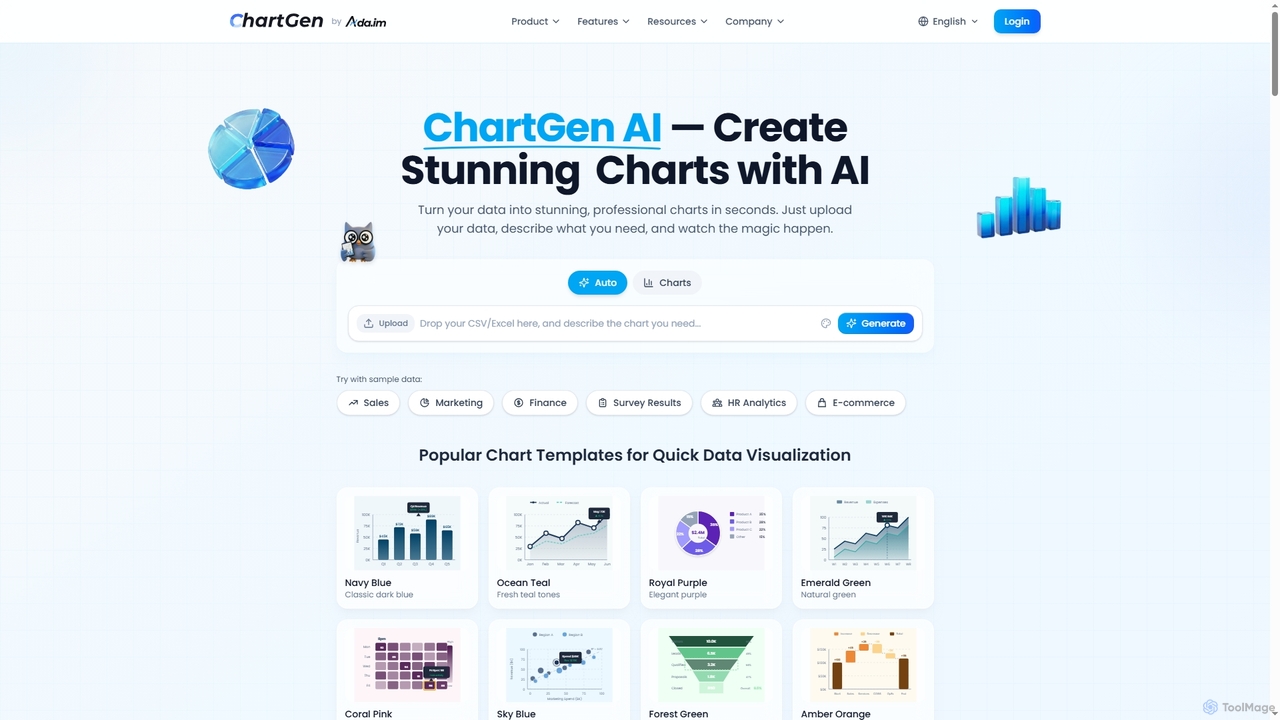
ChartGen
ChartGen is an AI-powered chart generator that transforms raw data into stunning, professional visualizations in seconds. Users simply …
ChartGen is an AI-powered chart generator that transforms raw data into stunning, professional visualizations in seconds. Users simply upload CSV or Excel files, describe their desired chart in plain English, and the AI instantly creates various chart types like bar, line, and pie charts. It's designed for quick, effortless data visualization without requiring design or coding skills.
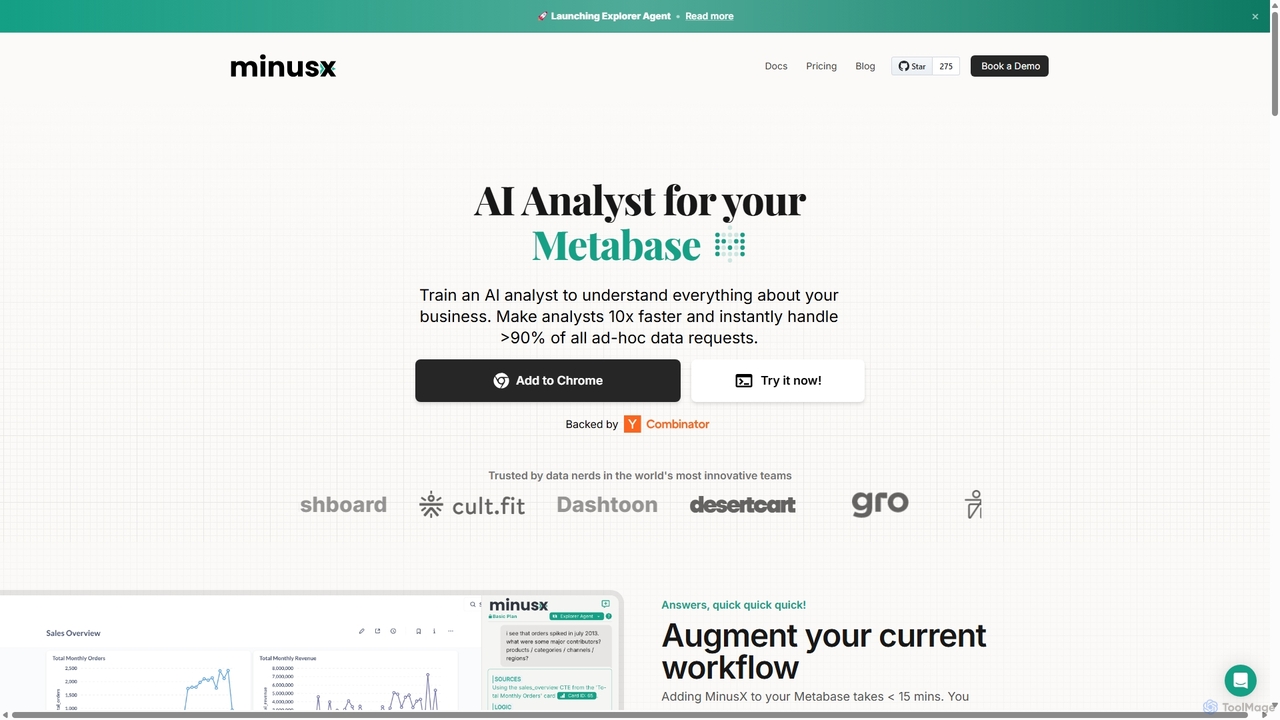
Minusx
Minusx is an AI data analyst designed to integrate seamlessly with Metabase. It empowers data analysts, business users, …
Minusx is an AI data analyst designed to integrate seamlessly with Metabase. It empowers data analysts, business users, and executives to query data using natural language, handling over 90% of ad-hoc requests instantly. By acting as a Chrome extension within your existing workflow, Minusx enhances productivity, codifies business knowledge through 'Context Engineering', and provides quick, accurate insights directly from your dashboards and reports, all while ensuring data security.

ChatBiReport
ChatBiReport is an AI-powered business intelligence assistant that transforms raw data into stunning, interactive charts and reports using …
ChatBiReport is an AI-powered business intelligence assistant that transforms raw data into stunning, interactive charts and reports using natural language descriptions. It simplifies data visualization and reporting for businesses.
Data Analyzer Category
Data Analyzer Tag
Data Analyzer Applicable Job
Data Analyzer AI Tool Comparison
Data Analyzer Embed Feature
Just copy the embed code below and paste this beautiful badge on your blog, article, or official app website to drive traffic directly to this tool's detail page and quickly boost your exposure and user count!

No comments yet, be the first to comment!