ChatBiReport
Visit Website
ChatBiReport Overview
ChatBiReport is an innovative AI-powered business intelligence assistant designed to revolutionize how users interact with their data. It empowers individuals and teams to create professional, interactive data visualizations and reports simply by describing their needs in natural language. This eliminates the complexity often associated with traditional BI tools, making data analysis accessible and efficient for everyone.
How to use ChatBiReport
Using ChatBiReport involves four straightforward steps:
- Upload Data: Begin by uploading your Excel or CSV files. The system automatically detects the data structure and types, preparing it for analysis.
- Describe Your Needs: Tell the AI what you want to visualize using natural language. For example, you can say, "Show me sales by region" or "Create a pie chart of customer segments."
- AI Generates Charts: Based on your description, the AI instantly creates beautiful, interactive charts and visualizations.
- Share & Collaborate: Once your reports are generated, you can easily share them publicly or with your team, allowing others to view and like your creations, fostering knowledge sharing across your organization.
Core Features of ChatBiReport
- Natural Language Processing for Chart Generation: Create visualizations by simply describing your requirements.
- Data Upload Flexibility: Supports Excel and CSV file formats.
- Automatic Data Detection: System intelligently identifies data structure and types upon upload.
- Interactive Chart Creation: Generates beautiful and interactive data visualizations.
- Collaboration Tools: Enables sharing reports publicly or privately with team members.
- Enterprise-Grade Security: Ensures the security and reliability of your data.
- Privacy Controls: Allows users to choose what data to share publicly or keep private.
Use Cases for ChatBiReport
ChatBiReport is ideal for a wide range of business intelligence and data analysis scenarios, including:
- Sales Performance Analysis: Quickly visualize sales trends by region, product, or customer segment.
- Marketing Campaign Reporting: Generate reports on campaign effectiveness, customer demographics, and engagement metrics.
- Financial Reporting: Create interactive charts for budget analysis, expense tracking, and revenue forecasting.
- Operational Dashboards: Monitor key performance indicators (KPIs) and operational efficiency with real-time visualizations.
- Customer Segmentation: Understand customer groups and behaviors through visual data representations.
- Market Research Visualization: Transform survey data and market trends into easily digestible reports.
Advantages of ChatBiReport
ChatBiReport offers several key advantages that streamline data analysis and reporting:
- Lightning Fast: Generate professional charts and reports in seconds, significantly reducing the time spent on data visualization compared to complex BI tools.
- Ease of Use: Its natural language interface eliminates the steep learning curve associated with traditional business intelligence software, making it accessible to users of all skill levels.
- Enhanced Team Collaboration: Facilitates seamless sharing of insights within teams and across organizations through public or private report sharing options.
- Secure & Reliable: Provides enterprise-grade security for your data, giving users control over privacy settings for their reports.
- Cost-Effective: By simplifying the BI process, it reduces the need for specialized data analysts or extensive training, offering a more efficient solution for data insights.
ChatBiReport Frequently Asked Questions
ChatBiReport Comments (0)
Log in to post comments
Log in nowChatBiReport Alternatives
View All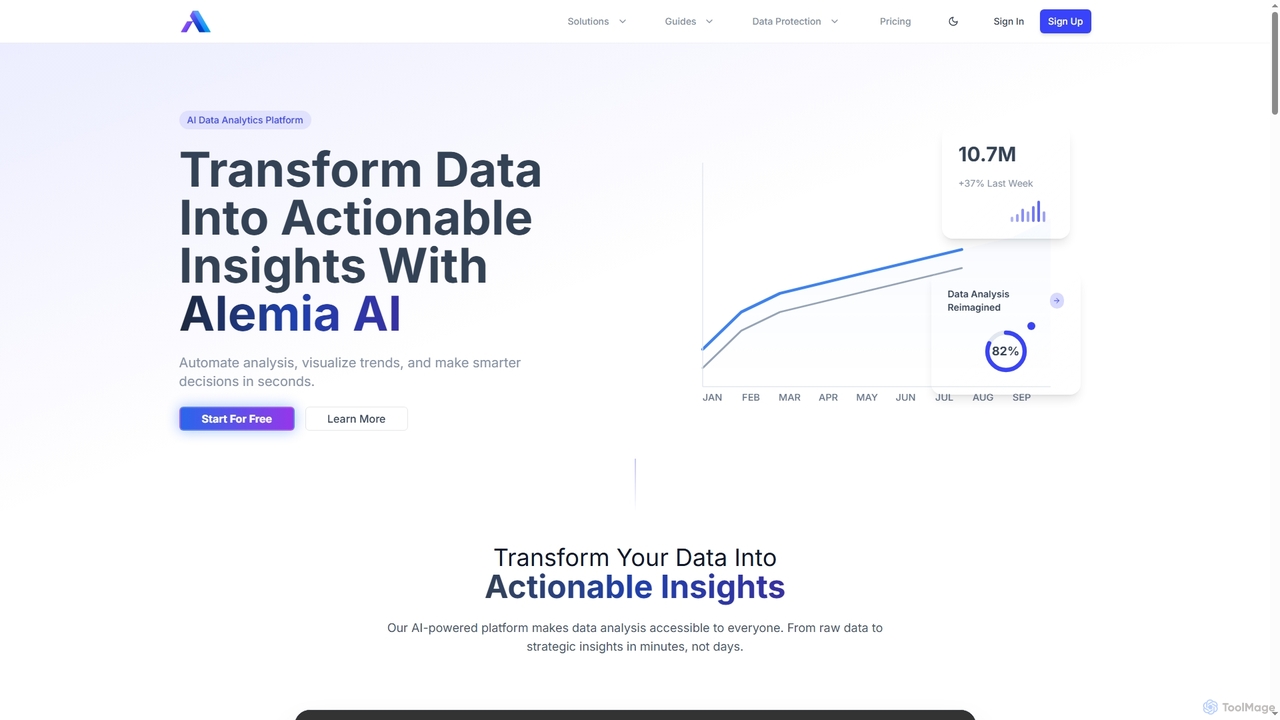
Alemia
Alemia is an AI-powered data analytics platform that transforms raw data into actionable insights, visualizations, and reports. It …
Alemia is an AI-powered data analytics platform that transforms raw data into actionable insights, visualizations, and reports. It enables users to ask questions in plain English and receive instant, intelligent analysis, making data-driven decision-making accessible to everyone without requiring technical skills.
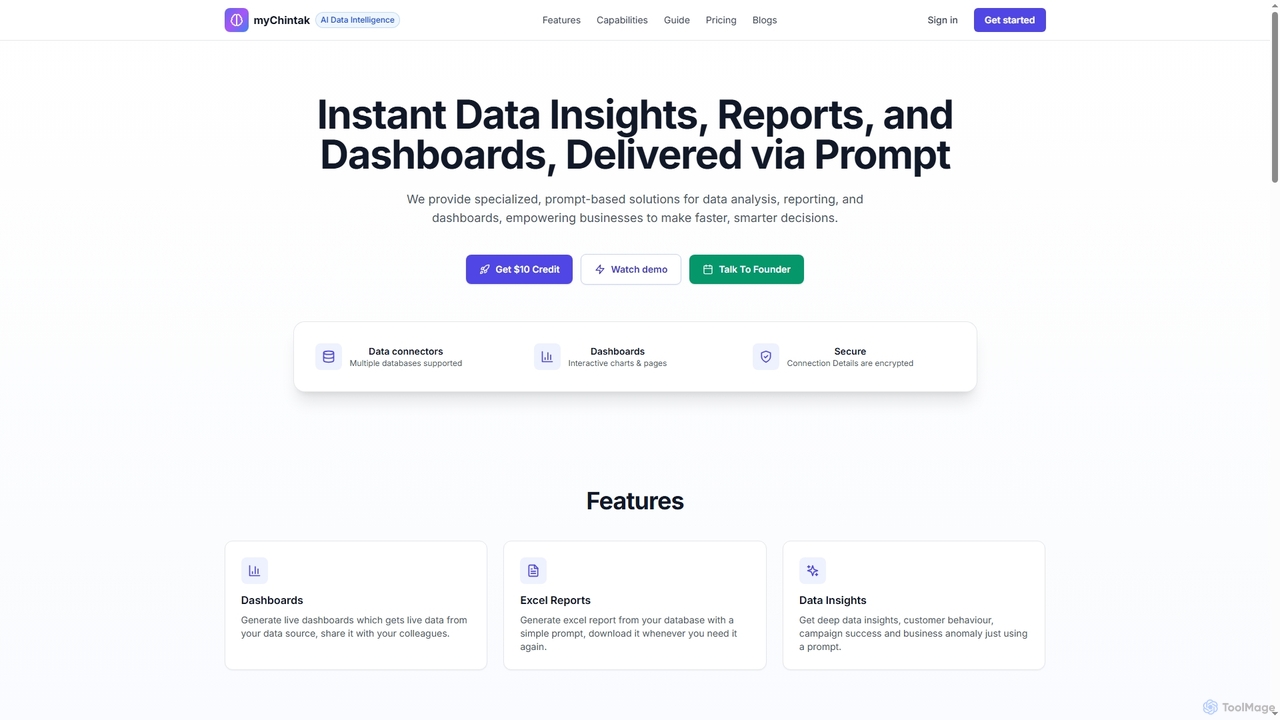
myChintak
myChintak is an AI-powered platform that transforms natural language prompts into instant data insights, dynamic reports, and interactive …
myChintak is an AI-powered platform that transforms natural language prompts into instant data insights, dynamic reports, and interactive dashboards. It connects to various data sources, enabling businesses to quickly analyze performance, understand customer behavior, and make data-driven decisions without complex coding.
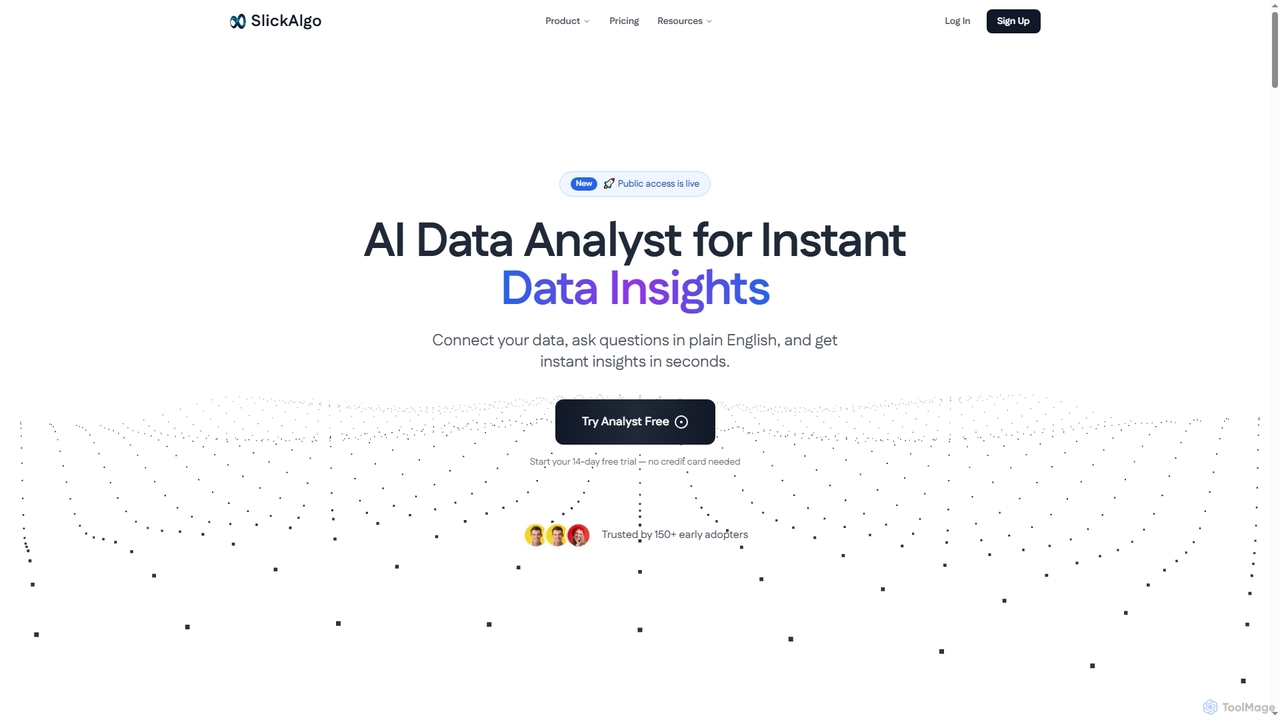
SlickAlgo
SlickAlgo is an AI data analyst platform that transforms natural language questions into instant data insights, Python code, …
SlickAlgo is an AI data analyst platform that transforms natural language questions into instant data insights, Python code, and interactive dashboards. It connects to over 50 data sources, enabling businesses to make data-driven decisions without coding.
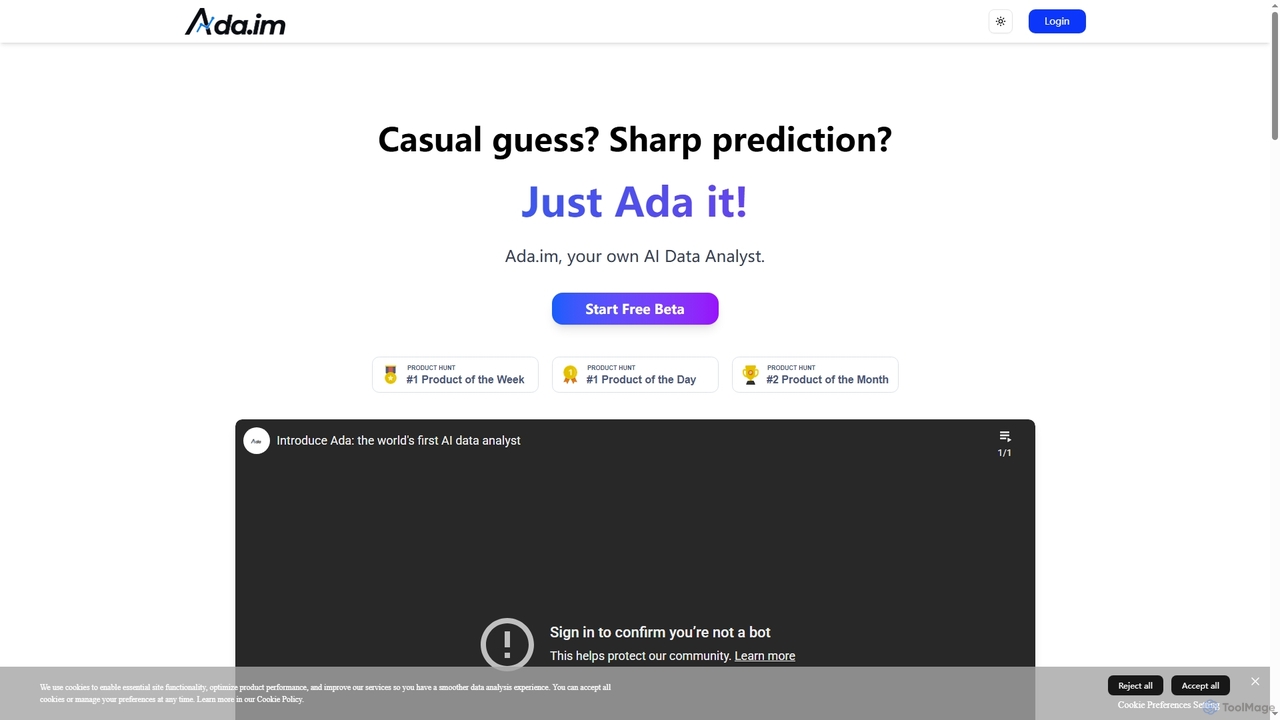
Ada
Ada is an AI-powered data analyst platform that connects to diverse data sources to automatically generate enterprise-grade reports. …
Ada is an AI-powered data analyst platform that connects to diverse data sources to automatically generate enterprise-grade reports. It transforms complex data into visual insights and strategic recommendations in minutes, featuring a flexible editor for human refinement.
Claribi
Claribi is an AI-powered tool that transforms Power BI usage by enabling natural language queries, automating documentation, and …
Claribi is an AI-powered tool that transforms Power BI usage by enabling natural language queries, automating documentation, and providing intelligent assistance for report creation and debugging. It offers effortless access to meaningful insights, cross-report discovery, and ensures enterprise-grade data security by working exclusively with metadata.
ChartGen
ChartGen is an AI-powered chart generator that transforms raw data into stunning, professional visualizations in seconds. Users simply …
ChartGen is an AI-powered chart generator that transforms raw data into stunning, professional visualizations in seconds. Users simply upload CSV or Excel files, describe their desired chart in plain English, and the AI instantly creates various chart types like bar, line, and pie charts. It's designed for quick, effortless data visualization without requiring design or coding skills.
Graphy
Graphy is an AI-powered data visualization tool that transforms raw data into beautiful, interactive charts and graphs in …
Graphy is an AI-powered data visualization tool that transforms raw data into beautiful, interactive charts and graphs in seconds. It simplifies data storytelling by automatically identifying key insights, allowing users to chat with their data, and offering extensive customization. Ideal for marketers, analysts, and teams who need to create compelling visual reports and presentations without complex software.

EasyAIBridge
EasyAIBridge transforms your spreadsheets into instant, actionable insights using advanced AI. Simply type your questions in natural language, …
EasyAIBridge transforms your spreadsheets into instant, actionable insights using advanced AI. Simply type your questions in natural language, and AI automatically generates charts, reports, and data extractions from Google Sheets, Excel, and CSV files, making complex data analysis effortless and secure.
Lection
Lection is an AI-powered web scraping agent that allows users to extract structured data from any website using …
Lection is an AI-powered web scraping agent that allows users to extract structured data from any website using natural language. It automates data collection, integrates with popular workflows, and provides clean, validated data without requiring any coding expertise.
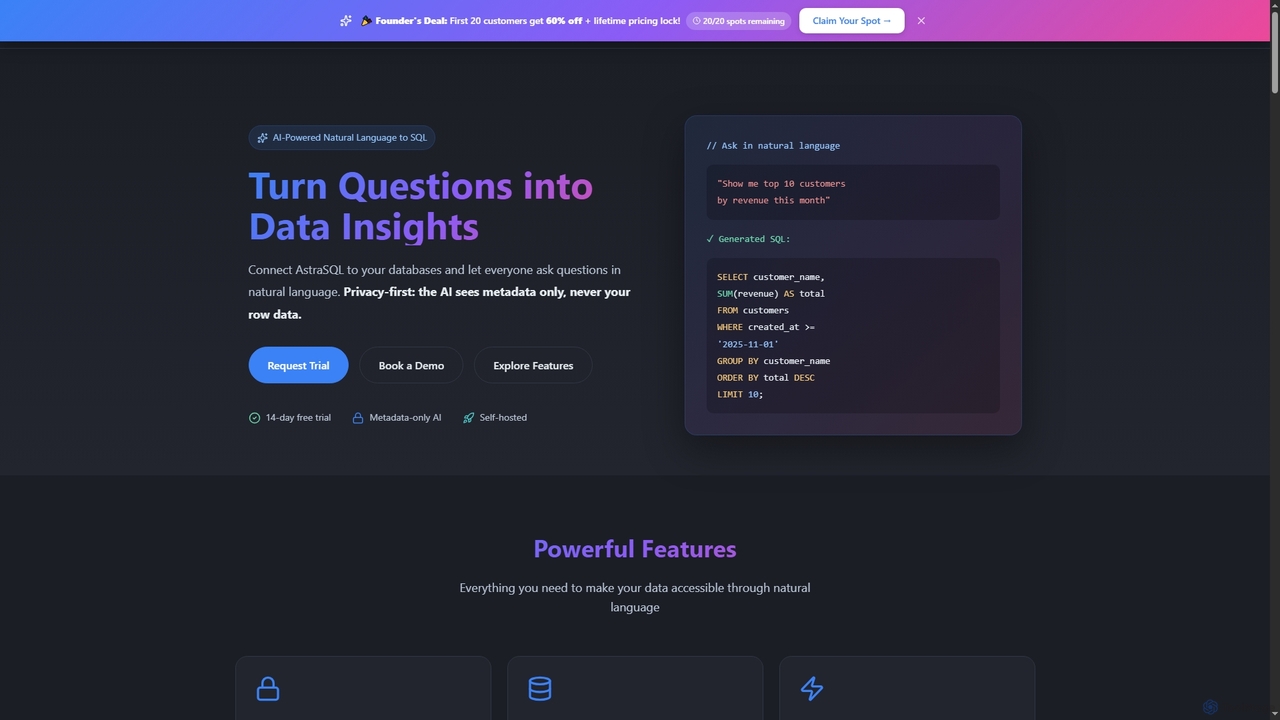
AstraSQL
AstraSQL is an AI-powered agent that transforms natural language queries into complex, correct SQL, enabling privacy-first database analytics. …
AstraSQL is an AI-powered agent that transforms natural language queries into complex, correct SQL, enabling privacy-first database analytics. It supports multiple databases, offers interactive dashboards, and ensures enterprise-grade security, making data accessible to non-technical users.
ChatBiReport Category
ChatBiReport Tag
ChatBiReport Applicable Job
ChatBiReport AI Tool Comparison
ChatBiReport Embed Feature
Just copy the embed code below and paste this beautiful badge on your blog, article, or official app website to drive traffic directly to this tool's detail page and quickly boost your exposure and user count!

No comments yet, be the first to comment!