ChartGen
Visit Website


ChartGen Overview
ChartGen is an innovative AI-powered tool designed to simplify and accelerate the process of creating professional data visualizations. As a core product capability of Ada.im, the world's first AI Data Analyst platform, ChartGen leverages advanced artificial intelligence and natural language processing to convert complex data into clear, actionable charts within seconds. It eliminates the need for manual design or coding expertise, making sophisticated data visualization accessible to everyone from business analysts to marketing professionals.
How to use ChartGen
Using ChartGen is a straightforward three-step process. First, users upload their data, typically in CSV or Excel format, or paste it directly into the interface. The AI automatically detects column types and data structures. Second, users describe the desired chart using natural language prompts, such as "create a bar chart showing sales by region" or "show me profit trend over time as a line chart." Finally, ChartGen's AI instantly generates the visualization. Users can then customize colors, labels, aggregation methods, and export the chart for reports, presentations, or dashboards. For advanced export options like PDF, Word, or interactive dashboards, registering for a free Ada.im account is required.
Core Features of ChartGen
- Instant AI Chart Generation: Transforms data into professional charts in seconds using AI.
- Natural Language Chart Creation: Generate charts by simply describing requirements in plain English, no coding needed.
- Multiple Chart Types Supported: Offers 9 professional chart types including Bar, Line, Pie, Area, Scatter, Heatmap, Combo, Waterfall, and Funnel Charts.
- Smart Data Import: Supports CSV and Excel files, direct data pasting, with automatic column detection and data type inference.
- Professional Color Themes: Provides 12 professionally designed color palettes and custom color options.
- Flexible Data Configuration: Allows customization of aggregation methods (Sum, Average, Count, Min, Max, Count Distinct), sorting, labels, and axes.
- AI-Powered Insights: Generates meaningful data insights, highlighting trends, outliers, and key statistics alongside visualizations.
- Enterprise-Ready Security: SOC 2 compliant with end-to-end encryption, ensuring data privacy and security.
- Export & Sharing: Download charts as high-quality PNG images; SVG, PDF, Word, PPT, and interactive dashboard exports are available via a free Ada.im account.
Use Cases for ChartGen
ChartGen is versatile and can be applied across numerous industries and functions. In finance and accounting, it helps in creating clear quarterly reports, revenue analysis, and profit visualizations. Marketing and growth teams can visualize campaign performance, channel attribution, and ROI metrics. Sales professionals can track performance, compare figures across regions, and analyze market share. HR analytics benefits from visualizing resource utilization, while researchers can use scatter plots for correlation analysis. Its ability to quickly transform data into visual insights makes it invaluable for business analysts, product managers, and executives making data-driven decisions.
Advantages of ChartGen
The primary advantage of ChartGen is its unparalleled speed and ease of use, drastically reducing the time and effort required for data visualization. Users can create complex charts without any technical skills or design expertise. The AI's ability to understand natural language requests and automatically select optimal chart types ensures professional-quality output every time. Its robust security measures, including SOC 2 compliance, provide peace of mind for handling sensitive business data. Furthermore, its integration with the broader Ada.im platform offers a clear upgrade path for users requiring more advanced data analysis, reporting, and team collaboration features.
Pricing and Plans
ChartGen offers a freemium model. Users can generate up to 50 free charts per month with access to all chart types and color themes. For unlimited chart generation, advanced export options (like SVG and PDF), team collaboration features, and full access to the comprehensive Ada.im data analysis suite, users can upgrade to a premium plan. A free account for Ada.im is available, requiring no credit card to start.
ChartGen Frequently Asked Questions
ChartGen Comments (0)
Log in to post comments
Log in nowChartGenWebsite Traffic Analysis
Latest Traffic
Status
Monthly Traffic Trend
Geography
Top 5 Countries/Regions
-
🇺🇸 United States33.03%
-
🇮🇳 India31.47%
-
🇷🇺 Russia13.81%
-
🇬🇧 United Kingdom12.26%
-
🇮🇩 Indonesia9.43%
Traffic source
| Source Type | Percentage |
|---|---|
|
Direct Access
|
79.63% |
|
Referral
|
19.56% |
|
Email
|
0.81% |
Popular Keywords
| Keyword | Cost Per Click |
|---|---|
|
$0.00
|
|
|
$5.05
|
|
|
$0.00
|
|
|
$0.00
|
|
|
$0.00
|
ChartGen Alternatives
View All
SlickAlgo
SlickAlgo is an AI data analyst platform that transforms natural language questions into instant data insights, Python code, …
SlickAlgo is an AI data analyst platform that transforms natural language questions into instant data insights, Python code, and interactive dashboards. It connects to over 50 data sources, enabling businesses to make data-driven decisions without coding.
Powerdrill
Powerdrill is an AI-powered data analysis platform designed for serious data work, enabling users to unlock 100x efficiency. …
Powerdrill is an AI-powered data analysis platform designed for serious data work, enabling users to unlock 100x efficiency. It automates the entire process from data processing and cleaning to visualization, report generation, and trend forecasting. Simply upload your files (Excel, CSV, PDF) or connect to a database, and let the AI generate actionable insights, interactive charts, and comprehensive presentations in minutes.
Metatable
Metatable is an AI-powered data assistant that revolutionizes how you interact with spreadsheets and tabular data. Simply use …
Metatable is an AI-powered data assistant that revolutionizes how you interact with spreadsheets and tabular data. Simply use natural language prompts to clean, analyze, transform, and visualize your data instantly. It eliminates complex formulas and manual tasks, making data analysis accessible to everyone, from data analysts to business managers.

Viewit Ai Chatbot
An AI-powered chatbot that transforms your data into insightful visualizations and summaries through simple, natural language conversations. Upload …
An AI-powered chatbot that transforms your data into insightful visualizations and summaries through simple, natural language conversations. Upload your dataset, ask questions, and instantly receive charts, graphs, and key metrics, making data analysis accessible to everyone without needing complex software or coding skills.
InsightJini
InsightJini is an AI-powered data analysis tool that lets you chat with your Excel and CSV files. Upload …
InsightJini is an AI-powered data analysis tool that lets you chat with your Excel and CSV files. Upload your data to instantly generate visualizations and insights without any coding. Its conversational interface, powered by ChatGPT, makes data exploration intuitive and accessible for everyone.
Lazy Admin
Lazy Admin is an AI-powered data analysis and reporting solution designed primarily for Salesforce. It enables users to …
Lazy Admin is an AI-powered data analysis and reporting solution designed primarily for Salesforce. It enables users to query data, generate charts, and create dashboards using natural language. The tool emphasizes security by keeping all data within your environment and can be personalized to understand your specific business terminology, making data insights accessible to everyone on your team.
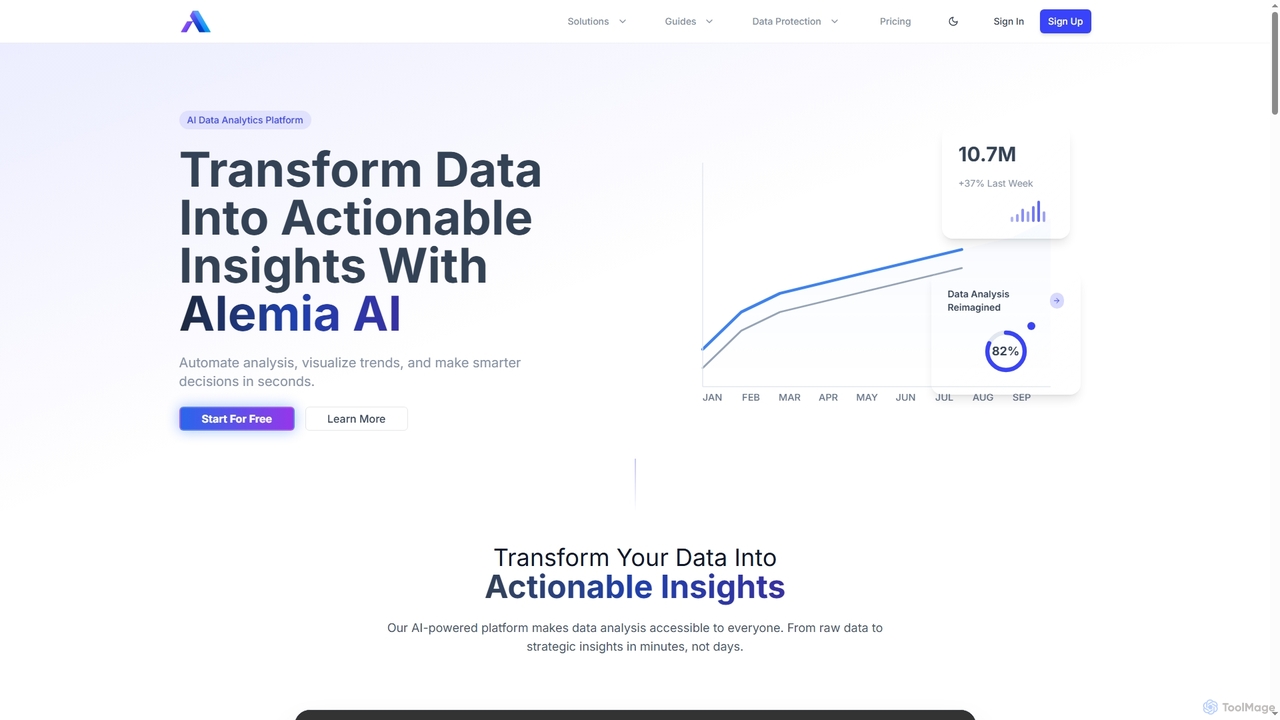
Alemia
Alemia is an AI-powered data analytics platform that transforms raw data into actionable insights, visualizations, and reports. It …
Alemia is an AI-powered data analytics platform that transforms raw data into actionable insights, visualizations, and reports. It enables users to ask questions in plain English and receive instant, intelligent analysis, making data-driven decision-making accessible to everyone without requiring technical skills.
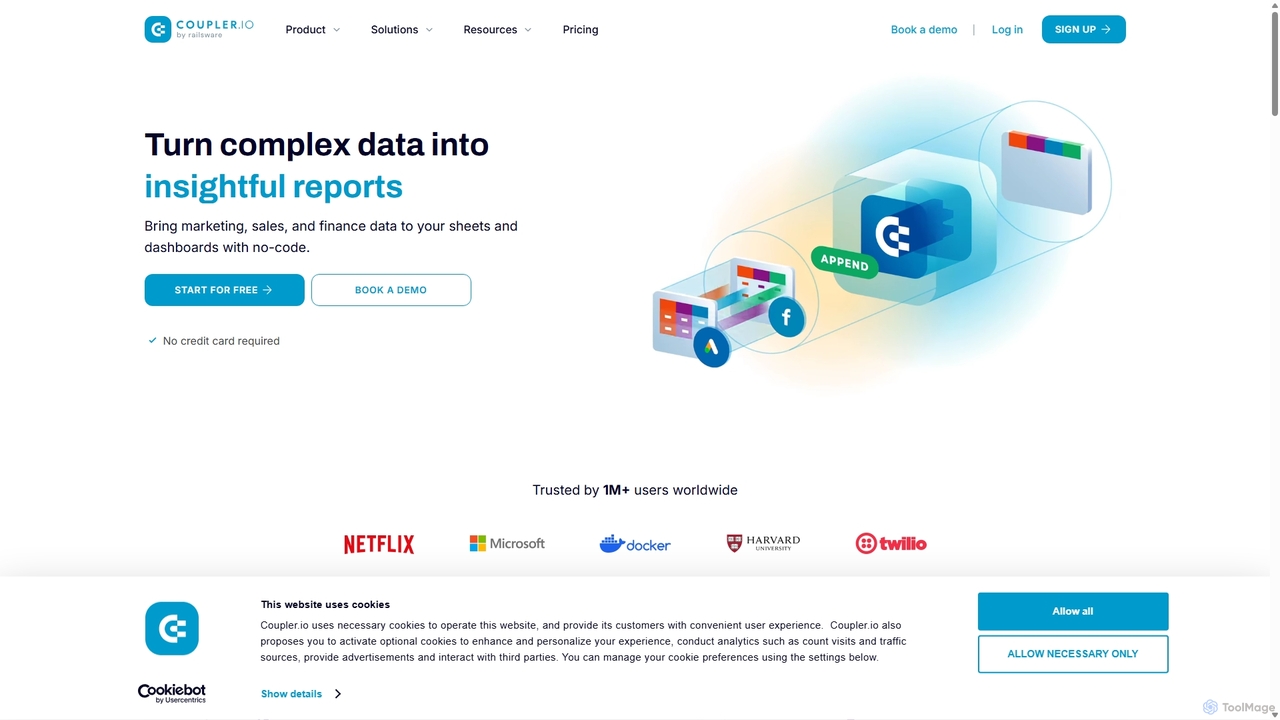
Coupler.io
Coupler.io is a no-code data analytics and automation platform that helps businesses connect disparate data sources from marketing, …
Coupler.io is a no-code data analytics and automation platform that helps businesses connect disparate data sources from marketing, sales, and finance apps to spreadsheets, data warehouses, or BI tools. It automates data collection, transforms raw data into analysis-ready formats, and provides AI-powered insights and pre-built dashboard templates for faster, smarter decision-making.
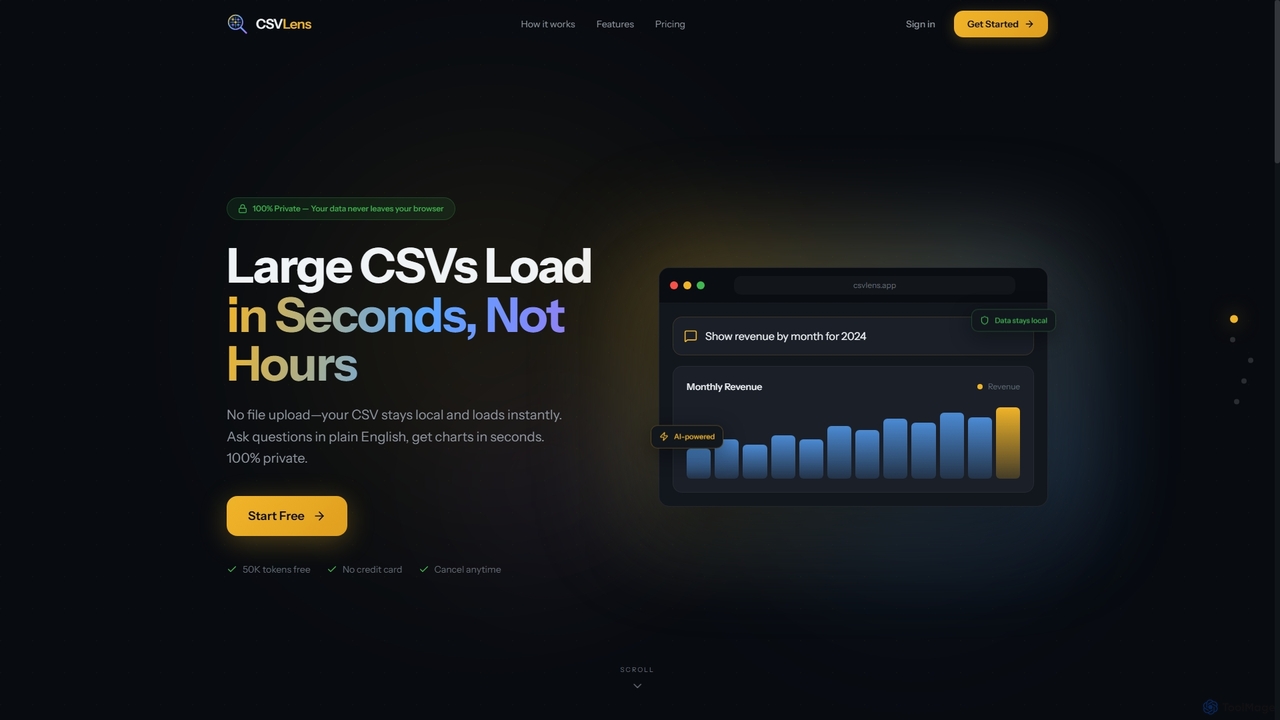
CSVLens
CSVLens is an AI-powered CSV analyzer that allows users to load large CSV files instantly and ask questions …
CSVLens is an AI-powered CSV analyzer that allows users to load large CSV files instantly and ask questions in plain English to get immediate insights and charts. It processes data 100% locally in your browser, ensuring privacy and speed without any file uploads.
Graphy
Graphy is an AI-powered data visualization tool that transforms raw data into beautiful, interactive charts and graphs in …
Graphy is an AI-powered data visualization tool that transforms raw data into beautiful, interactive charts and graphs in seconds. It simplifies data storytelling by automatically identifying key insights, allowing users to chat with their data, and offering extensive customization. Ideal for marketers, analysts, and teams who need to create compelling visual reports and presentations without complex software.
ChartGen Category
ChartGen Tag
ChartGen Applicable Job
ChartGen AI Tool Comparison
ChartGen Embed Feature
Just copy the embed code below and paste this beautiful badge on your blog, article, or official app website to drive traffic directly to this tool's detail page and quickly boost your exposure and user count!

No comments yet, be the first to comment!