ChartGen
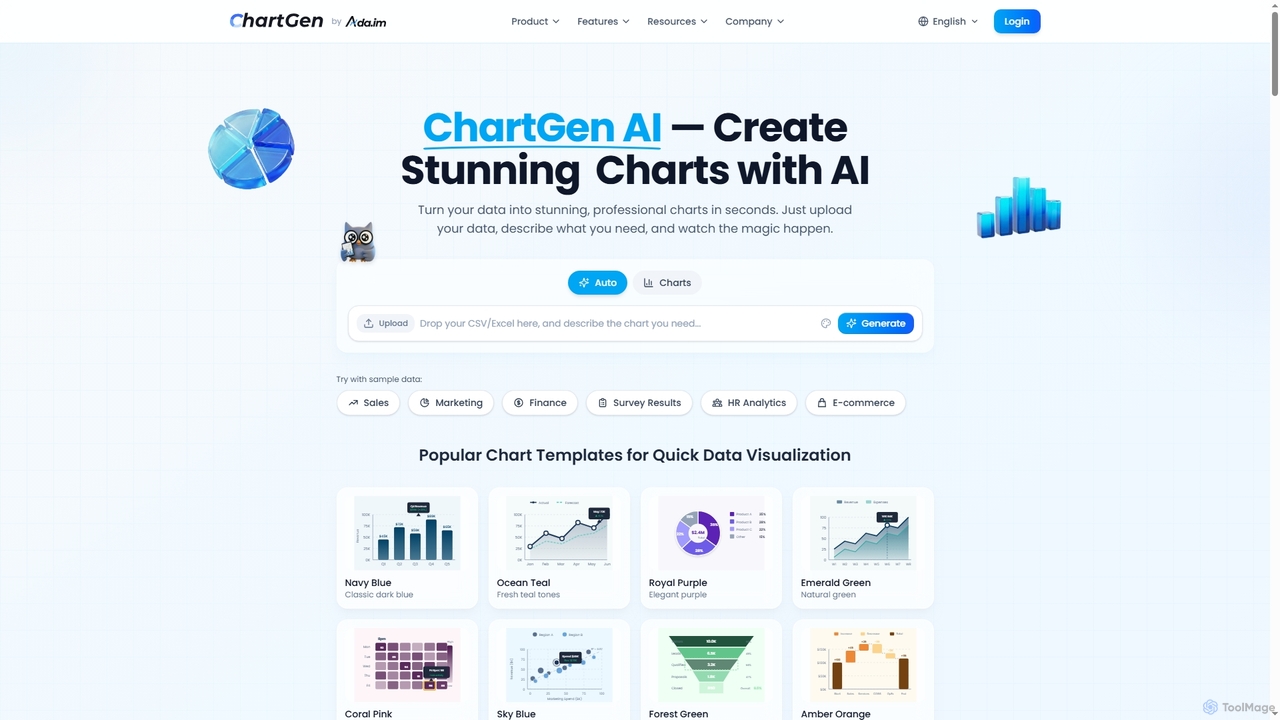
ChartGen is an AI-powered chart generator that transforms raw data into stunning, professional visualizations in seconds. Users simply …
ChartGen is an AI-powered chart generator that transforms raw data into stunning, professional visualizations in seconds. Users simply upload CSV or Excel files, describe their desired chart in plain English, and the AI instantly creates various chart types like bar, line, and pie charts. It's designed for quick, effortless data visualization without requiring design or coding skills.

AiBiao
AiBiao is an AI-powered tool that instantly generates professional charts and diagrams from text descriptions. It streamlines the …
AiBiao is an AI-powered tool that instantly generates professional charts and diagrams from text descriptions. It streamlines the creation of visual data for presentations, reports, and online content, significantly boosting productivity by eliminating manual drawing processes.
About Charts & Diagrams
AI Charts & Diagrams tools are a class of software that uses artificial intelligence to automatically generate visual representations of data, systems, and processes. These tools interpret natural language prompts, raw data, or even code to create flowcharts, mind maps, sequence diagrams, and various graphs. They significantly accelerate the process of data visualization and system design, making complex information easier to understand and communicate. Unlike traditional manual tools, they lower the technical barrier, allowing users to focus on logic and insights rather than the drawing process itself.
Core Features
- Text-to-Diagram Generation: Converts natural language descriptions or structured text into complex diagrams like flowcharts, UML, or mind maps.
- Automated Data Visualization: Analyzes datasets (e.g., CSV, JSON) and automatically suggests and creates the most suitable chart type to represent the information.
- Smart Layout & Formatting: Intelligently arranges diagram elements, connectors, and labels for optimal readability and aesthetic appeal.
- Code-to-Diagram Conversion: Parses source code or database schemas to generate visual representations like class diagrams or ERDs automatically.
- Real-time Collaboration: Allows multiple users to edit and comment on diagrams simultaneously, streamlining team-based design and review processes.
Use Cases
These tools are widely used in software engineering for creating UML and architecture diagrams, in business analysis for mapping process flows (BPMN), and in project management for building mind maps and timelines. Data analysts and scientists also use them to quickly generate insightful charts from raw data for reports and dashboards, simplifying the communication of complex findings to non-technical stakeholders.
How to Choose
When selecting an AI chart and diagram tool, first consider the specific diagram types you need (e.g., UML, ERD, flowcharts). Evaluate the supported input methods—whether you need text, data file, or code-based generation. Check for integration capabilities with your existing workflow tools like Jira, Confluence, or GitHub. Finally, assess the level of customization and the available export formats (e.g., SVG, PNG, PDF) to ensure the output meets your presentation and documentation standards.
Charts & DiagramsUse Cases
Automating Software Architecture Diagrams
A software architect needs to document a new microservices architecture for team alignment and future reference. Instead of manually drawing boxes and lines in a traditional tool, they write a description using a simple syntax like Mermaid or PlantUML. The AI diagramming tool instantly parses this text and generates a professional, clean component or sequence diagram. This process drastically reduces documentation time, ensures all diagrams are consistent, and allows for quick updates by simply modifying the source text, keeping the documentation in sync with the code.
Visualizing Business Process Flows
A business analyst is tasked with mapping a complex customer onboarding workflow to identify bottlenecks. They type out the process steps in plain English, such as 'Customer submits form -> System validates data -> If valid, create account -> Send welcome email'. The AI tool converts this narrative into a standard BPMN or flowchart diagram. This allows stakeholders to quickly visualize the entire process, provide feedback, and collaboratively refine the workflow, leading to improved efficiency and a better customer experience without needing specialized diagramming skills.
Generating Mind Maps for Brainstorming
A product manager is leading a brainstorming session for a new feature. They start with a central topic and begin typing related ideas. The AI mind mapping tool automatically arranges these ideas into a balanced, hierarchical structure. It can also suggest related concepts or group similar ideas together, fostering a more dynamic and organized creative process. The final mind map serves as a clear visual summary of the session, easily shareable and convertible into an actionable project plan, all created without the distraction of manual formatting.
Creating Data-Driven Presentation Charts
A data analyst needs to prepare several charts for a quarterly business review. Instead of manually creating each chart in a spreadsheet program, they upload a CSV file to an AI charting tool. The tool automatically analyzes the data, identifies key relationships, and suggests the most effective chart types, such as a bar chart for sales comparison and a line chart for growth trends. The analyst can then quickly customize colors and labels to match the company's branding, generating a full suite of presentation-ready visuals in a fraction of the time.
Mapping Database Schemas from SQL
A backend developer joins a project with a large, undocumented legacy database. To quickly understand its structure, they paste the SQL `CREATE TABLE` scripts into an AI diagramming tool. The tool parses the SQL, identifies tables, columns, data types, and foreign key relationships, and automatically generates a comprehensive Entity-Relationship Diagram (ERD). This visual map provides an instant, clear overview of the database architecture, significantly accelerating the developer's onboarding process and aiding in future database migration or refactoring tasks.
Building Cloud Infrastructure Diagrams
A DevOps engineer is planning a new cloud deployment on AWS. They need to create a clear architecture diagram for security review and team communication. Using an AI diagramming tool, they describe the infrastructure in text, such as 'A public-facing Application Load Balancer routes traffic to an Auto Scaling Group of EC2 instances in private subnets'. The tool generates a professional cloud architecture diagram using standard AWS icons and connections. This automates the tedious task of finding and arranging icons, ensures adherence to best practices, and produces clear, standardized documentation for compliance and collaboration.