Kanaries
Visit Website
Kanaries Overview
Kanaries is a comprehensive, AI-powered workspace dedicated to simplifying and accelerating the process of exploratory data analysis (EDA) and data visualization. It provides a suite of powerful tools designed to cater to various workflows, from Python notebooks to R environments and from desktop applications to embeddable web components. The core mission of Kanaries is to transform raw data into actionable insights with minimal effort, empowering users to visualize, analyze, and discover patterns through an intuitive interface.
The platform is built around a collection of specialized tools. For data scientists and developers, PyGWalker allows for the transformation of pandas or polars DataFrames into an interactive, Tableau-like user interface directly within Jupyter Notebooks using just one line of code. Similarly, GWalkR brings this same powerful, interactive visualization capability to the R ecosystem, integrating seamlessly with RStudio and R Markdown. For users who prefer a dedicated environment, Graphic Walker Desktop offers a native application for macOS and Windows, enabling high-performance, offline data analysis. Furthermore, the Graphic Walker Component allows developers to embed this interactive visual analytics tool into their own web applications, making it easy to build custom BI tools.
A standout feature is the AI integration. Runcell.dev acts as an AI Code Agent within your Jupyter Notebook, understanding your code and data to provide intelligent suggestions and inline code completions. The VizChat feature allows users to interact with their data using natural language, asking questions and receiving insights and visualizations in return. This conversational approach to data analysis significantly lowers the barrier to entry for complex data exploration.
How to use Kanaries
Using Kanaries is flexible and depends on your specific needs and environment:
- For Python Users (Jupyter/Notebooks): Install the PyGWalker library. In your notebook, import the library and pass your pandas or polars DataFrame to PyGWalker with a single function call. This will instantly render an interactive UI for exploration.
- For R Users (RStudio): Install the GWalkR package. Use the `gwalkr()` function on your R data frame to launch the interactive visualization tool within your R environment.
- For Desktop Analysis: Download and install the Graphic Walker Desktop application for your operating system (Windows or macOS). You can then import local data files (like CSV, JSON, Excel) and start building visualizations through its drag-and-drop interface.
- For Natural Language Querying: Within the Kanaries platform, use the VizChat feature. Connect your data source and start asking questions in plain English, such as "Show me the total sales by region" or "What is the correlation between price and user rating?"
- For Web Developers: Utilize the Graphic Walker Component by integrating it into your React, Vue, or Angular application to provide your end-users with powerful, embedded data exploration capabilities.
Core Features of Kanaries
- AI-Powered Data Exploration: Leverage AI through VizChat to query data using natural language and Runcell.dev for AI-assisted coding in Jupyter.
- Interactive Drag-and-Drop Visualization: Easily create complex charts and dashboards by dragging and dropping data fields, similar to Tableau.
- Seamless Notebook Integration: One-line code integration with Jupyter Notebooks (PyGWalker) and RStudio (GWalkR).
- Multi-Format Data Support: Connect to and visualize data from various sources, including CSV, JSON, Parquet, Excel, SQLite, PostgreSQL, Snowflake, and more.
- Cross-Platform Tools: A suite of tools including Python/R libraries, a standalone desktop app, and an embeddable web component.
- Team Collaboration: Share charts, data, and insights with team members to facilitate collaborative decision-making.
- Offline Capabilities: The Graphic Walker Desktop app allows for secure, offline data analysis without an internet connection.
- Embeddable Analytics: Easily embed a powerful visual analytics component into your own web applications.
Use Cases for Kanaries
Kanaries is versatile and can be applied in numerous scenarios:
- Data Scientists: To rapidly perform EDA on new datasets within their existing notebook workflows, identify trends, and clean data before modeling.
- Data Analysts: To quickly build interactive dashboards and reports from various data sources without writing extensive code, and share findings with stakeholders.
- Business Intelligence (BI) Professionals: To prototype BI dashboards and explore data on the fly, complementing larger, more rigid BI systems.
- Software Developers: To embed rich, interactive data visualization features into custom applications, providing more value to their users.
- Students and Educators: To teach and learn data analysis and visualization concepts in an interactive and intuitive environment.
Advantages of Kanaries
The primary advantage of Kanaries is its ability to dramatically increase efficiency in the data analysis workflow. It bridges the gap between code-first data science and no-code BI tools. By embedding a powerful, interactive UI directly into coding environments like Jupyter, it saves countless hours that would otherwise be spent writing boilerplate visualization code. The AI features further accelerate this process by automating code generation and enabling natural language interaction. Its flexibility, offering tools for different platforms and use cases, makes it a scalable solution for individuals and teams alike.
Pricing and Plans
Kanaries offers a freemium model with plans tailored to different users:
- Education Plan: Free. This plan is designed for students and educators and requires verification with an educational email address. It includes all the features of the Pro plan and collaboration capabilities.
- Pro Plan: $10.75 per month (billed annually at $129.00). This plan includes a 5-day free trial, GPT-powered data exploration, team collaboration, dashboard sharing, and support for more data sources like DuckDB, PostgreSQL, and Snowflake.
- Enterprise Plan: Custom pricing. This plan is for large organizations and offers features like SSO integration, self-deployment options, engineering support, and support for large-scale data with OLAP engine integration.
Kanaries Comments (0)
Log in to post comments
Log in nowKanariesWebsite Traffic Analysis
Latest Traffic
Status
Monthly Traffic Trend
Geography
Top 5 Countries/Regions
-
🇨🇳 China30.59%
-
🇰🇷 Korea, Republic of20.64%
-
🇺🇸 United States19.75%
-
🇫🇷 France16.20%
-
🇮🇳 India12.82%
Traffic source
| Source Type | Percentage |
|---|---|
|
Direct Access
|
56.18% |
|
Referral
|
43.82% |
Popular Keywords
| Keyword | Cost Per Click |
|---|---|
|
$0.14
|
|
|
$0.00
|
|
|
$4.09
|
|
|
$0.56
|
|
|
$2.28
|
Kanaries Alternatives
View All
Graphy
Graphy is an AI-powered data visualization tool that transforms raw data into beautiful, interactive charts and graphs in …
Graphy is an AI-powered data visualization tool that transforms raw data into beautiful, interactive charts and graphs in seconds. It simplifies data storytelling by automatically identifying key insights, allowing users to chat with their data, and offering extensive customization. Ideal for marketers, analysts, and teams who need to create compelling visual reports and presentations without complex software.
Quadratic
Quadratic is a powerful AI spreadsheet that integrates a familiar interface with Python, SQL, and natural language prompts. …
Quadratic is a powerful AI spreadsheet that integrates a familiar interface with Python, SQL, and natural language prompts. Connect directly to live databases, analyze data, extract information from PDFs, and create visualizations instantly. It's a secure, collaborative platform for data analysts, business professionals, and developers.
Deepnote
Deepnote is an AI-powered, collaborative data science notebook for teams. It unifies Python, SQL, and R in a …
Deepnote is an AI-powered, collaborative data science notebook for teams. It unifies Python, SQL, and R in a single cloud-based workspace, enabling users to explore data, build machine learning models, and create interactive dashboards and apps with ease. Powered by GPT-4o, it automates analysis and code generation, making data science accessible to all skill levels.
Vanna.AI
Vanna.AI is an open-source, personalized AI SQL agent that transforms natural language questions into accurate SQL queries. It …
Vanna.AI is an open-source, personalized AI SQL agent that transforms natural language questions into accurate SQL queries. It uses a Retrieval-Augmented Generation (RAG) model trained on your specific database schema, documentation, and past queries to achieve high accuracy on complex datasets. It's designed for security, flexibility, and easy integration into any application, empowering both technical and non-technical users to gain insights from their data effortlessly.
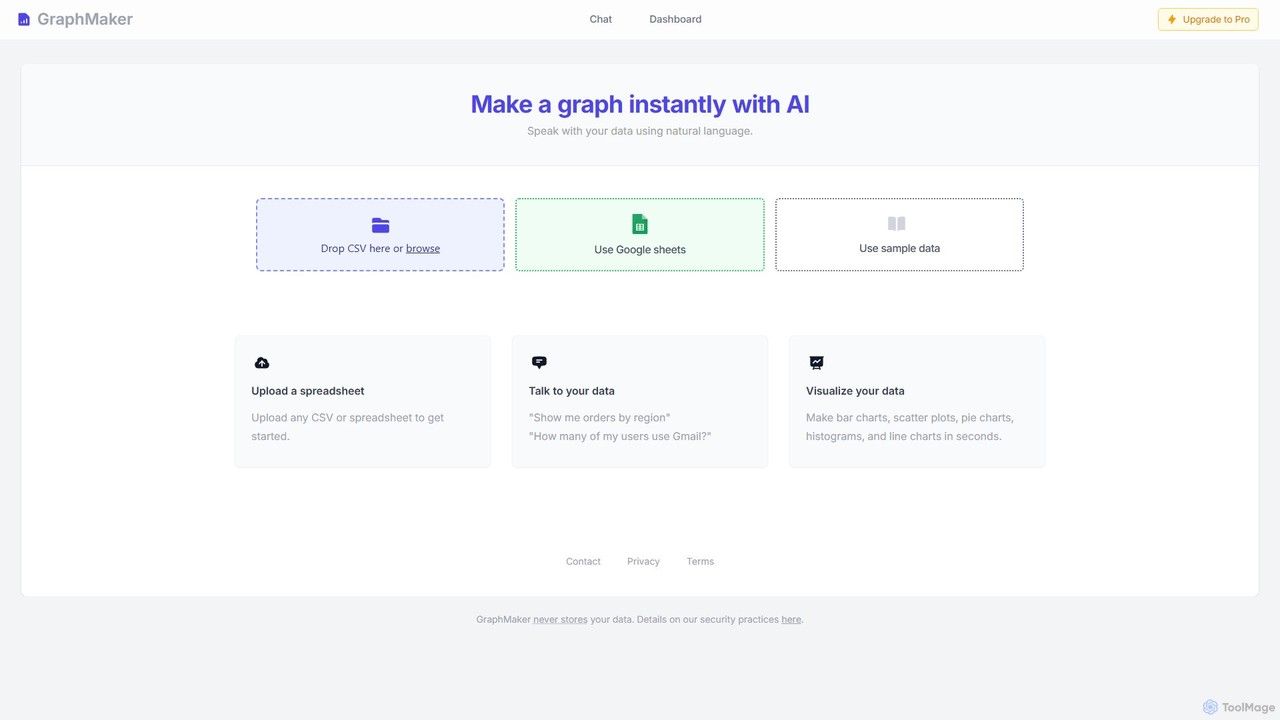
GraphMaker
GraphMaker is an AI-powered data visualization tool that allows you to create various charts and graphs in seconds. …
GraphMaker is an AI-powered data visualization tool that allows you to create various charts and graphs in seconds. Simply upload your data from a CSV file or Google Sheets, and use natural language commands to generate insightful visualizations like bar charts, pie charts, and histograms. It's designed for speed, simplicity, and security, as it never stores your data.
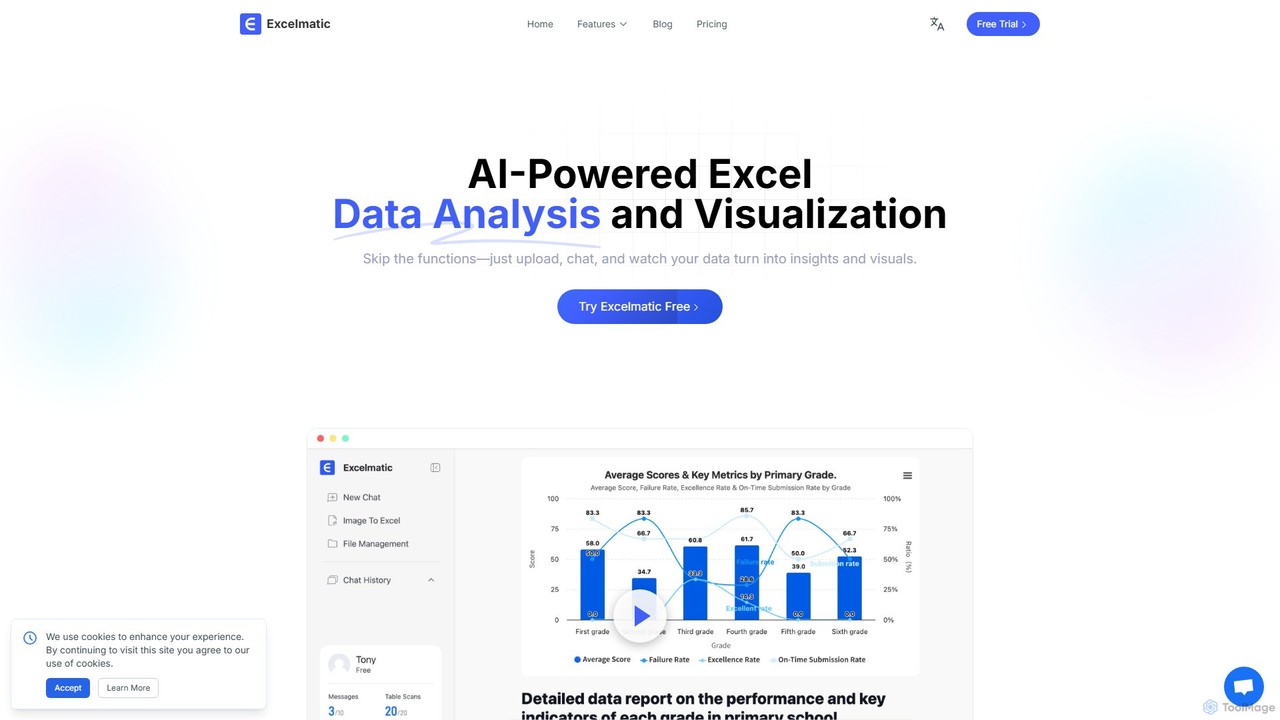
excelmatic
Excelmatic is an AI-powered assistant that transforms your Excel and spreadsheet tasks. Simply upload your data, ask questions …
Excelmatic is an AI-powered assistant that transforms your Excel and spreadsheet tasks. Simply upload your data, ask questions in plain English, and instantly get data analysis, visualizations, and generated formulas. It's a no-code solution designed to automate data cleaning, chart creation, and insight discovery, making data accessible to everyone.
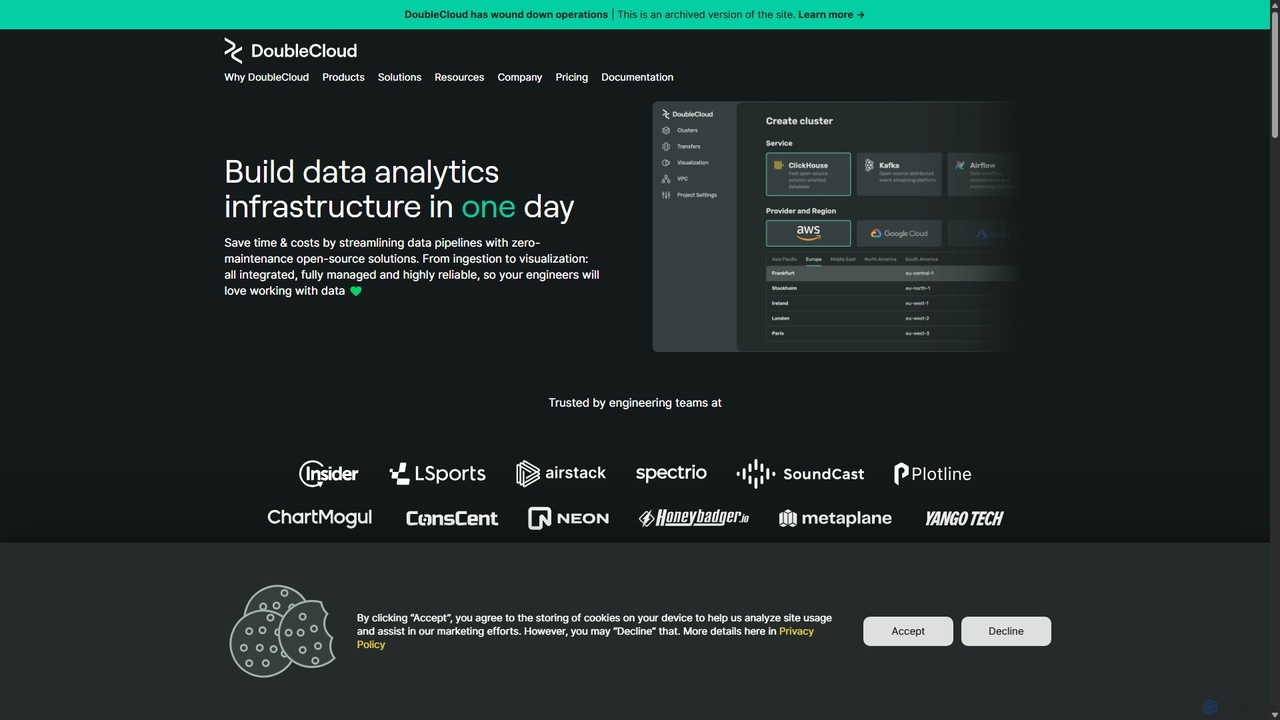
DoubleCloud
DoubleCloud was a fully managed platform for building high-performance data analytics infrastructure. It offered managed open-source services like …
DoubleCloud was a fully managed platform for building high-performance data analytics infrastructure. It offered managed open-source services like ClickHouse, Kafka, and Airflow, along with tools for data integration and real-time visualization. Designed for engineers, it automated maintenance tasks to accelerate product development. Please note: DoubleCloud has ceased operations.
Fabi.ai
Fabi.ai is an AI-powered business intelligence and data analysis platform designed for lean teams. It integrates SQL, Python, …
Fabi.ai is an AI-powered business intelligence and data analysis platform designed for lean teams. It integrates SQL, Python, and AI to help users build dashboards, automate workflows, and explore data 10x faster. The platform offers an all-in-one collaborative environment, reducing context switching and enabling both technical and non-technical users to derive insights from their data sources like data warehouses, Google Sheets, and more.
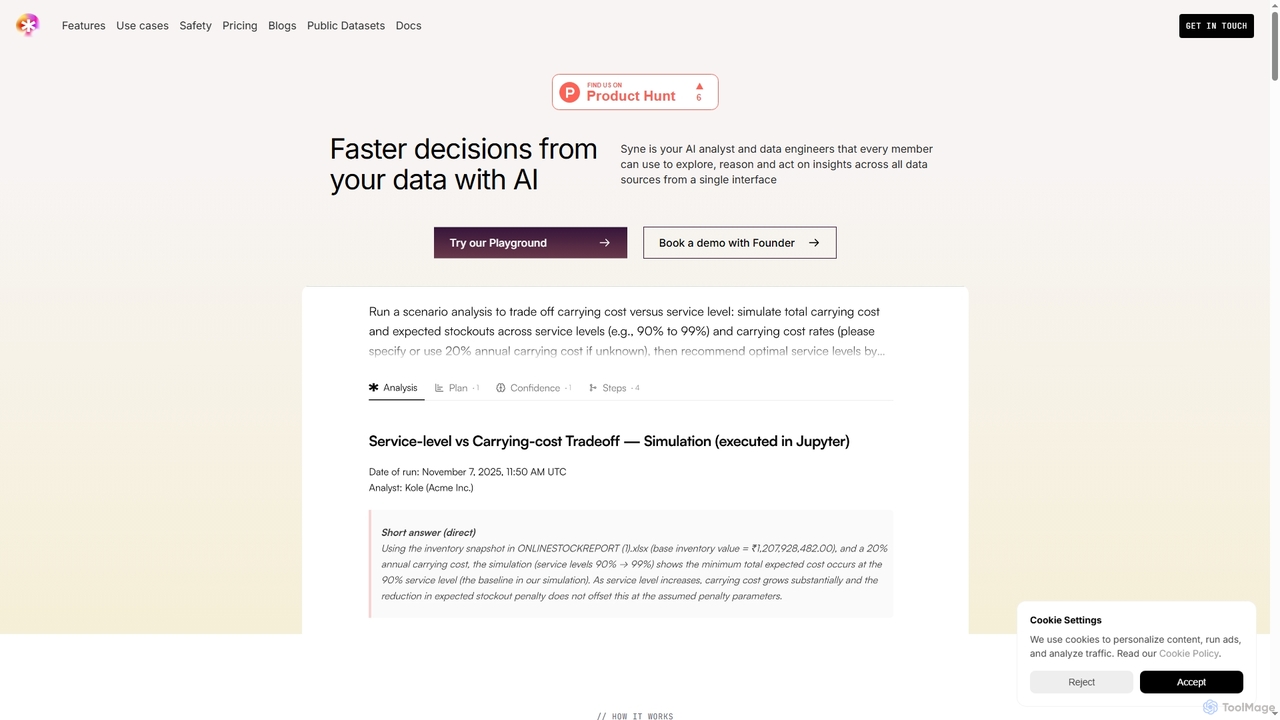
Syne
Syne is an AI-powered data analytics platform that functions as an AI analyst and data engineer. It enables …
Syne is an AI-powered data analytics platform that functions as an AI analyst and data engineer. It enables all team members to explore, analyze, and act on insights from over 100 data sources using natural language queries through a single interface, eliminating the need for complex SQL knowledge for basic inquiries.
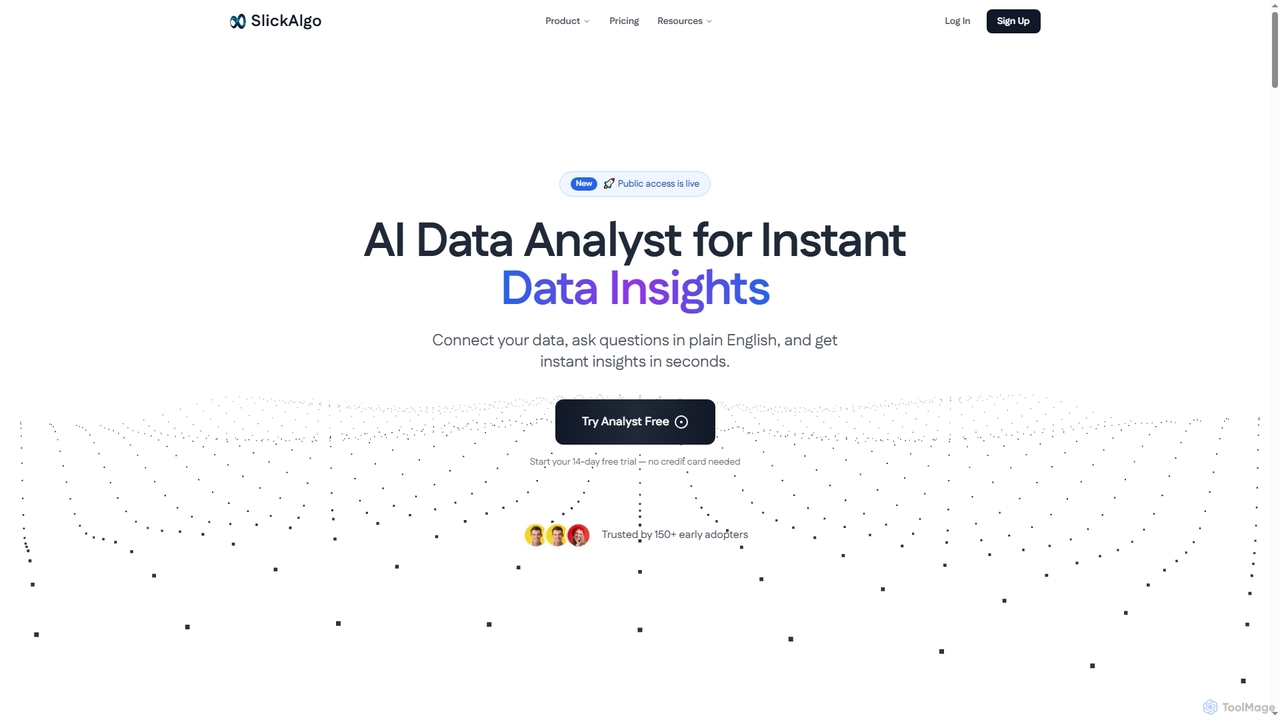
SlickAlgo
SlickAlgo is an AI data analyst platform that transforms natural language questions into instant data insights, Python code, …
SlickAlgo is an AI data analyst platform that transforms natural language questions into instant data insights, Python code, and interactive dashboards. It connects to over 50 data sources, enabling businesses to make data-driven decisions without coding.
Kanaries Category
Kanaries Tag
Kanaries AI Tool Comparison
Kanaries Embed Feature
Just copy the embed code below and paste this beautiful badge on your blog, article, or official app website to drive traffic directly to this tool's detail page and quickly boost your exposure and user count!

No comments yet, be the first to comment!