


pandalyst Overview
Pandalyst is a cutting-edge, AI-driven data analysis and business intelligence platform designed to democratize data insights. It empowers users to converse with their data using simple, natural language queries. By eliminating the need for complex coding skills in languages like Python or SQL for routine analysis, Pandalyst bridges the gap between raw data and actionable intelligence. This makes it an indispensable tool for modern teams who need to make data-driven decisions quickly and efficiently. The platform is built to handle the entire analysis workflow, from data connection and cleaning to visualization and reporting, all within an intuitive, user-friendly interface.
How to use pandalyst
Using Pandalyst is a straightforward, three-step process designed for maximum efficiency:
- Connect Your Data: Start by securely connecting your data sources. Pandalyst supports a wide range of integrations, including uploading files like CSV and Excel, or connecting directly to databases (e.g., PostgreSQL, MySQL) and cloud services (e.g., Google Sheets, AWS S3).
- Ask Questions in Natural Language: Once your data is connected, simply type your questions into the search bar as if you were talking to a human analyst. For example, you could ask, "Show me the monthly revenue trend for the last year," or "Which marketing channel had the highest conversion rate in Q3?"
- Receive Instant Insights and Visualizations: The AI engine instantly processes your request, performs the necessary analysis, and presents the findings in the most appropriate format. This can be a chart, a graph, a table, or a textual summary. You can then ask follow-up questions to drill down further, refine the analysis, or export the results to share with your team.
Core Features of pandalyst
- Natural Language Querying (NLQ): The core of the platform. Translate plain English questions into complex data queries and analyses automatically.
- Automated Data Visualization: Intelligently selects and generates the best visualizations (bar charts, line graphs, heatmaps, etc.) to represent your data and answer your questions.
- AI-Powered Insight Generation: Goes beyond visualization to proactively identify and highlight key trends, anomalies, correlations, and actionable insights within your dataset.
- Data Cleaning and Preparation Assistant: The AI helps identify and suggest fixes for common data quality issues, such as missing values, duplicates, and formatting inconsistencies.
- Code Generation (Python & SQL): For transparency and advanced use cases, Pandalyst can generate the underlying Python (Pandas) or SQL code used for the analysis. This is perfect for data scientists who want to validate results or integrate them into custom workflows.
- Interactive Dashboards: Create and customize dynamic dashboards to monitor key metrics in real-time. Share these dashboards with stakeholders to foster a data-centric culture.
- Broad Data Source Integration: Seamlessly connect to a variety of data sources, from simple spreadsheets to complex cloud databases.
Use Cases for pandalyst
Pandalyst is versatile and can be applied across various departments:
- Marketing Teams: Analyze campaign ROI, track customer acquisition costs, segment audiences, and measure website traffic performance without technical assistance.
- Sales Departments: Monitor sales pipelines, forecast revenue, identify top-performing products or regions, and track team performance against quotas.
- Business Operations: Optimize supply chains, analyze operational efficiency, identify bottlenecks, and monitor key performance indicators (KPIs).
- Financial Analysts: Speed up financial reporting, analyze profit and loss statements, and conduct variance analysis with simple language queries.
- Product Managers: Understand user behavior, track feature adoption rates, and analyze user feedback to inform product roadmap decisions.
Advantages of pandalyst
Pandalyst offers a significant competitive edge:
- Democratization of Data: Empowers non-technical team members to self-serve their data needs, freeing up data analysts for more strategic work.
- Speed and Efficiency: Reduces the time from question to insight from hours or days to mere seconds.
- No-Code Platform: Eliminates the steep learning curve associated with data analysis tools and programming languages.
- Trust and Transparency: The optional code generation feature allows technical users to audit and trust the AI's output.
- Cost-Effective: Reduces the need for a large, dedicated data science team for routine analytical tasks, lowering operational costs.
Pricing and Plans
Pandalyst offers a flexible pricing structure to suit different needs (inferred model):
- Free Plan: Ideal for individuals or small projects, offering basic features, a limited number of queries per month, and support for 1-2 data sources.
- Pro Plan: Designed for professionals and small teams, this plan includes unlimited queries, more data source integrations, advanced features like dashboard sharing, and priority support. Typically priced on a per-user, per-month basis.
- Enterprise Plan: A custom solution for large organizations, offering advanced security features (like SSO), API access, dedicated support, and potential on-premise deployment options. Pricing is available upon request.
pandalyst Alternatives
Stadai
Stadai is an advanced AI-powered platform for data analysis, business intelligence, and predictive modeling. It empowers users to transform complex data into actionable insights, automate reporting, and forecast trends through an intuitive, no-code interface.
Business Intelligence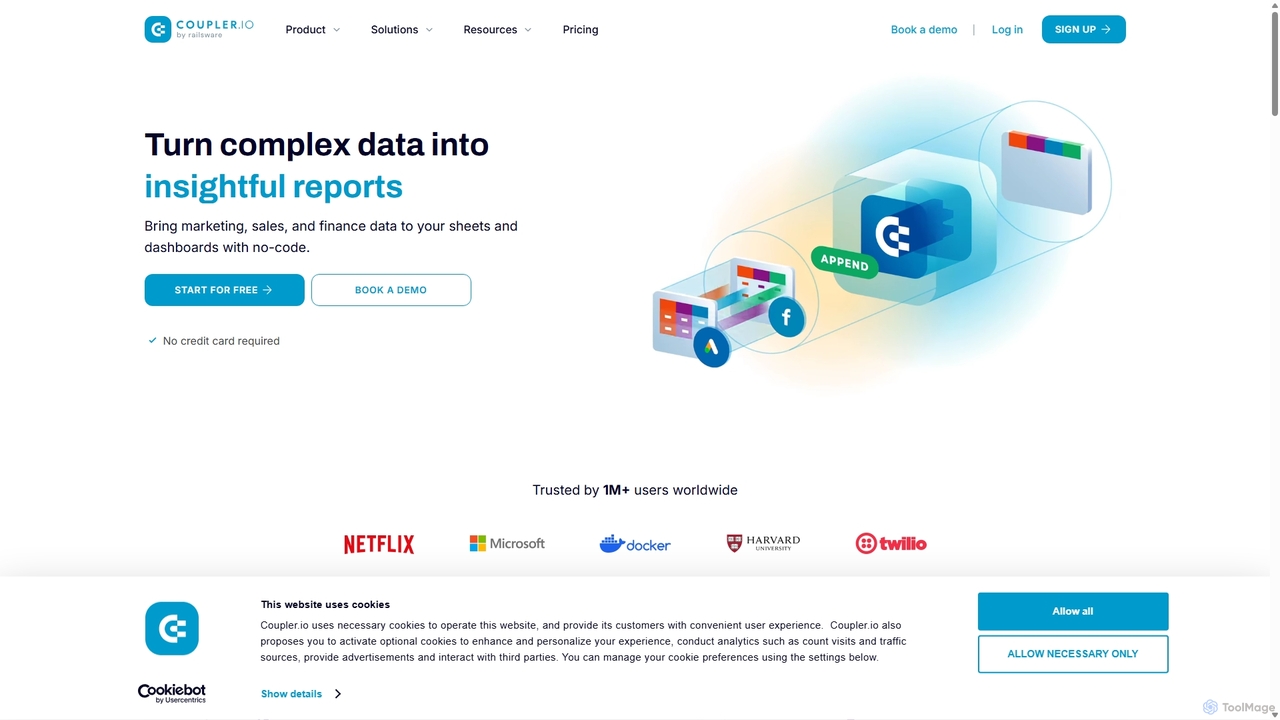
Coupler.io
Coupler.io is a no-code data analytics and automation platform that helps businesses connect disparate data sources from marketing, sales, and finance apps to spreadsheets, data warehouses, or BI tools. It automates data collection, transforms raw data into analysis-ready formats, and provides AI-powered insights and pre-built dashboard templates for faster, smarter decision-making.
Business Intelligence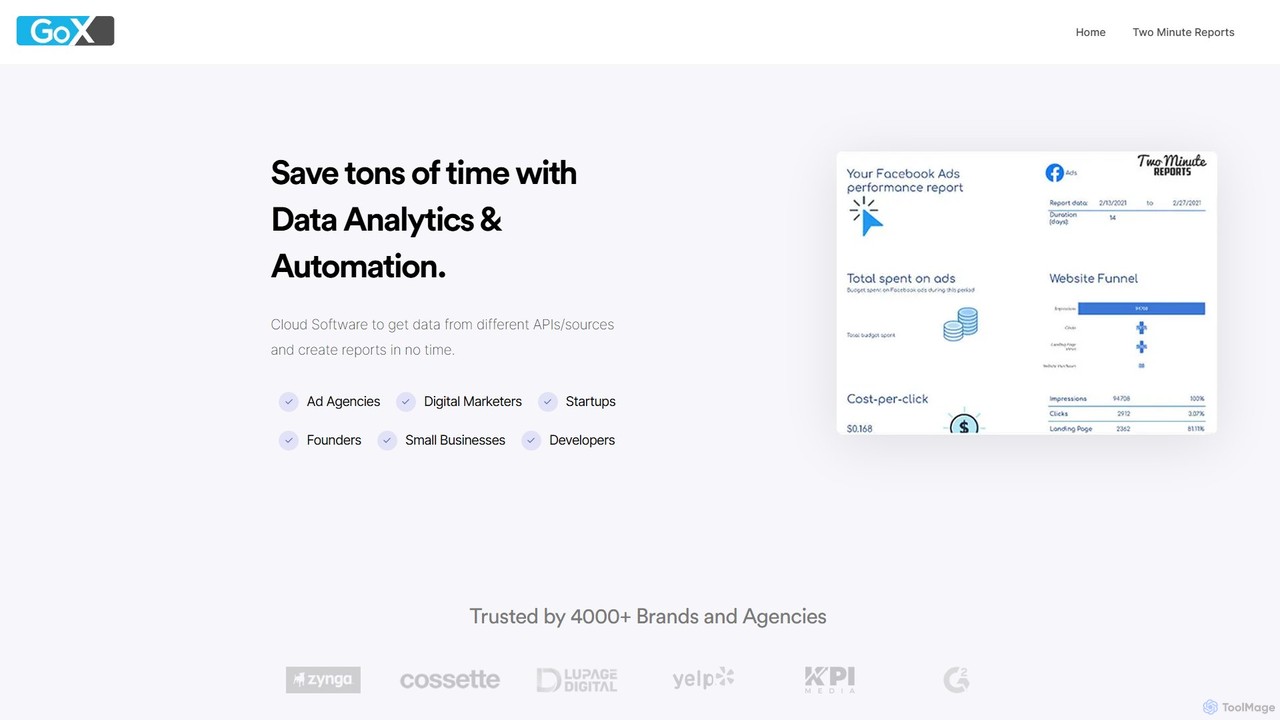
GoX
GoX is a data automation and analytics platform, delivered through its flagship product 'Two Minute Reports'. It helps marketers and agencies save time by connecting to various data sources (like Google Ads, Facebook Ads, SEO tools), consolidating data, and automating report generation directly within Google Sheets and Looker Studio. It's a no-code solution for creating beautiful, insightful reports in minutes.
Business Intelligence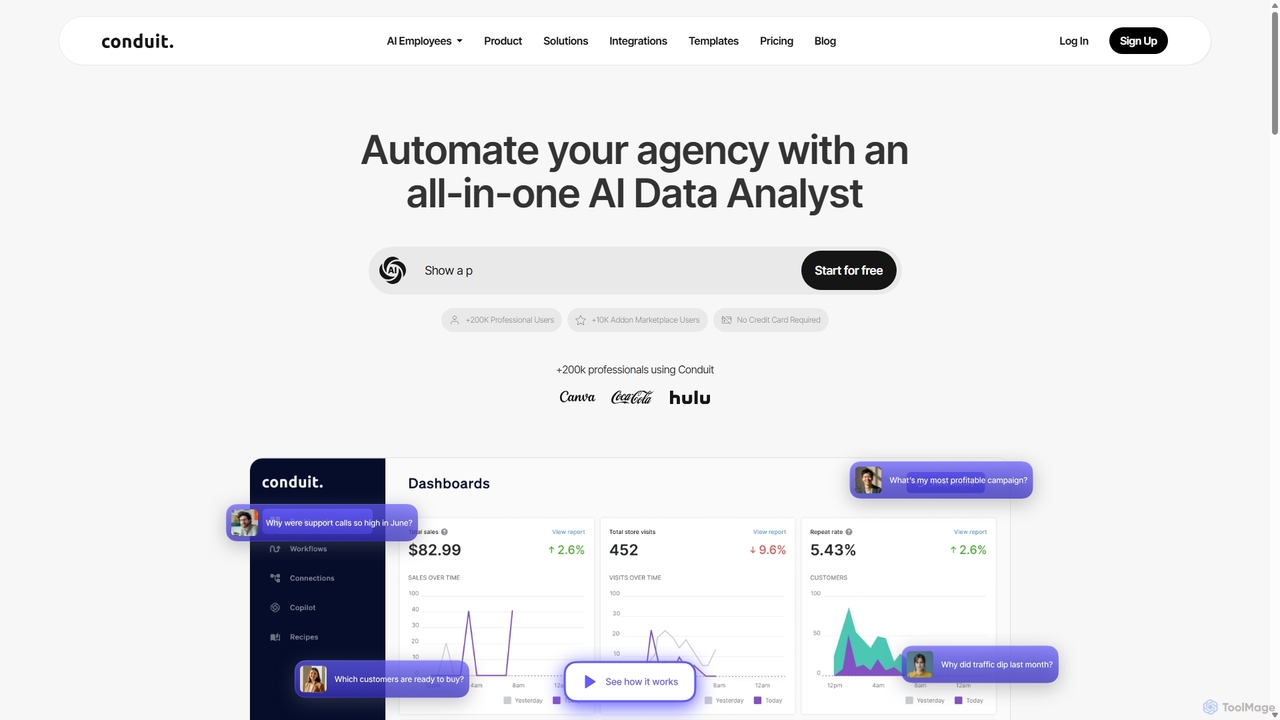
Conduit
Conduit is an all-in-one AI data analyst platform designed to automate agencies and businesses. It centralizes data from hundreds of sources like CRMs, ad platforms, and databases, enabling users to build automated workflows, create interactive dashboards, and query their data using a natural language AI copilot. It's built for marketing teams, data analysts, and developers to save time, improve accuracy, and make faster, data-driven decisions.
Business Intelligence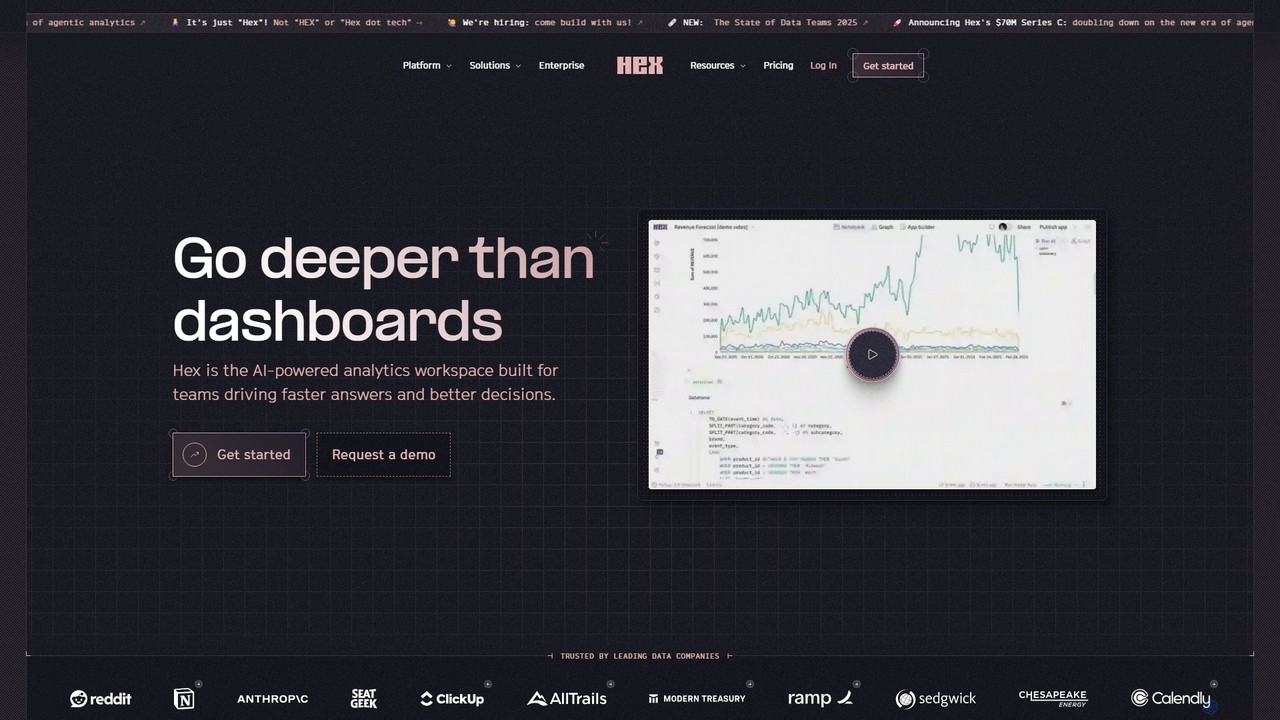
Hex
Hex is an AI-powered analytics workspace designed for teams. It integrates notebooks for Python and SQL, interactive data apps, and self-serve exploration into a single collaborative platform, enabling faster, data-driven decision-making.
Data Sciencepandalyst Categories
pandalyst Embed Widget
Copy this embed code to place the badge on your blog, article, or product site and send readers directly to this ToolMage detail page.

Related AI tools
Hex
Hex is an AI-powered analytics workspace designed for teams. It integrates notebooks for Python and SQL, interactive data apps, and self-serve exploration into a single collaborative platform, enabling faster, data-driven decision-making.
Data Science
Fabi.ai
Fabi.ai is an AI-powered business intelligence and data analysis platform designed for lean teams. It integrates SQL, Python, and AI to help users build dashboards, automate workflows, and explore data 10x faster. The platform offers an all-in-one collaborative environment, reducing context switching and enabling both technical and non-technical users to derive insights from their data sources like data warehouses, Google Sheets, and more.
Business Intelligence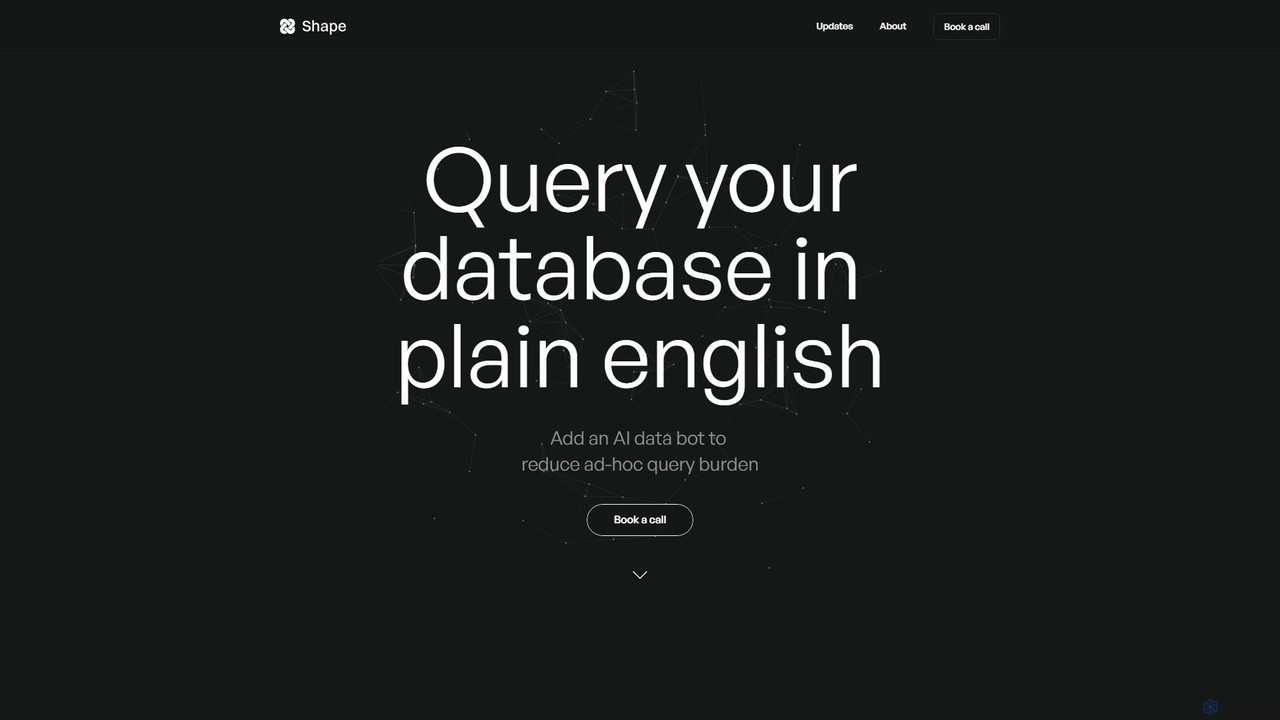
Shape
Shape is an AI-powered data analyst that allows teams to query their databases using plain English. It connects to your existing data stack and enables non-technical users to get instant answers to complex data questions through integrations like Slack and Microsoft Teams. By translating natural language into advanced SQL, Shape provides nuanced answers, automated visualizations, and frees up data analysts from ad-hoc query burdens, making data accessible to everyone in the organization.
Api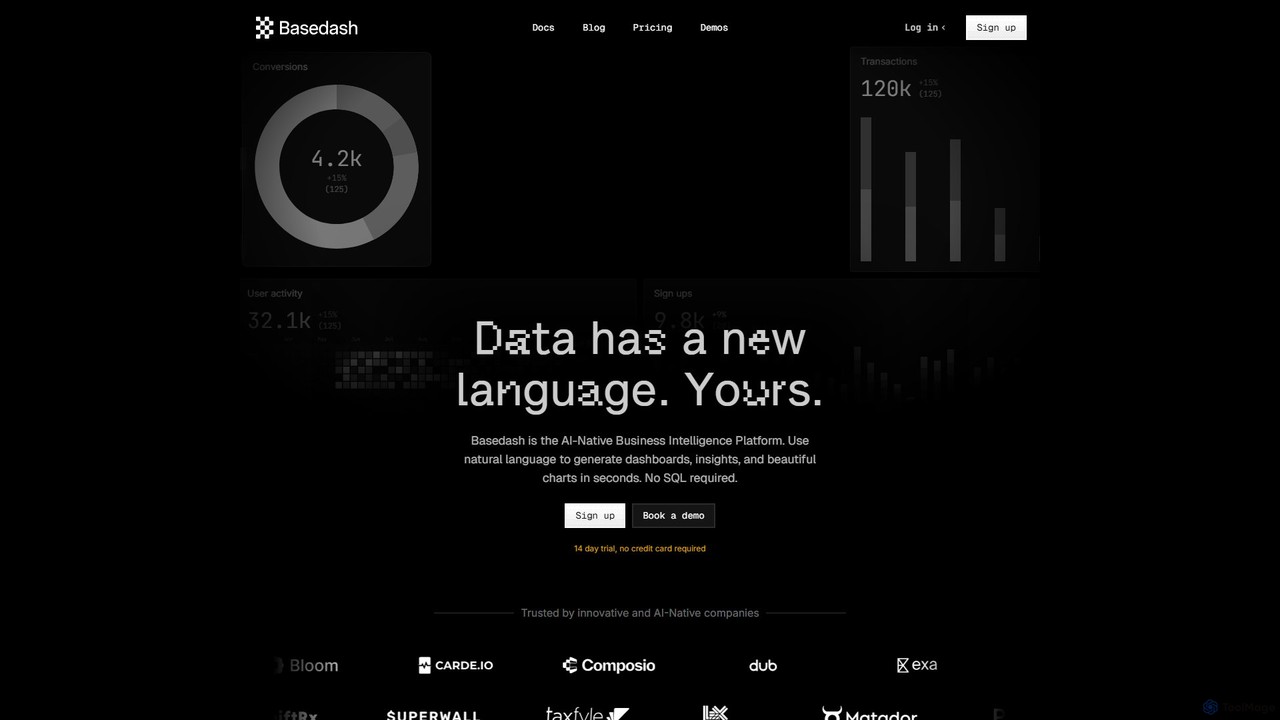
Basedash
Basedash is an AI-native business intelligence platform that allows teams to interact with their data using natural language. Generate beautiful dashboards, charts, and insights in seconds without writing any SQL code. Connect your data sources and simply ask questions to get answers.
Business Intelligence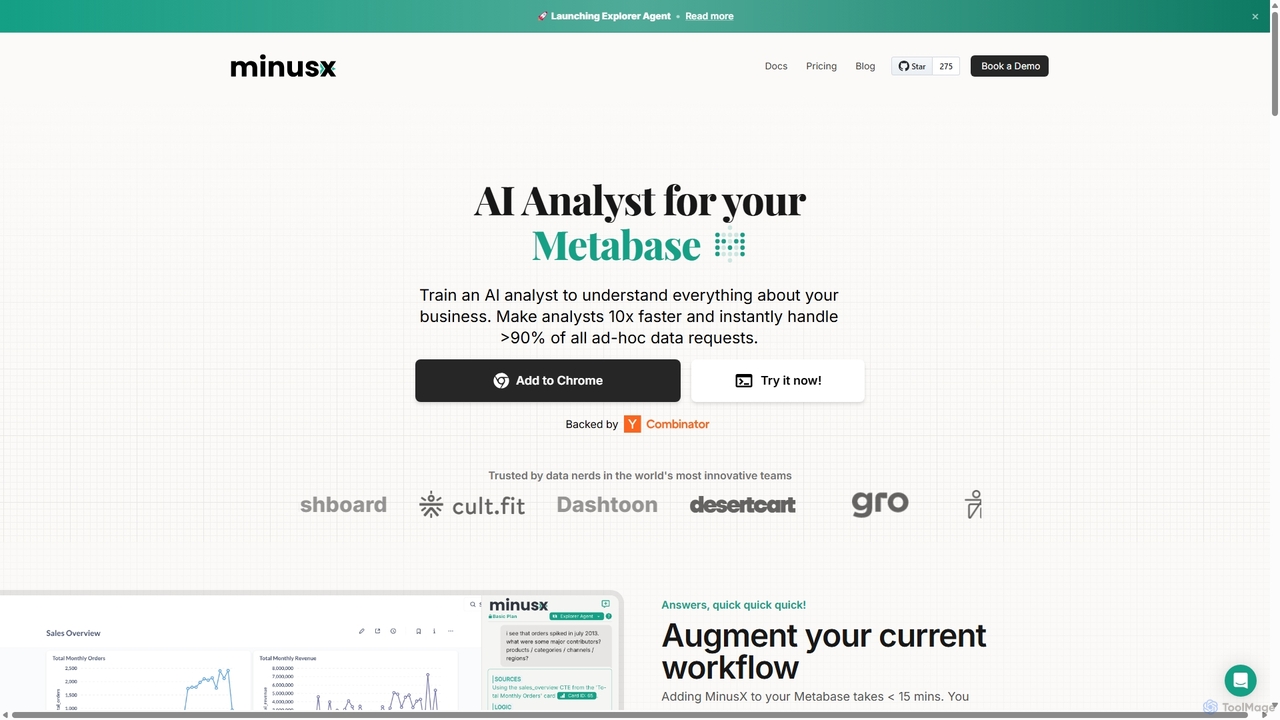
Minusx
Minusx is an AI data analyst designed to integrate seamlessly with Metabase. It empowers data analysts, business users, and executives to query data using natural language, handling over 90% of ad-hoc requests instantly. By acting as a Chrome extension within your existing workflow, Minusx enhances productivity, codifies business knowledge through 'Context Engineering', and provides quick, accurate insights directly from your dashboards and reports, all while ensuring data security.
Analytics
Jyek
Jyek is an AI agent platform that understands objectives, creates execution plans, uses tools, and delivers verifiable results for complex, multi-step tasks.
Automation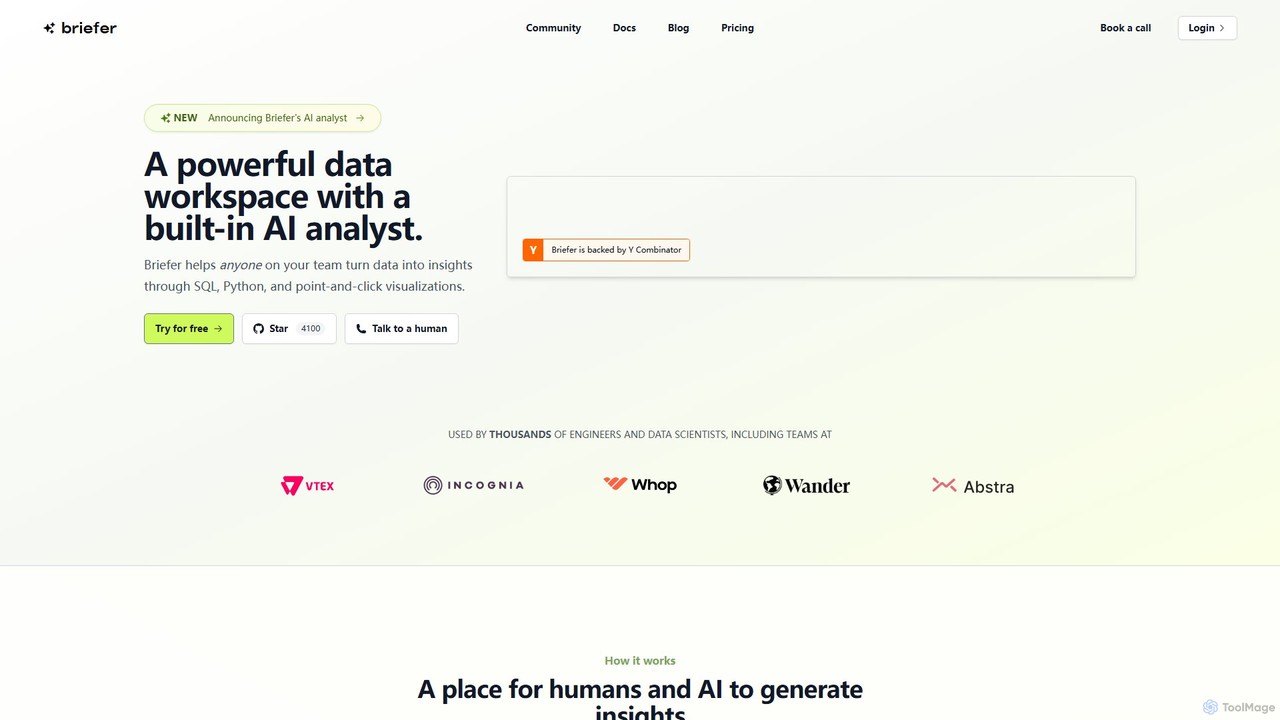
Briefer
Briefer is a collaborative data platform featuring a built-in AI analyst. It empowers teams to transform data into actionable insights using SQL, Python, and interactive visualizations within a unified workspace. Designed for both technical and non-technical users, it streamlines data analysis, reporting, and real-time collaboration, accelerating data-driven decision-making. It is backed by Y Combinator and offers both cloud-hosted and self-hosted open-source versions.
Database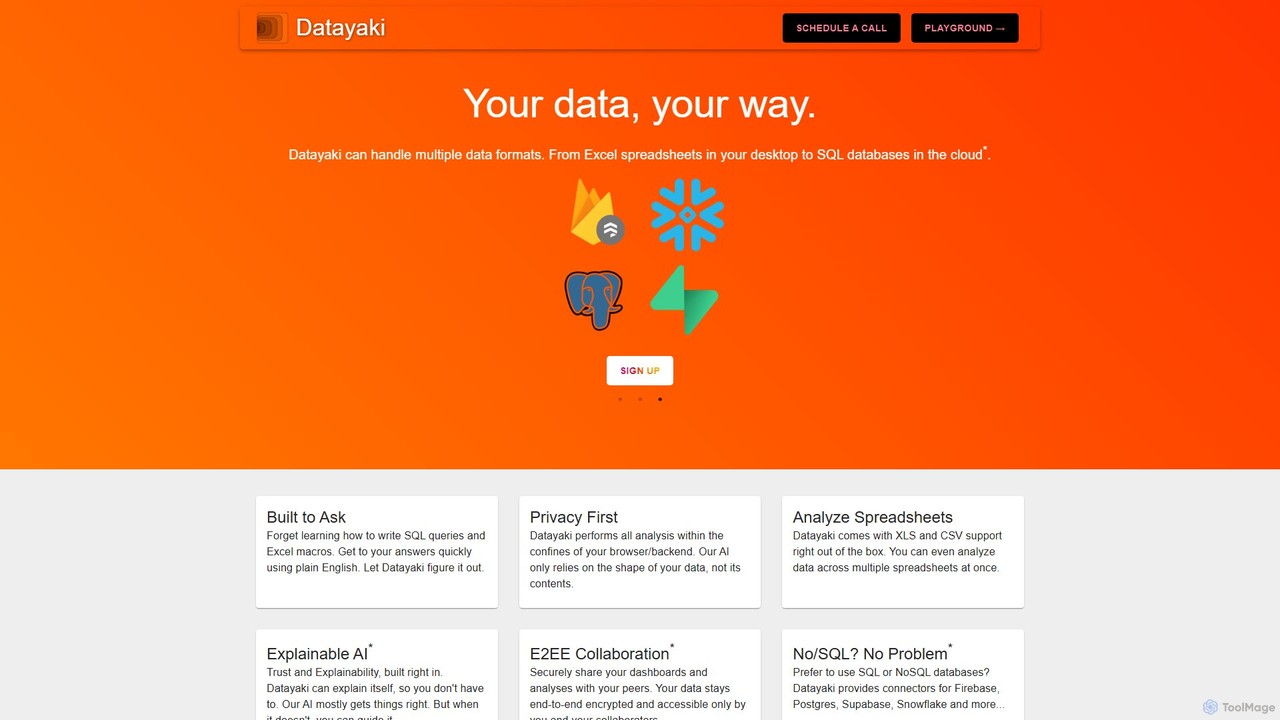
Datayaki
Datayaki is an AI-powered data analyst that lets you find insights from your data by asking questions in plain English. It supports formats like Excel and CSV, eliminating the need for SQL or complex formulas. With a strong focus on privacy, all analysis is performed locally in your browser, ensuring your data remains secure and confidential. It's designed for professionals and teams who need fast, accessible, and secure data analysis.
Data Visualization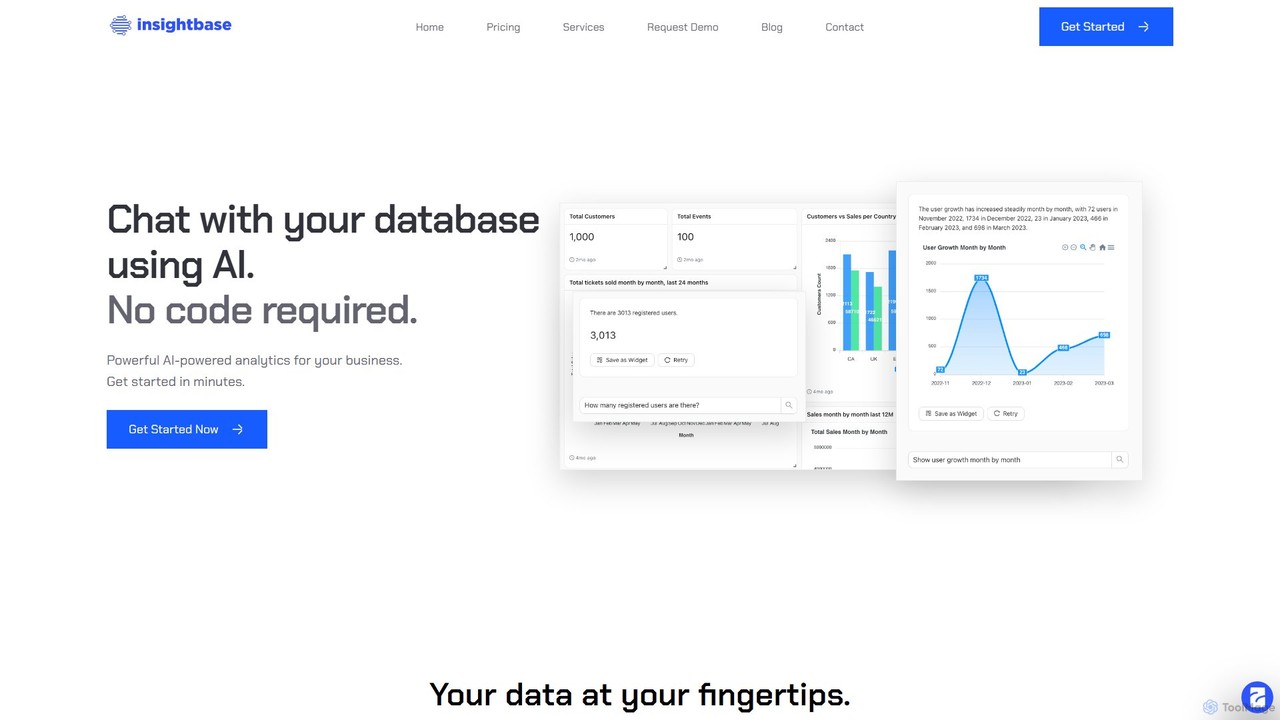
InsightBase
InsightBase is an AI-powered business intelligence platform that allows you to chat with your database using natural language. It empowers both non-technical and technical users to build dashboards, generate reports, and gain data-driven insights in minutes, without needing to write complex SQL queries.
Business Intelligence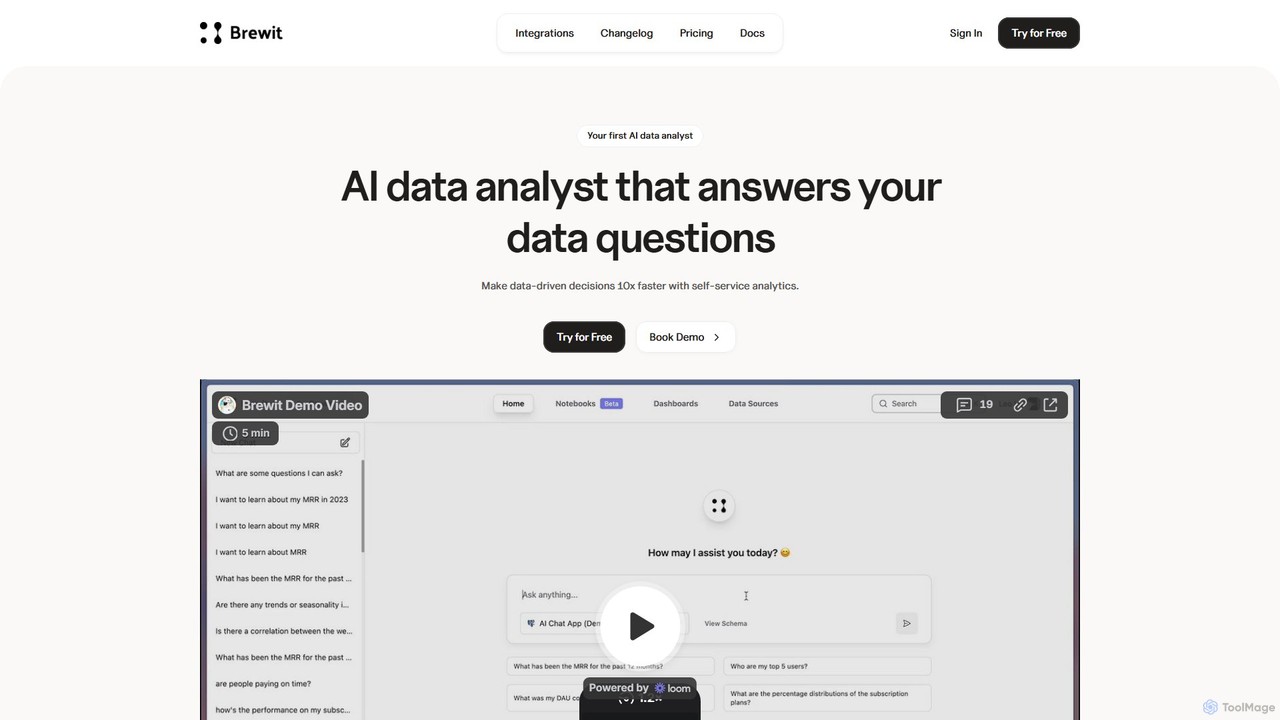
Brewit
Brewit is an AI-powered analytics platform that enables users to perform self-service data analysis. Connect to your databases, chat in natural language to query data, generate SQL, and create interactive visualizations and reports. It simplifies business intelligence, making data accessible to everyone in the organization, regardless of their technical skills.
Database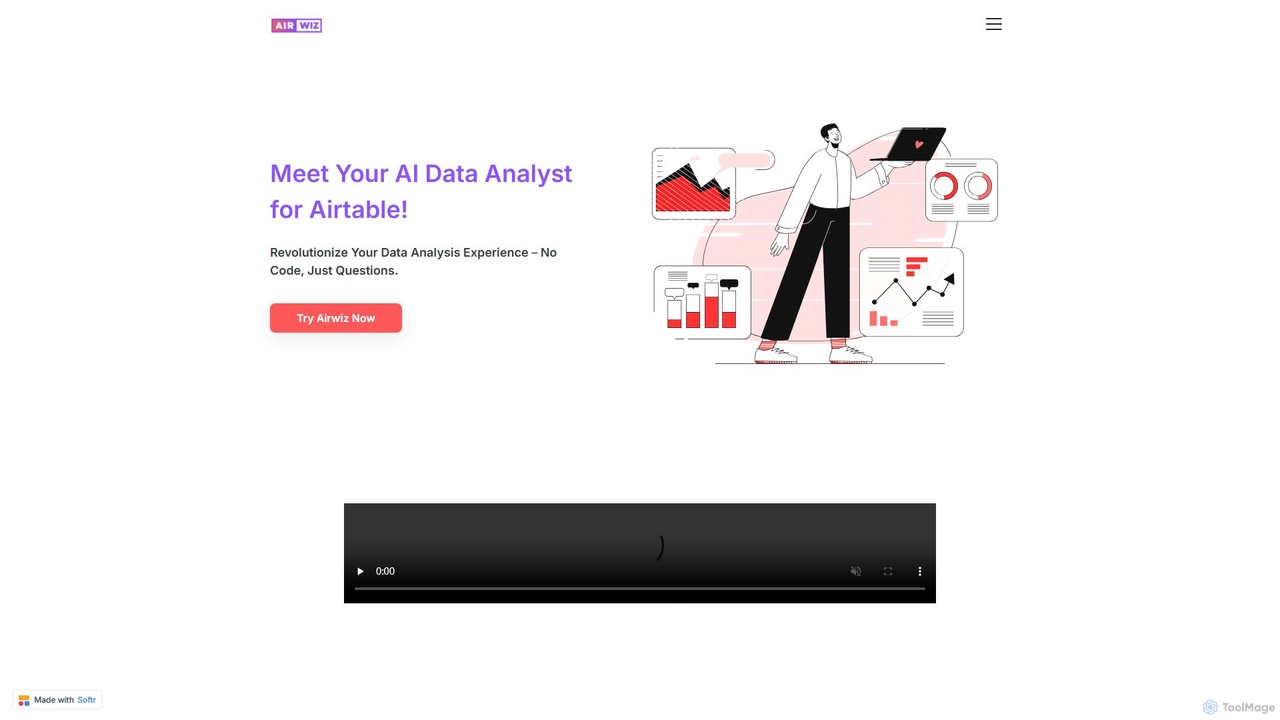
airwiz
Airwiz is an AI-powered data analyst designed specifically for Airtable. It allows users to ask complex questions about their data in plain English and receive instant, actionable insights. With seamless integration and no coding required, Airwiz democratizes data analysis, enabling teams in product, finance, and operations to make faster, data-driven decisions directly from their Airtable bases.
No CodeStadai
Stadai is an advanced AI-powered platform for data analysis, business intelligence, and predictive modeling. It empowers users to transform complex data into actionable insights, automate reporting, and forecast trends through an intuitive, no-code interface.
Business Intelligence
Ajelix
Ajelix is an AI-powered suite of tools designed to enhance productivity for Excel and Google Sheets users. It acts as an AI data analyst, automating tasks, generating formulas and VBA scripts, creating insightful reports, and providing advanced data analysis through a simple chat interface.
Business Intelligence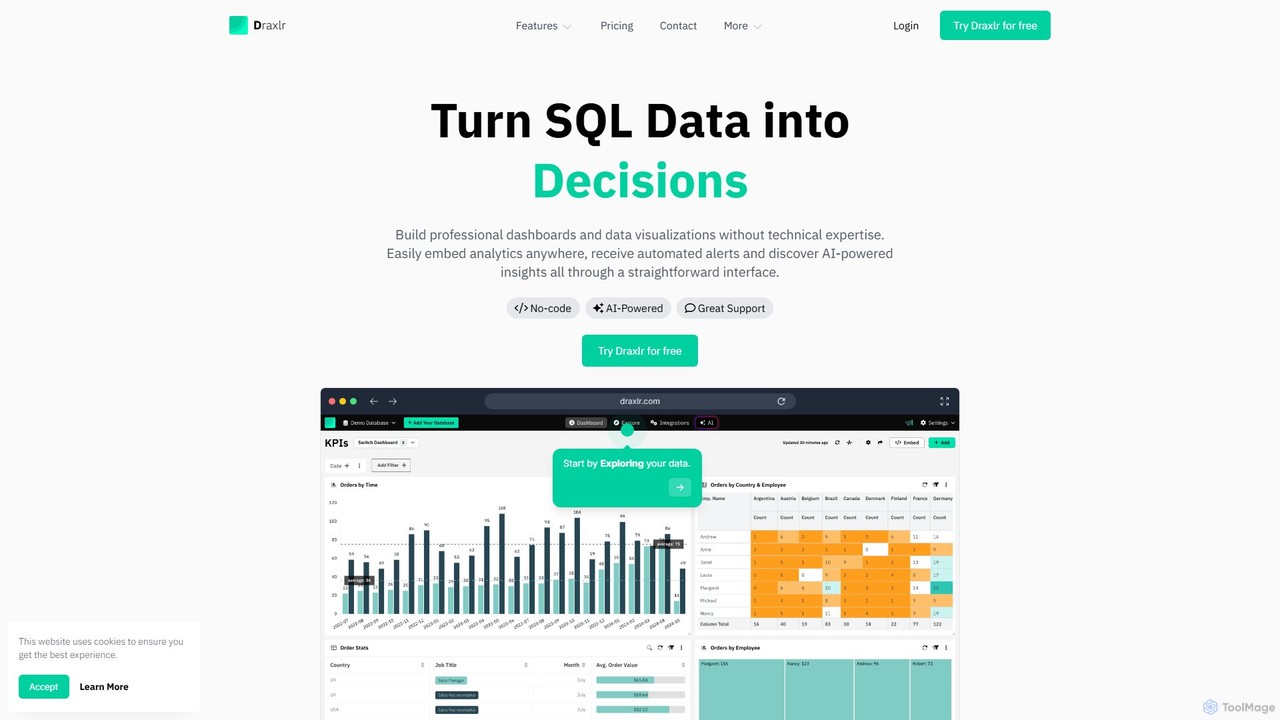
draxlr
Draxlr is an AI-powered business intelligence platform that enables users to build professional dashboards and data visualizations from SQL databases without technical expertise. It offers a no-code query builder, embeddable analytics, and automated alerts to transform raw data into actionable decisions.
Business Intelligence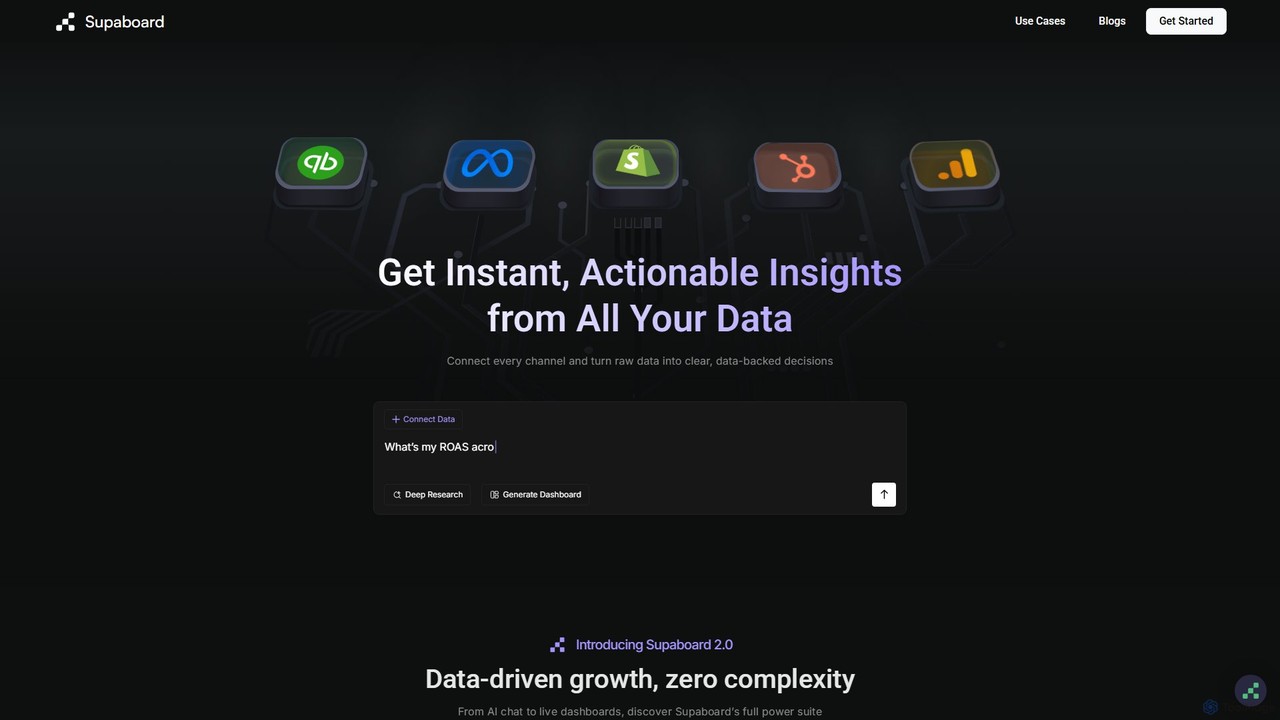
Supaboard
Supaboard is an AI-powered business intelligence platform that connects all your data sources into a unified hub. It transforms raw data into actionable insights and live dashboards, allowing teams to make data-backed decisions quickly without needing to write code or wrangle spreadsheets.
Business Intelligence
pandalyst Comments (0)
Sign in to comment.
Sign inNo comments yet.