
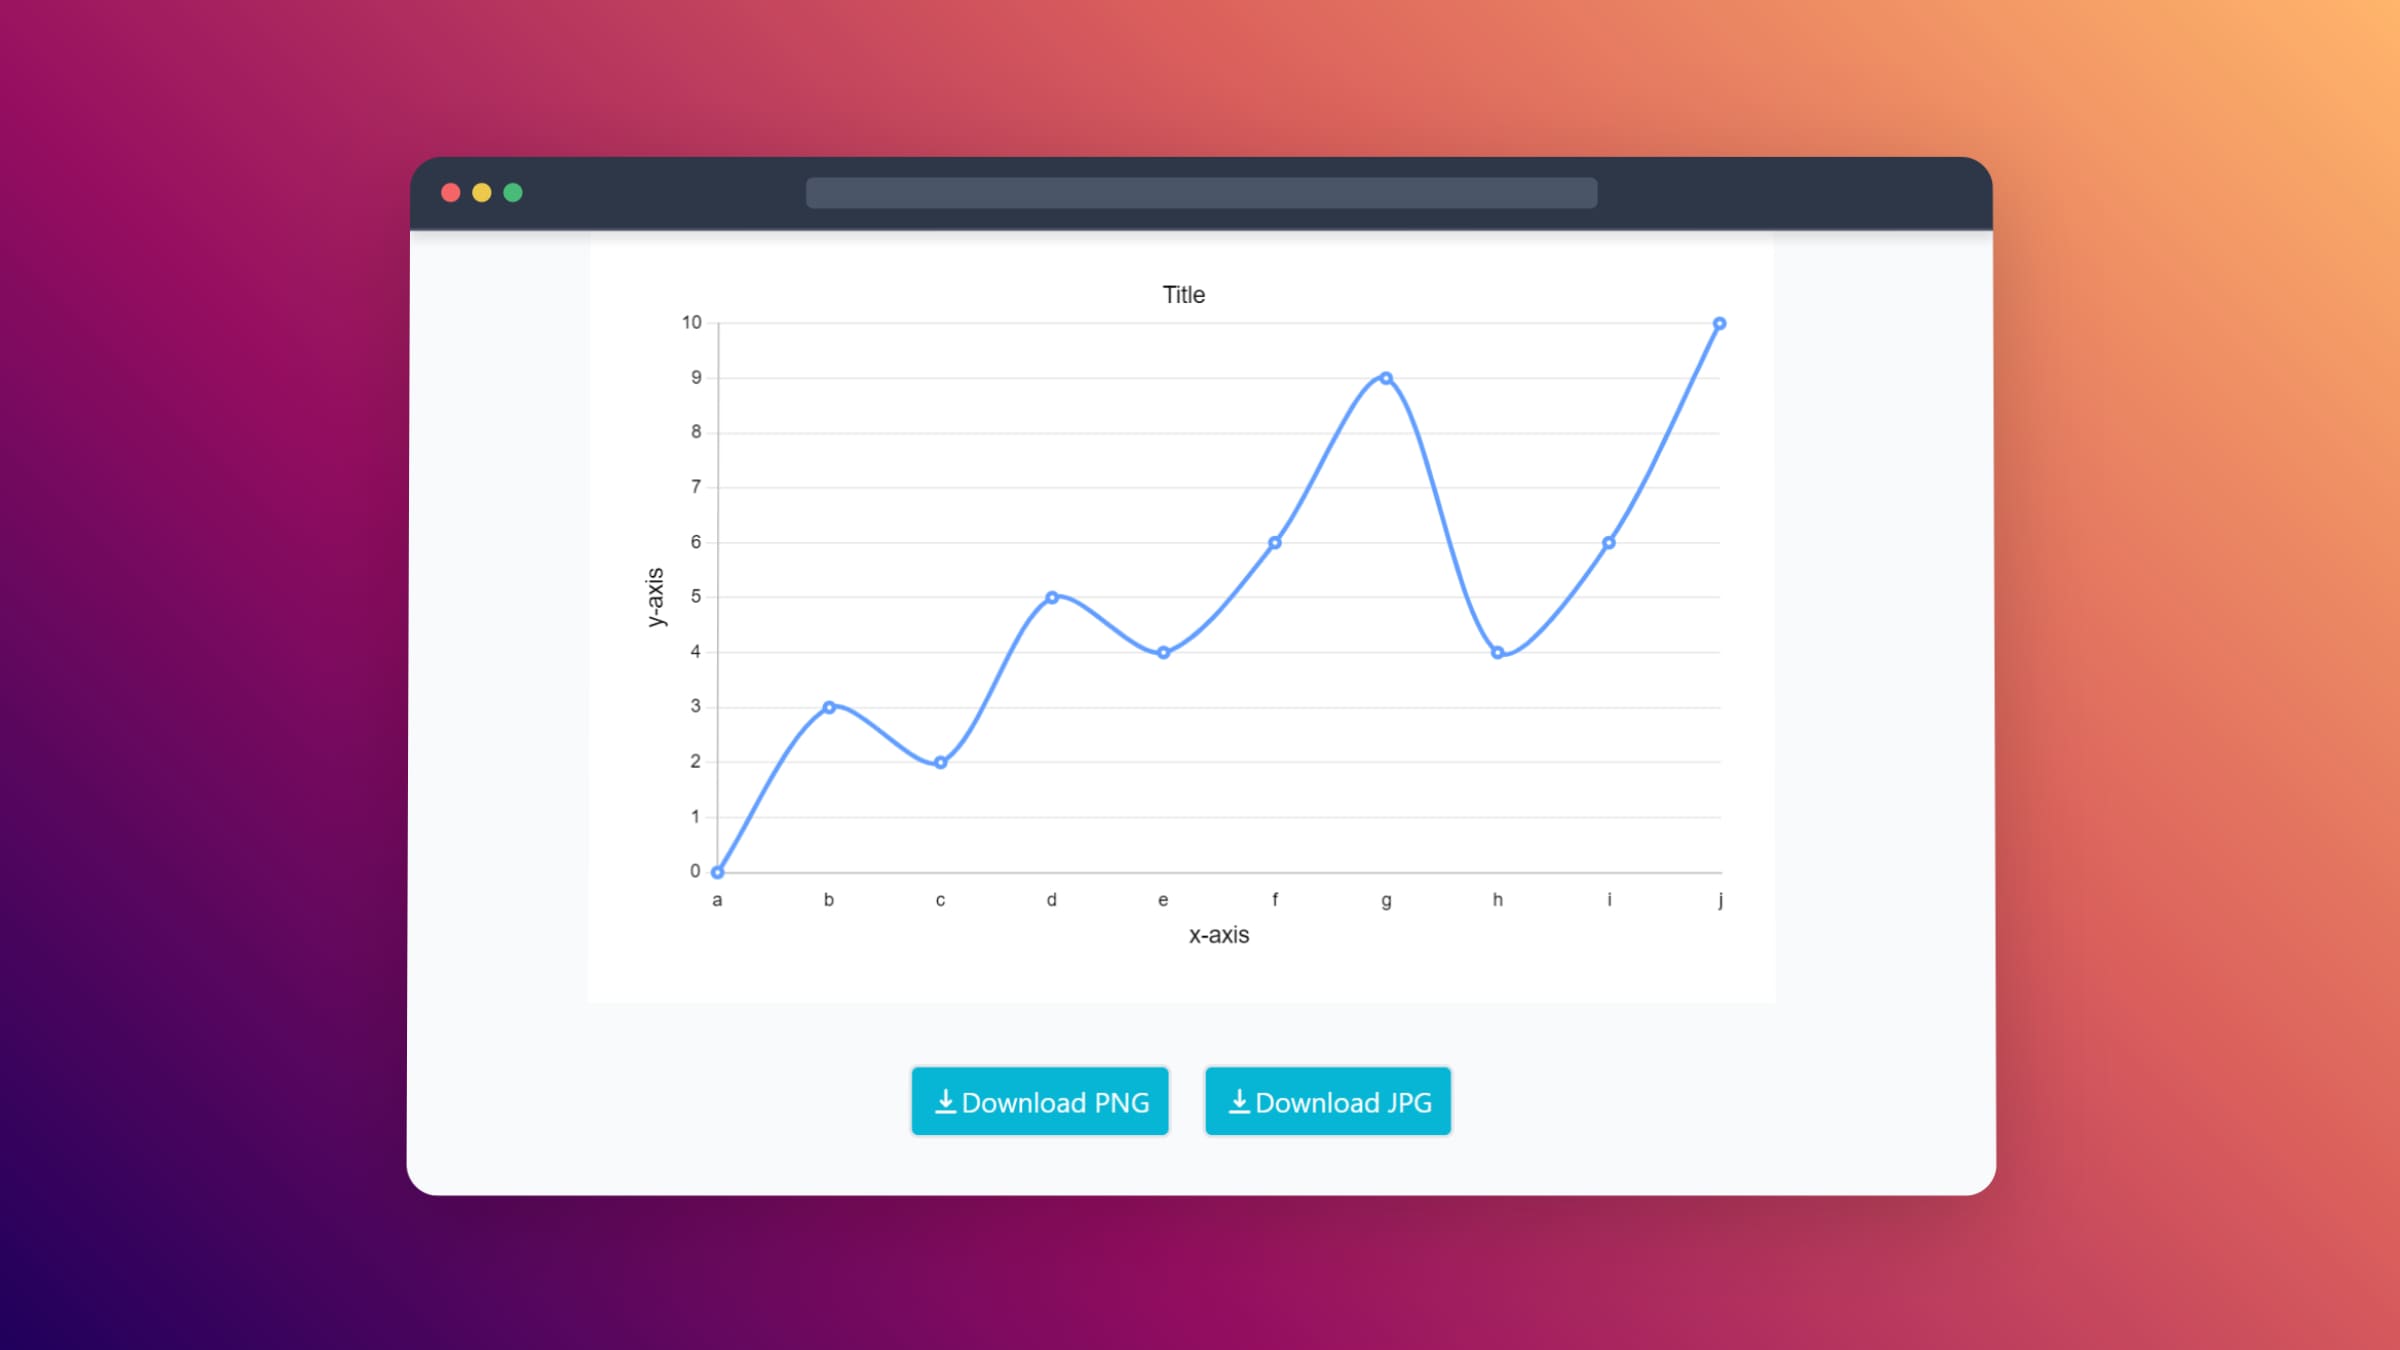
Line Graph Maker Overview
Line Graph Maker is a straightforward and highly accessible online tool designed for anyone needing to create high-quality line and bar charts without the complexity of advanced software. Developed as a passion project by a team of junior developers, this tool prioritizes simplicity, speed, and user-friendliness. It allows users to transform raw data into clear, professional-looking visualizations in just a few steps. Whether you're a student preparing a report, a business professional tracking metrics, or a blogger illustrating a point, Line Graph Maker provides a free and efficient solution for your data visualization needs.
The platform's interface is clean and intuitive, guiding the user through the chart creation process seamlessly. It also offers a surprising amount of customization for a free tool, ensuring that the final output can be tailored to specific requirements. In addition to line graphs, the tool also supports the creation of bar graphs, making it a versatile choice for comparing data sets or showing trends over time.
How to use Line Graph Maker
Creating a chart with Line Graph Maker is a simple, step-by-step process that requires no prior experience:
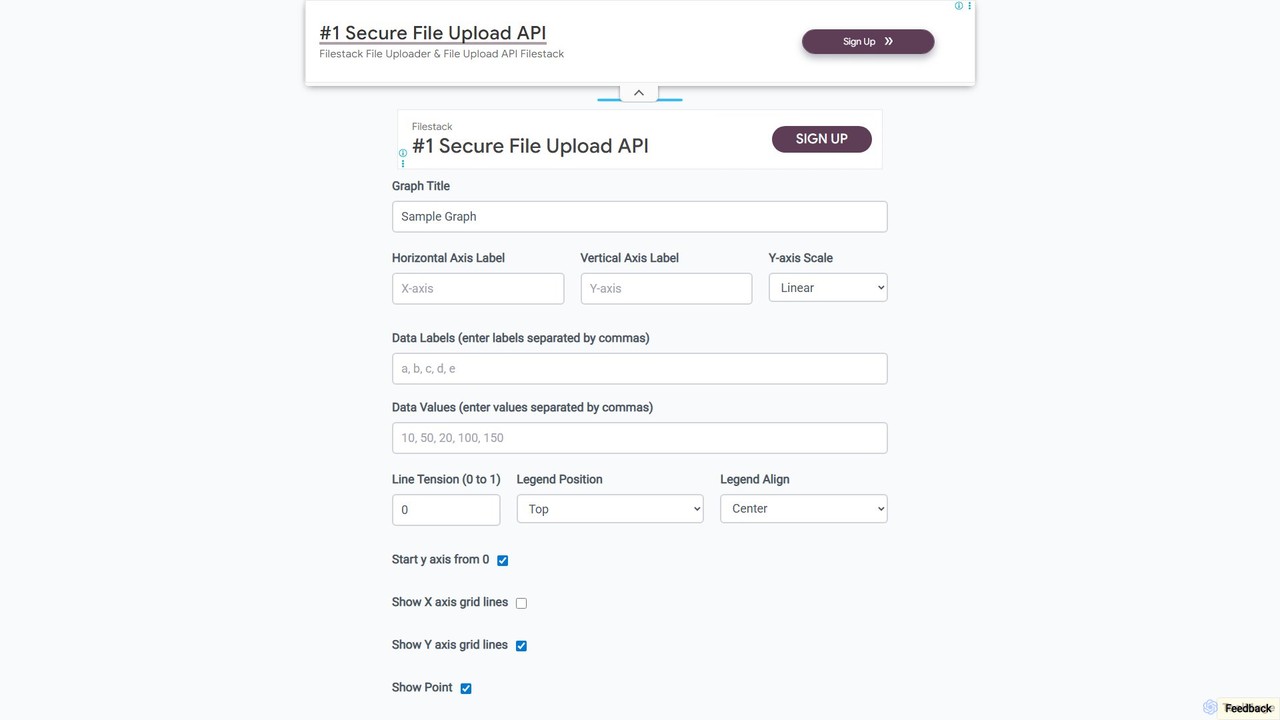
- Add Titles and Labels: Start by giving your graph a main title. Then, add labels for the horizontal (X-axis) and vertical (Y-axis) to provide context for your data.
- Enter Your Data: In the 'Data Labels' field, enter the labels for your X-axis points, separated by commas (e.g., January, February, March). In the 'Data Values' field, enter the corresponding numerical values, also separated by commas (e.g., 10, 25, 18). Ensure the number of labels matches the number of values.
- Customize the Appearance: Tailor the visual elements of your graph. You can adjust the 'Line Tension' (from 0 for straight lines to 1 for highly curved lines), select the line color, and choose the position of the legend (Top, Left, Bottom, Right).
- Adjust Axes and Grids: Choose between a Linear or Logarithmic scale for the Y-axis. You have the option to force the Y-axis to start from 0, which is crucial for accurate representation. You can also toggle the visibility of X and Y-axis grid lines to improve readability.
- Download Your Graph: Once you are satisfied with your chart, you can instantly download it in one of three high-quality formats: PNG, JPG, or SVG (a vector format ideal for scaling without loss of quality).
Core Features of Line Graph Maker
- Dual Chart Types: Create both line graphs to show trends over time and bar graphs to compare quantities.
- Intuitive Data Entry: Simply paste or type comma-separated values for labels and data points.
- Rich Customization: Control graph titles, axis labels, line colors, and line tension for curved or straight lines.
- Legend and Alignment Control: Position the legend and align its text (start, center, end) for optimal layout.
- Axis Scaling Options: Choose between linear and logarithmic scales for the Y-axis and set the axis to start from zero.
- Grid Line Control: Show or hide horizontal and vertical grid lines to suit your visual preference.
- Multiple Download Formats: Export your finished charts as high-resolution PNG, JPG, or scalable SVG files.
- Completely Free: No fees, subscriptions, or sign-ups required to use all features.
Use Cases for Line Graph Maker
Line Graph Maker is a versatile tool suitable for a wide range of applications:
- Education: Students can use it to create charts for science projects, math homework, history reports, and presentations, visualizing data in a clear and academic manner.
- Business and Finance: Professionals can quickly track and present key metrics like monthly sales, website traffic over time, stock price fluctuations, or economic indicators for reports and meetings.
- Content Creation and Journalism: Bloggers, writers, and journalists can generate simple, clean charts to embed in articles, helping to illustrate data-driven stories and make complex information more digestible for readers.
- Personal Projects: Anyone can use it to track personal goals, such as workout progress, budget tracking, or any other data that changes over time.
Advantages of Line Graph Maker
The primary advantage of this tool is its simplicity and accessibility. Unlike complex spreadsheet software, it has a zero-learning curve. It's entirely web-based, requiring no downloads or installation. Being completely free makes it an excellent resource for students, non-profits, and individuals on a budget. The ability to download in SVG format is a significant benefit, as it allows for infinite scaling, making the charts suitable for both web use and high-quality print publications.
Pricing and Plans
Line Graph Maker is completely free to use. There are no hidden costs, premium features, or subscription plans. All functionalities are available to all users without any limitations.
Traffic
Latest traffic
Status
Monthly traffic trend
- 2025-9: 34.3K
- 2026-1: 54.0K
- 2026-2: 41.3K
- 2026-3: 36.6K
- 2026-4: 48.1K
- 2026-5: 54.4K
Geography
Top 5 countries / regions
- 🇺🇸United States42.6%
- 🇯🇴Jordan22.5%
- 🇦🇺Australia13.9%
- 🇮🇳India11.3%
- 🇬🇧United Kingdom9.7%
Traffic sources
| Source type | Percentage |
|---|---|
Direct | 86.0% |
Referral | 11.2% |
Email | 2.8% |
Top keywords
| Keyword | Cost per click |
|---|---|
| bar graph maker | $1.08 |
| line chart maker | $1.14 |
| line graph | $2.34 |
| line graph maker | $0.84 |
| simple line chart generator | $0.00 |
Line Graph Maker Alternatives
Pie Chart Maker
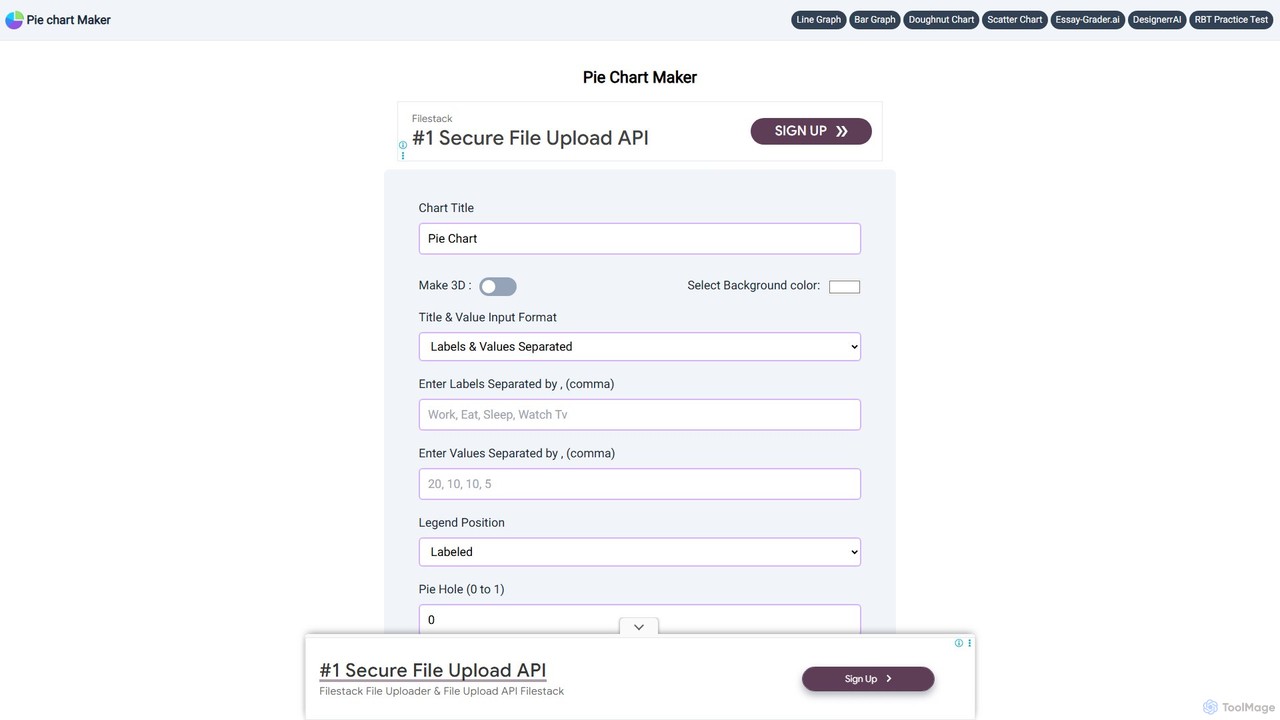
A free, user-friendly online tool for creating beautiful and customizable pie charts, doughnut charts, and line graphs in just a few clicks. Instantly visualize your data by simply entering labels and values, and download your charts in various formats like PNG, JPEG, and SVG.
Student Tools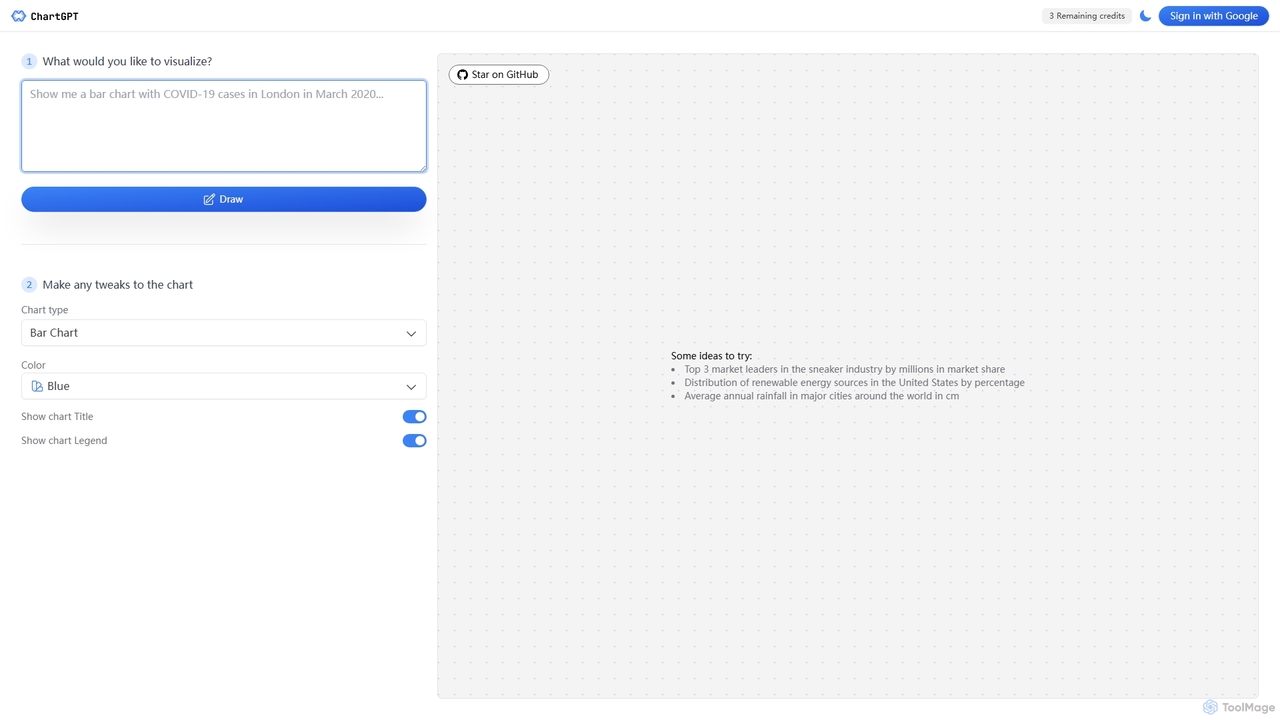
ChartGPT
ChartGPT is an AI-powered tool that transforms natural language text prompts into a wide variety of stunning charts and graphs. Simply describe the data you want to visualize, and ChartGPT instantly generates customizable charts, making data visualization accessible to everyone, regardless of technical skill.
Business Intelligence
ChartGPT
ChartGPT is an AI-powered tool that transforms natural language prompts and raw data into stunning, customizable charts and graphs. Effortlessly create complex visualizations like bar charts, line graphs, and pie charts without any coding, simply by describing what you want to see.
Infographics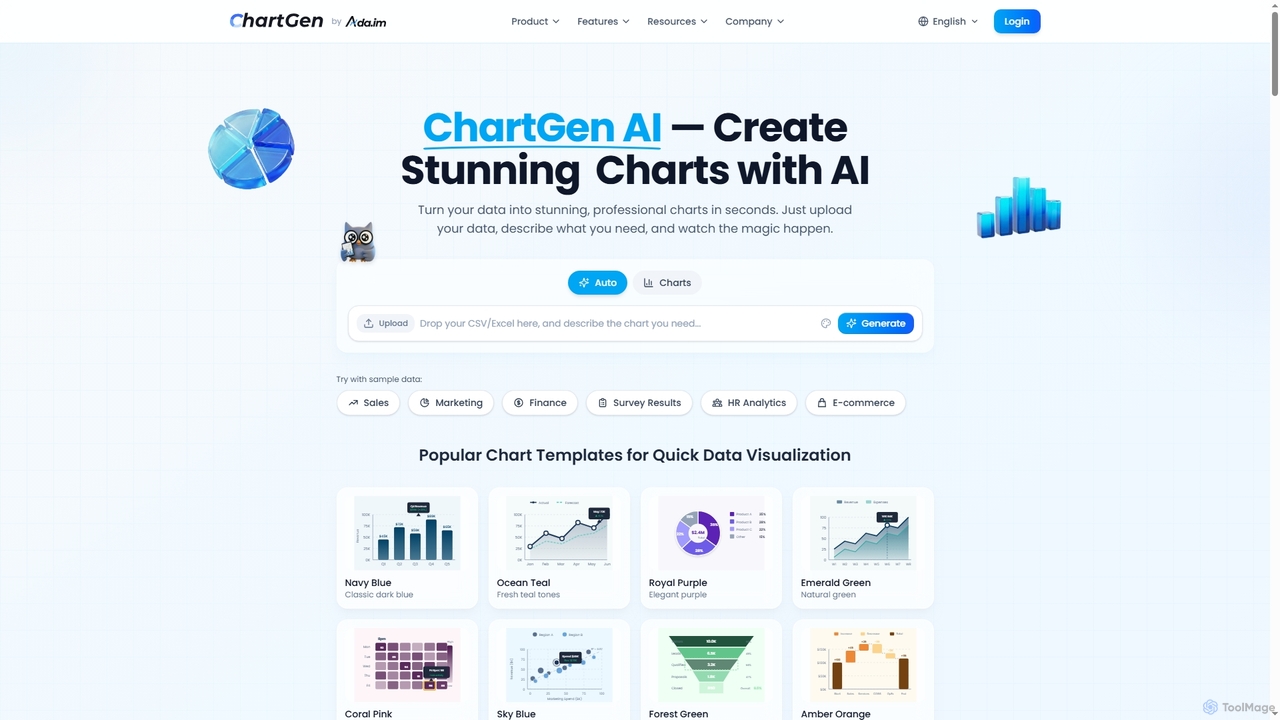
ChartGen
ChartGen is an AI-powered chart generator that transforms raw data into stunning, professional visualizations in seconds. Users simply upload CSV or Excel files, describe their desired chart in plain English, and the AI instantly creates various chart types like bar, line, and pie charts. It's designed for quick, effortless data visualization without requiring design or coding skills.
Charts & Graphs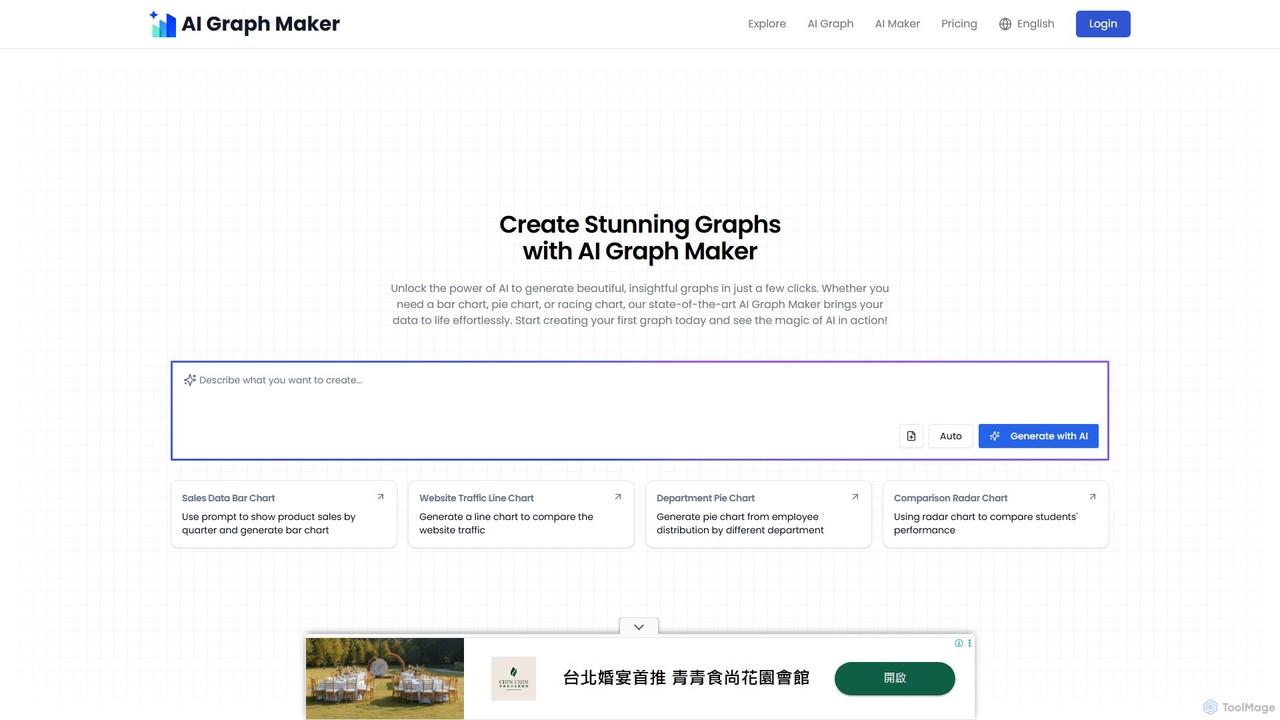
aigraphmaker
aigraphmaker is an AI-powered platform that transforms raw data and text prompts into a wide variety of professional and interactive charts and diagrams. It enables users, from beginners to experts, to effortlessly create stunning visualizations like bar charts, mind maps, flowcharts, and knowledge graphs in seconds, without any coding or design skills required.
AnalyticsLine Graph Maker Categories
Line Graph Maker Embed Widget
Copy this embed code to place the badge on your blog, article, or product site and send readers directly to this ToolMage detail page.

Related AI tools
ChartGPT
ChartGPT is an AI-powered tool that transforms natural language text prompts into a wide variety of stunning charts and graphs. Simply describe the data you want to visualize, and ChartGPT instantly generates customizable charts, making data visualization accessible to everyone, regardless of technical skill.
Business IntelligenceChartGPT
ChartGPT is an AI-powered tool that transforms natural language prompts and raw data into stunning, customizable charts and graphs. Effortlessly create complex visualizations like bar charts, line graphs, and pie charts without any coding, simply by describing what you want to see.
Infographics
ChatExcel
ChatExcel is an AI-powered data analysis tool that allows users to process spreadsheets and analyze data through a simple chat interface. It automates tasks like data cleaning, merging, and analysis, and generates over 100 types of charts and visualizations from natural language commands. No coding or complex formulas required, boosting productivity by up to 90%.
Business Intelligence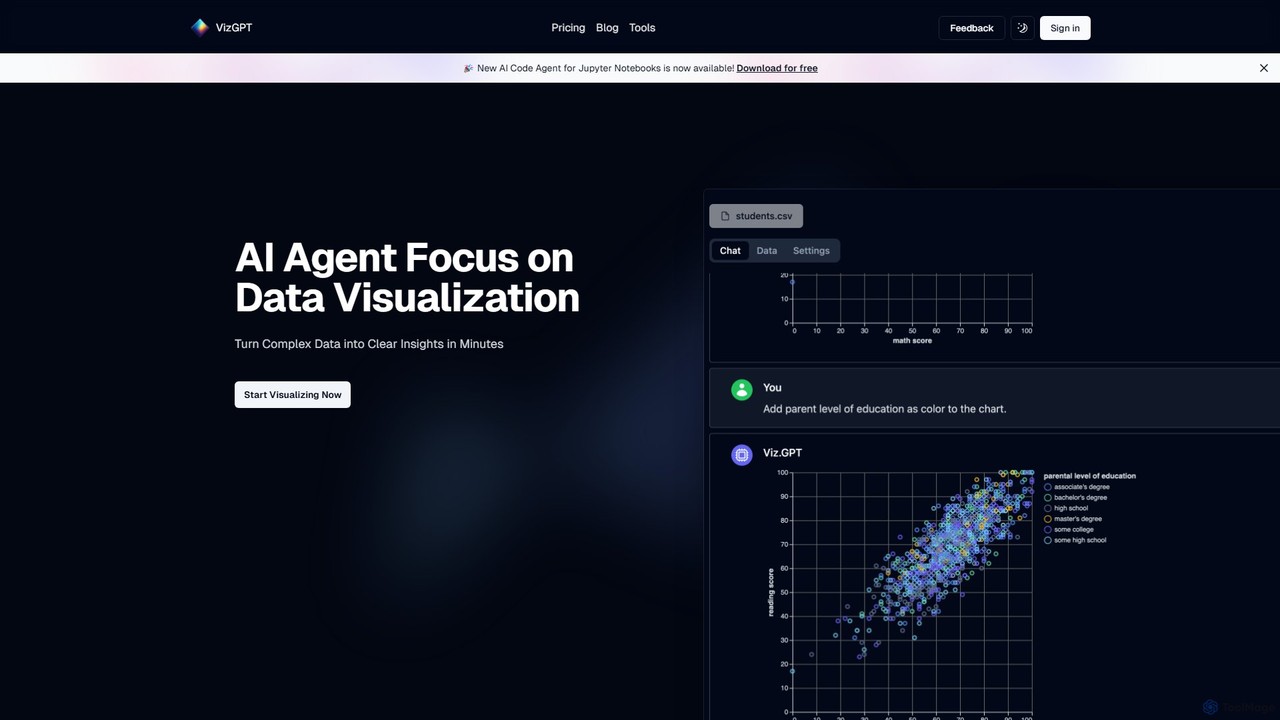
vizGPT
vizGPT is an AI-powered data visualization tool that transforms complex data into clear insights using natural language. Simply ask questions in plain English to generate charts and graphs instantly, without any coding. It supports various data sources and offers both a conversational interface and a no-code drag-and-drop editor, making data analysis accessible to everyone.
Jupyter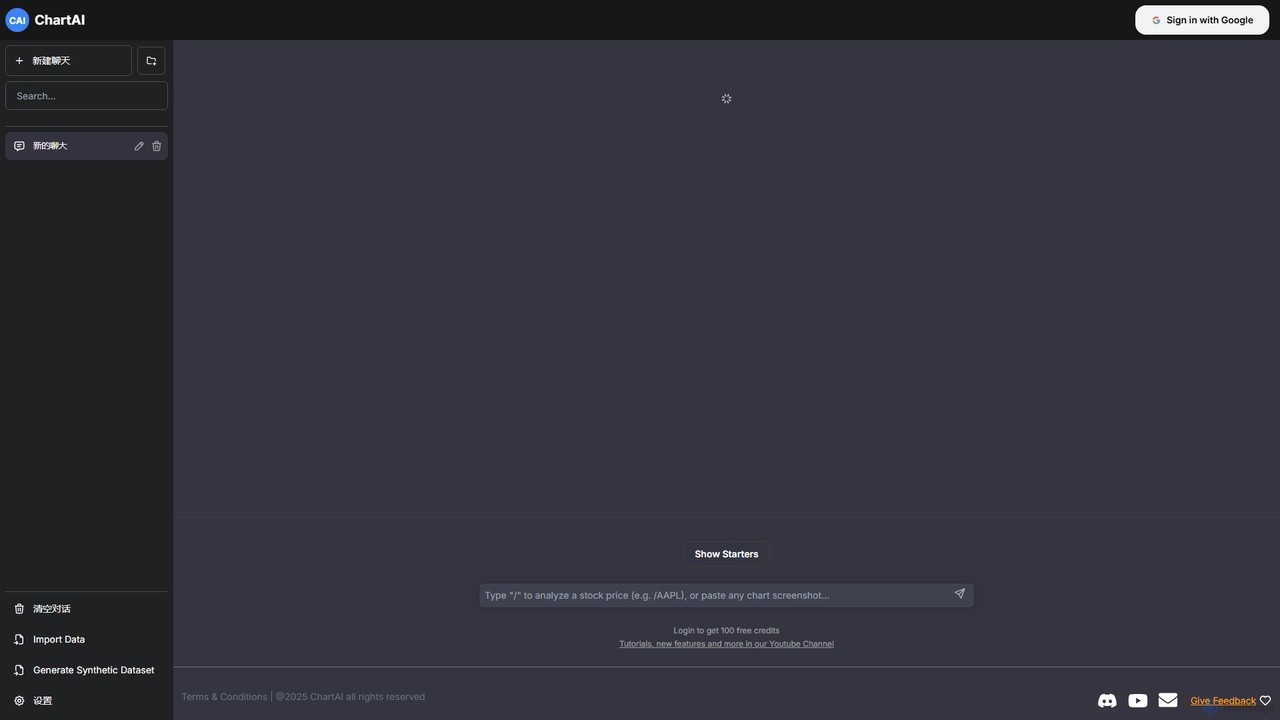
ChartAI
ChartAI is an AI-powered data visualization tool that transforms natural language prompts into stunning charts and graphs. Import your own data or generate synthetic datasets, then simply chat with the AI to analyze information and create visualizations instantly. Ideal for analysts, researchers, and anyone needing to quickly understand and present data without writing code.
Visualization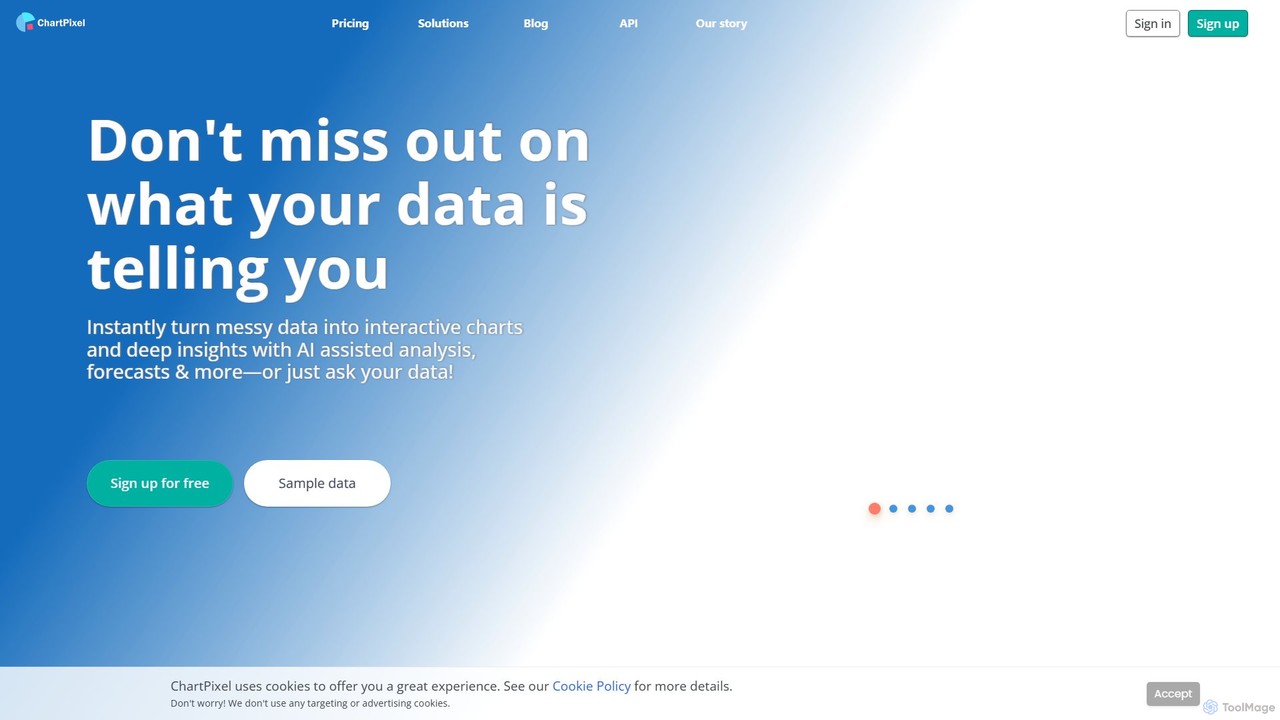
ChartPixel
ChartPixel is an AI-powered data analysis and visualization platform that instantly transforms raw, messy data into interactive charts and actionable insights. With a no-code interface, it allows users to chat with their data, generate forecasts, and uncover statistical patterns effortlessly. It's designed for everyone from students and researchers to business professionals, ensuring secure and reliable data-driven decision-making.
Business Intelligence
CalcGen AI
CalcGen AI is a no-code platform that transforms natural language prompts into interactive calculators, charts, and data visualizations. Effortlessly create custom tools for finance, science, business, and more, simply by describing what you need. Upload your data or provide parameters to generate embeddable widgets in seconds.
Calculators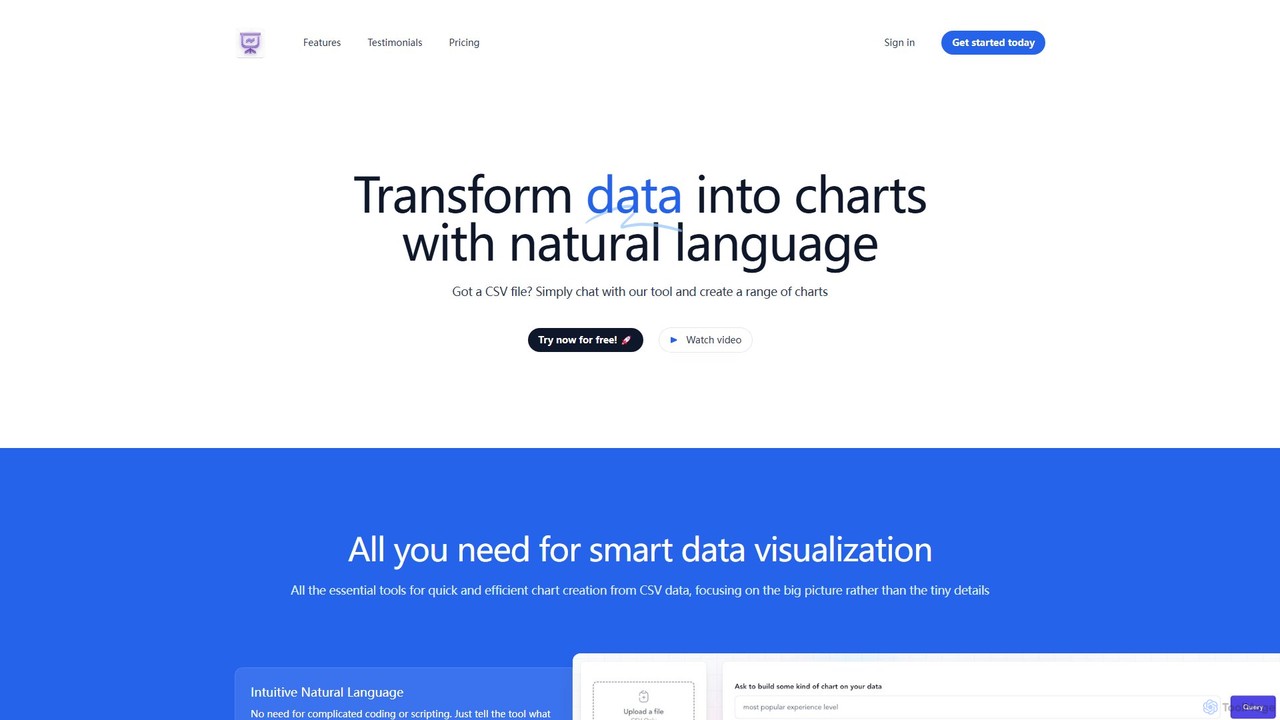
chat2csv
chat2csv is an AI-powered data visualization tool that transforms CSV files into various charts using simple, natural language commands. No coding is required. Just upload your data, chat with the AI, and instantly generate bar charts, pie charts, line graphs, and more. It's designed for quick, intuitive analysis while prioritizing user data privacy.
Business Intelligence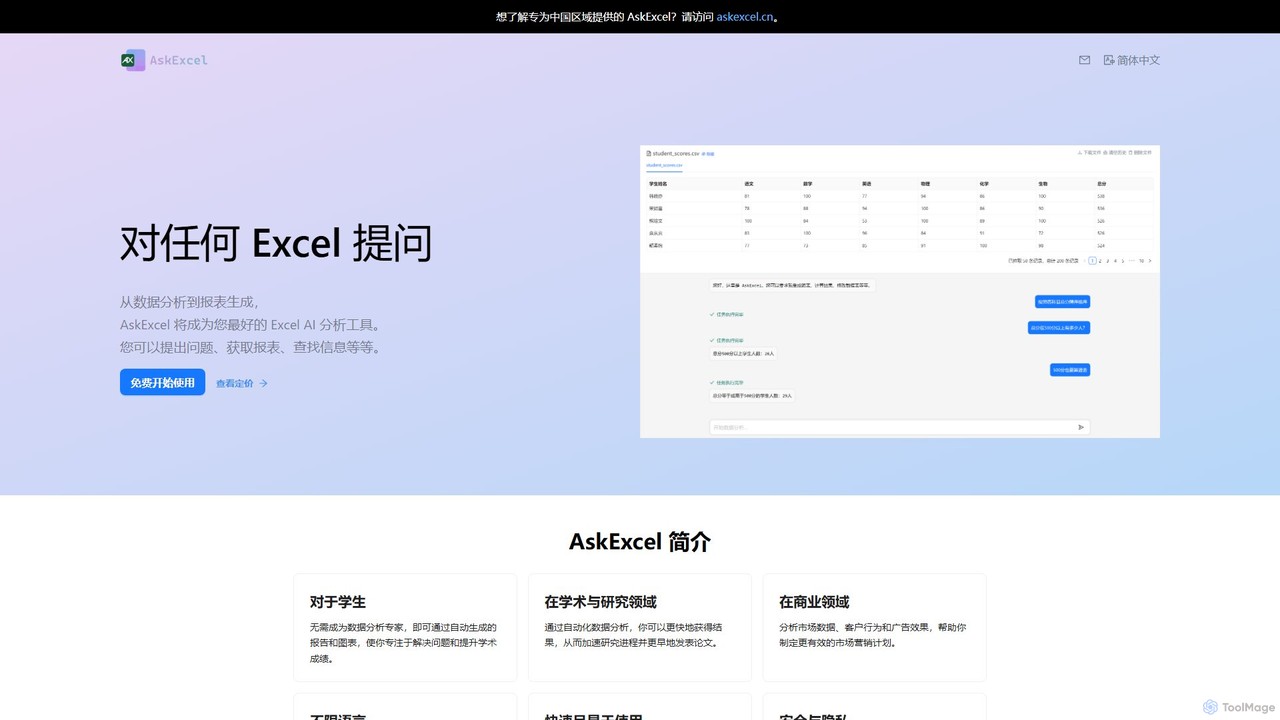
AskExcel
AskExcel is an AI-powered data analysis tool that transforms your Excel spreadsheets into interactive conversations. Simply upload your file, ask questions in natural language, and instantly receive data analysis, reports, and visualizations without writing any formulas or code.
Business Intelligence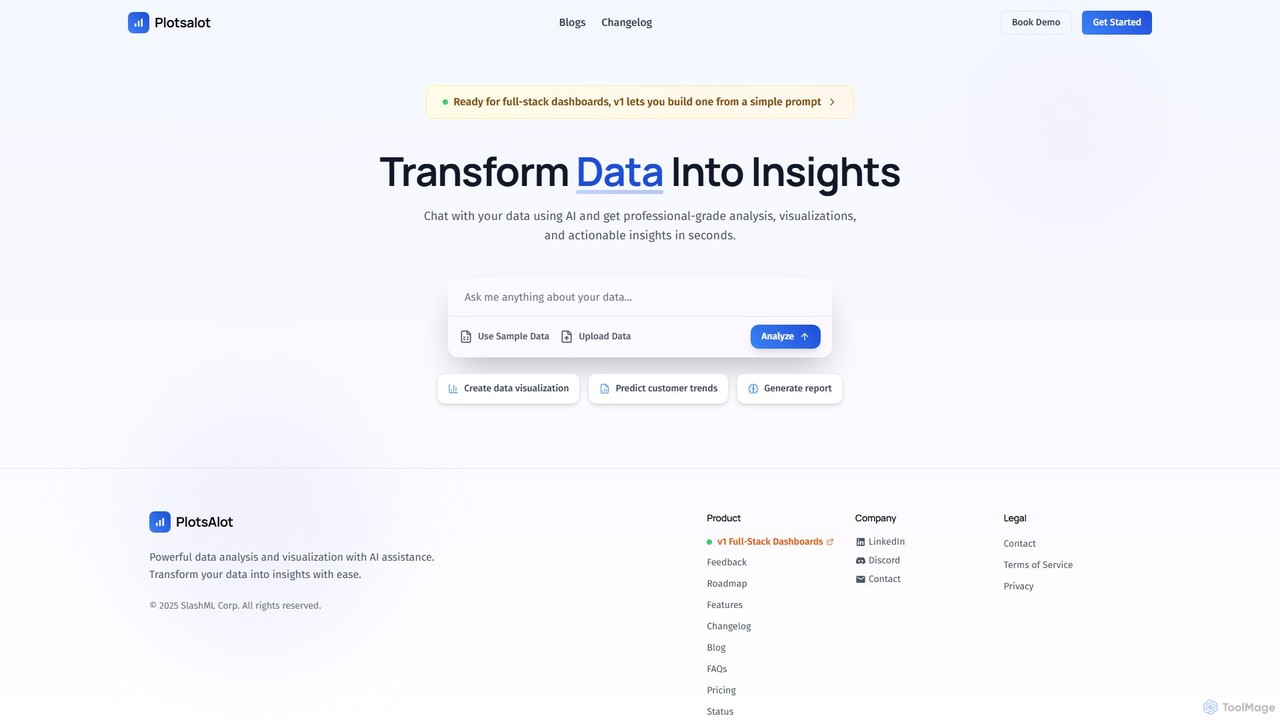
PlotsAlot
PlotsAlot is an AI-powered data analysis and visualization platform that transforms raw data into professional-grade charts, dashboards, and actionable insights. Simply upload your data and use natural language prompts to chat with it, perform advanced analysis, and predict trends in seconds.
Business Intelligence
Jyek
Jyek is an AI agent platform that understands objectives, creates execution plans, uses tools, and delivers verifiable results for complex, multi-step tasks.
Automation
DatViz AI
DatViz AI is an advanced analytics platform that uses natural language to transform complex datasets into insightful, visually appealing charts and graphs. Powered by OpenAI's LLM, it simplifies data analysis, calculates key statistics, and generates visualizations like bar charts, heatmaps, and geomaps without any coding required.
Business Intelligence
ChartFast
ChartFast is an AI-powered data analyst that transforms your data work. Upload CSV or Excel files, and it automatically cleans, analyzes, and visualizes your data. Generate complex charts and gain insights in seconds by simply asking questions, eliminating hours of manual spreadsheet tasks.
Business Intelligence
AiBiao
AiBiao is an AI-powered tool that instantly generates professional charts and diagrams from text descriptions. It streamlines the creation of visual data for presentations, reports, and online content, significantly boosting productivity by eliminating manual drawing processes.
Data Visualization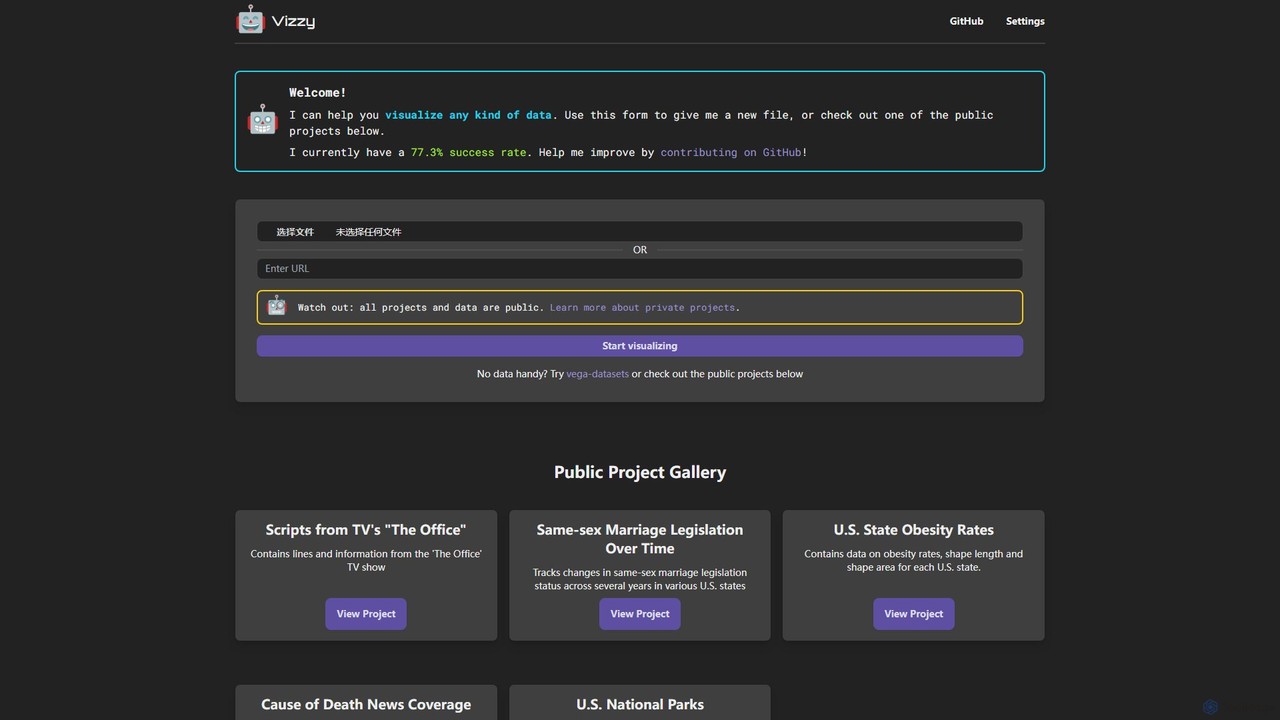
Vizzy
Vizzy is an AI-powered tool that leverages Large Language Models (LLMs) for rapid data visualization. Simply upload your data file, and Vizzy's AI will analyze it to automatically generate insightful charts, graphs, and maps. It's a no-code, open-source platform designed to make data analysis accessible to everyone, from researchers to business analysts. Explore public datasets or visualize your own, turning raw numbers into clear visuals in seconds.
Visualization
Line Graph Maker Comments (0)
Sign in to comment.
Sign inNo comments yet.