Vizzy
Visit Website
Vizzy Overview
Vizzy is an innovative, open-source platform designed to revolutionize the way we interact with data. By harnessing the power of Large Language Models (LLMs), Vizzy provides a seamless and intuitive solution for rapid data visualization. It empowers users of all technical backgrounds to transform raw data files into compelling and insightful visual representations without writing a single line of code. The core mission of Vizzy is to democratize data analysis, making it faster, more accessible, and more intuitive than ever before.
The platform operates on a simple yet powerful premise: you provide the data, and the AI handles the visualization. Whether you're a student working on a research project, a business analyst tracking KPIs, or a journalist uncovering trends, Vizzy streamlines the entire process. The tool is built with transparency and community collaboration in mind, with its source code available on GitHub, inviting developers to contribute and help improve its capabilities.
How to use Vizzy
Using Vizzy is designed to be straightforward and user-friendly. Follow these simple steps to get started:
- Upload Your Data: Navigate to the Vizzy homepage. You can upload your own data file (such as a CSV or other common formats) directly through the provided form.
- Let the AI Analyze: Once your file is uploaded, Vizzy's LLM gets to work. It automatically inspects the data's structure, identifies columns, data types, and potential relationships between them.
- Generate Visualizations: Based on its analysis, the AI suggests and generates appropriate visualizations. This could be a bar chart for categorical data, a line chart for time-series data, a scatter plot for correlations, or even a map for geographical data.
- Explore and Interact: View the generated charts and graphs. You can explore the insights presented and understand your data from a new perspective.
- Use Public Datasets: If you don't have a dataset handy, you can explore the Public Project Gallery. Vizzy offers several pre-loaded datasets, such as scripts from TV's "The Office" or U.S. National Parks data, allowing you to see the tool in action immediately.
Core Features of Vizzy
- LLM-Powered Automation: Utilizes advanced AI to automatically understand data context and generate the most suitable visualizations.
- No-Code Interface: A completely code-free experience, making data visualization accessible to non-programmers.
- Direct File Upload: Supports common data file formats, allowing for easy import of your datasets.
- Public Project Gallery: A collection of example projects that showcase the tool's capabilities and provide ready-to-explore datasets.
- Open Source: The project is available on GitHub, encouraging community contributions, transparency, and continuous improvement.
- Public Data Environment: The standard version operates with public data, making it a great tool for sharing findings and collaborating on open data projects.
- Private Project Option: Offers the possibility of private projects for users who need to work with sensitive or proprietary data.
Use Cases for Vizzy
Vizzy is a versatile tool applicable across various domains:
- Business Intelligence: Marketing teams can visualize campaign performance, while sales teams can track regional sales data to identify top-performing areas.
- Academic Research: Researchers and students can quickly explore datasets to identify trends, patterns, and outliers for their studies, such as tracking legislative changes over time or analyzing social survey data.
- Data Journalism: Journalists can upload public datasets (e.g., government statistics, survey results) to quickly generate visuals for articles and reports.
- Personal Data Analysis: Individuals can analyze their own data, from personal finance spreadsheets to fitness tracking logs, to gain personal insights.
Advantages of Vizzy
The primary advantage of Vizzy is its incredible speed and ease of use. It drastically reduces the time and technical skill required to get from a raw dataset to a meaningful visualization. Its open-source nature fosters a collaborative environment for innovation, and the no-code approach makes it an inclusive tool for a broad audience. For public data analysis, it offers a powerful, free solution.
Pricing and Plans
Vizzy operates on a freemium model:
- Free Public Plan: The core functionality of Vizzy is free to use. This plan is ideal for students, hobbyists, and professionals working with public data. All projects and data uploaded under this plan are public.
- Private Projects: For users and organizations that require data privacy, Vizzy offers an option for private projects. This is suitable for commercial use or handling sensitive information. For more details on pricing and features of private plans, users are encouraged to get in touch with the developers via the contact information on the website or GitHub page.
Vizzy Comments (0)
Log in to post comments
Log in nowVizzy Alternatives
View All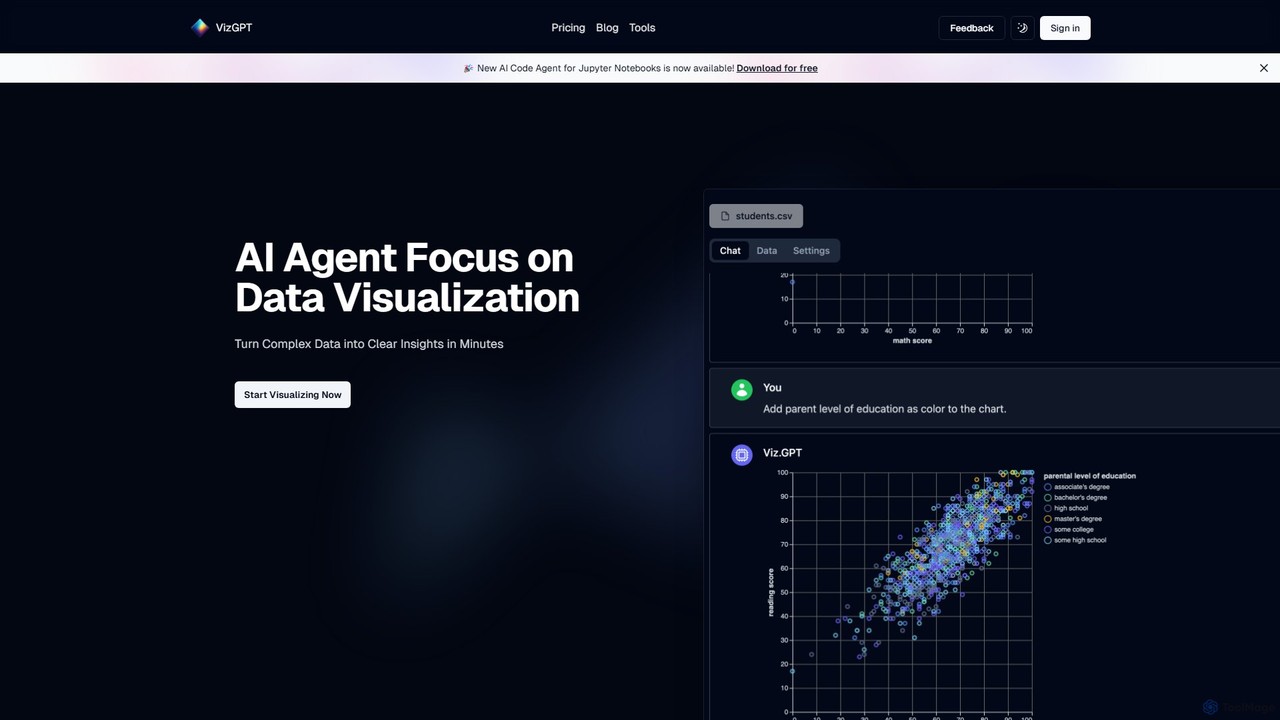
vizGPT
vizGPT is an AI-powered data visualization tool that transforms complex data into clear insights using natural language. Simply …
vizGPT is an AI-powered data visualization tool that transforms complex data into clear insights using natural language. Simply ask questions in plain English to generate charts and graphs instantly, without any coding. It supports various data sources and offers both a conversational interface and a no-code drag-and-drop editor, making data analysis accessible to everyone.
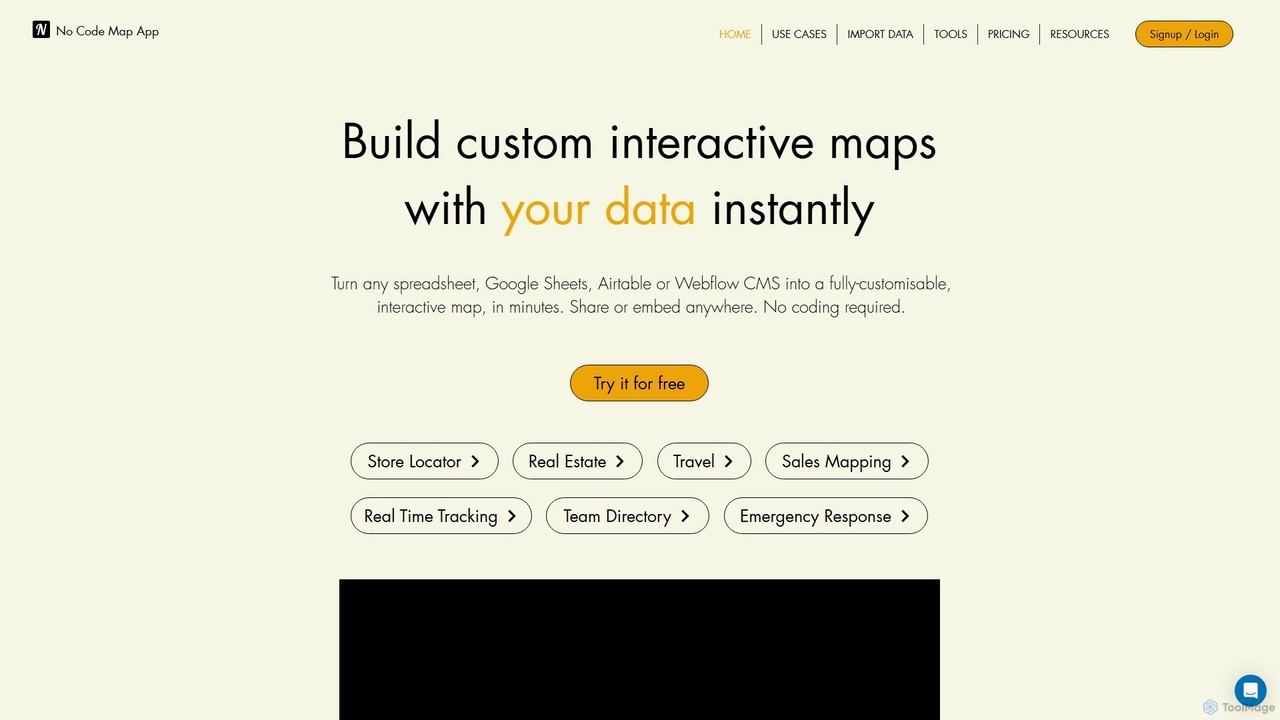
nocodemapapp
nocodemapapp is an AI-powered, no-code platform that instantly transforms data from spreadsheets, Google Sheets, Airtable, or Webflow CMS …
nocodemapapp is an AI-powered, no-code platform that instantly transforms data from spreadsheets, Google Sheets, Airtable, or Webflow CMS into fully customizable, interactive maps. Create store locators, real estate listings, or sales territory maps in minutes. Features include automatic data sync, heatmap layers, and deep design customization. Share or embed your responsive map anywhere, no coding required.
Typebot
Typebot is an open-source, no-code platform for building advanced conversational apps and chatbots. It allows users to create …
Typebot is an open-source, no-code platform for building advanced conversational apps and chatbots. It allows users to create engaging, interactive experiences for marketing, sales, and support, deploying them across websites, WhatsApp, and other platforms to boost conversions and automate communication.

Viewit Ai Chatbot
An AI-powered chatbot that transforms your data into insightful visualizations and summaries through simple, natural language conversations. Upload …
An AI-powered chatbot that transforms your data into insightful visualizations and summaries through simple, natural language conversations. Upload your dataset, ask questions, and instantly receive charts, graphs, and key metrics, making data analysis accessible to everyone without needing complex software or coding skills.
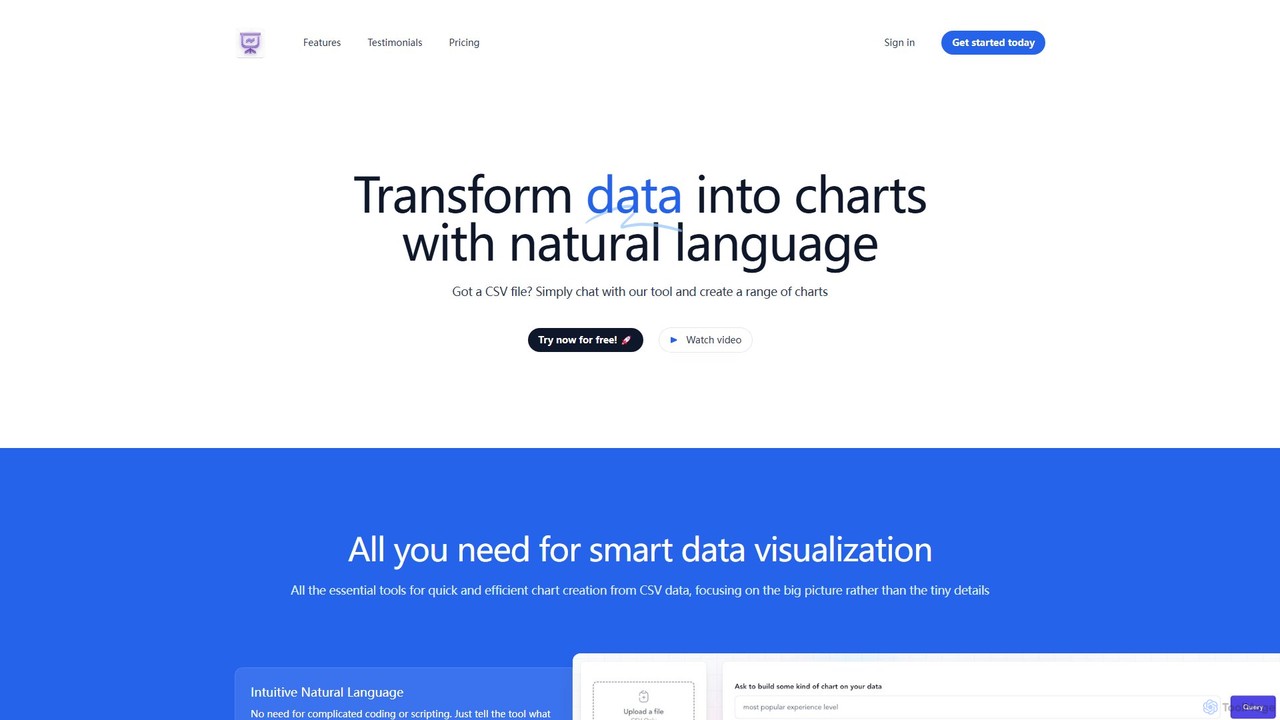
chat2csv
chat2csv is an AI-powered data visualization tool that transforms CSV files into various charts using simple, natural language …
chat2csv is an AI-powered data visualization tool that transforms CSV files into various charts using simple, natural language commands. No coding is required. Just upload your data, chat with the AI, and instantly generate bar charts, pie charts, line graphs, and more. It's designed for quick, intuitive analysis while prioritizing user data privacy.
ChartAI
ChartAI is an AI-powered data visualization tool that transforms natural language prompts into stunning charts and graphs. Import …
ChartAI is an AI-powered data visualization tool that transforms natural language prompts into stunning charts and graphs. Import your own data or generate synthetic datasets, then simply chat with the AI to analyze information and create visualizations instantly. Ideal for analysts, researchers, and anyone needing to quickly understand and present data without writing code.
Findly
Findly is an AI-powered business intelligence (BI) platform that allows users to analyze data and get insights using …
Findly is an AI-powered business intelligence (BI) platform that allows users to analyze data and get insights using natural language. It connects to various data sources, translates plain English questions into complex SQL queries, and provides interactive visualizations and reports. Designed for both technical and non-technical users, Findly simplifies data analysis, making it faster and more accessible for entire teams.
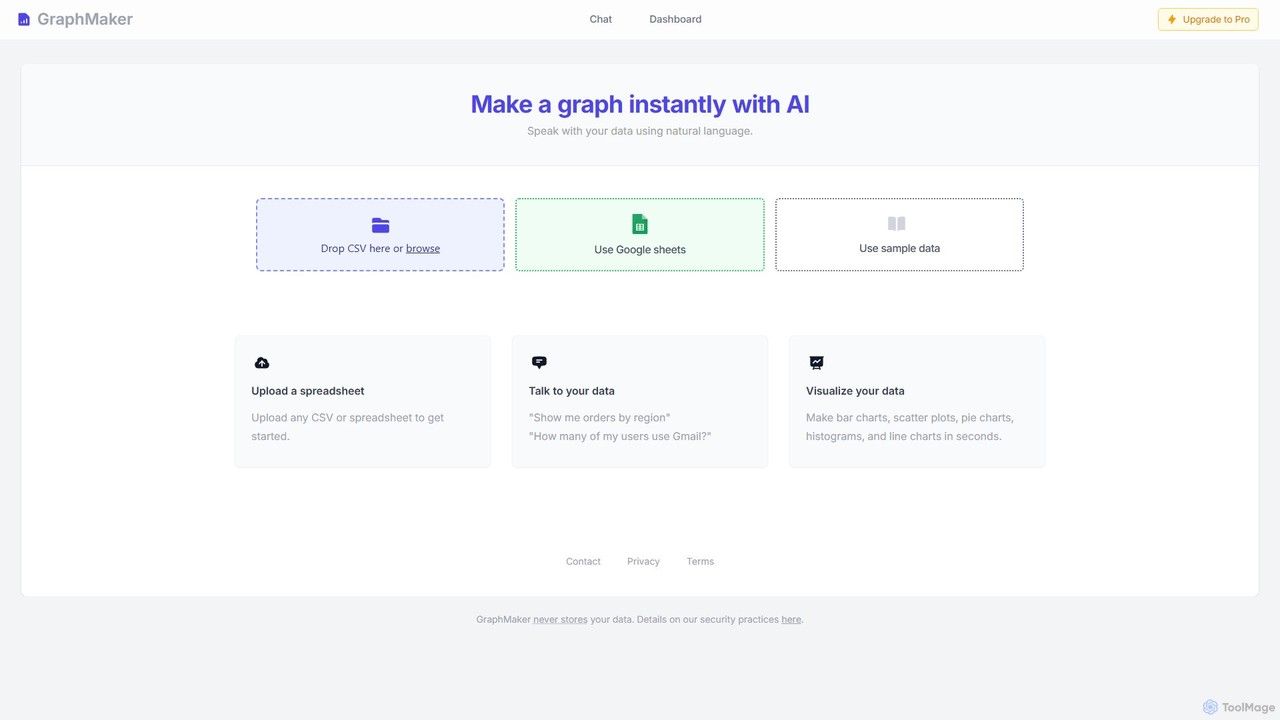
GraphMaker
GraphMaker is an AI-powered data visualization tool that allows you to create various charts and graphs in seconds. …
GraphMaker is an AI-powered data visualization tool that allows you to create various charts and graphs in seconds. Simply upload your data from a CSV file or Google Sheets, and use natural language commands to generate insightful visualizations like bar charts, pie charts, and histograms. It's designed for speed, simplicity, and security, as it never stores your data.

Feishu Base
Feishu Base is an AI-powered no-code platform that combines the flexibility of a spreadsheet with the power of …
Feishu Base is an AI-powered no-code platform that combines the flexibility of a spreadsheet with the power of a database. It enables teams to build custom business systems, automate workflows, and analyze data through intuitive dashboards without writing any code. It's designed for seamless collaboration and data management.
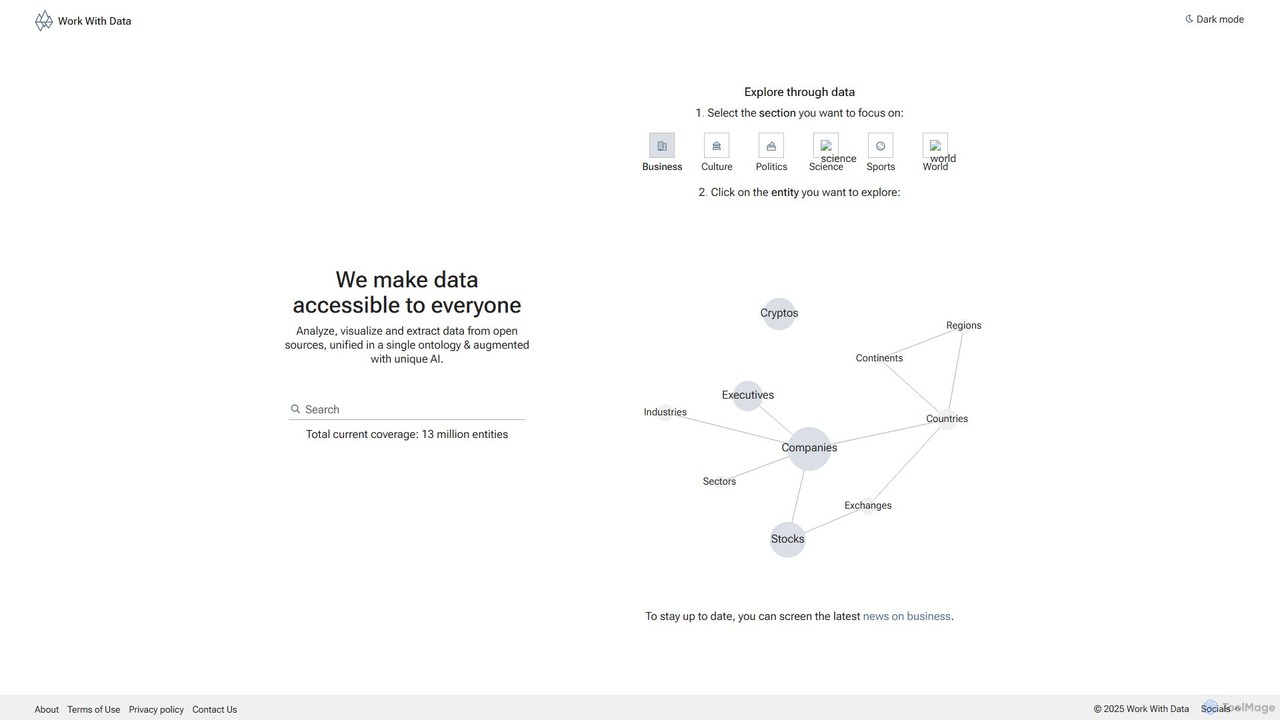
Work With Data
Work With Data is an AI-enhanced platform that makes open data accessible to everyone. It allows users to …
Work With Data is an AI-enhanced platform that makes open data accessible to everyone. It allows users to analyze, visualize, and extract data from diverse open sources, all unified in a single, easy-to-navigate ontology, augmented with unique AI for deeper insights and forecasting.
Vizzy Category
Vizzy Tag
Vizzy AI Tool Comparison
Vizzy Embed Feature
Just copy the embed code below and paste this beautiful badge on your blog, article, or official app website to drive traffic directly to this tool's detail page and quickly boost your exposure and user count!

No comments yet, be the first to comment!