rtutor
Visit Website
rtutor Overview
rtutor is a revolutionary AI-driven tool designed to democratize data analysis. It empowers users from all backgrounds, particularly those without programming skills, to interact with their data in an intuitive and conversational manner. By translating natural language queries into executable R code, rtutor bridges the gap between complex data analysis and actionable insights. This makes it an invaluable asset for business professionals, students, researchers, and anyone looking to uncover the stories hidden within their datasets without the steep learning curve of traditional programming languages like R or Python.
The platform is built on the premise that data analysis should be accessible to everyone. It provides a simple, clean interface where the user's primary interaction is through a text-based prompt. Behind the scenes, a sophisticated AI model interprets the user's intent, identifies the relevant data columns, and applies the appropriate statistical or visualization functions from the extensive R library ecosystem. The results are then presented back to the user in a clear, easy-to-understand format, such as charts, tables, or summary text.
How to use rtutor
Using rtutor is designed to be a straightforward, three-step process that removes technical barriers and accelerates the path from data to decision:
- Upload Your Data: Begin by uploading your dataset directly to the platform. rtutor supports common file formats like CSV and Excel. The interface allows you to browse your local files and select the data you wish to analyze.
- Ask Questions in Natural Language: Once your data is loaded, use the simple prompt box to ask your questions. You can ask for anything from basic summaries to complex analyses. For example, you could type "What is the average sales per region?", "Show me the correlation between ad spend and revenue", or "Create a bar chart of customer distribution by country."
- Receive Instant Insights: After submitting your query, rtutor's AI engine gets to work. It processes your request, generates and executes the necessary R code, and delivers the results in seconds. The output can be a data table, a statistical summary, or a publication-quality visualization, ready for you to interpret or include in your reports.
Core Features of rtutor
- Natural Language Processing (NLP) Interface: The core of rtutor is its ability to understand and process queries written in plain English, eliminating the need for coding.
- Automated Data Visualization: Instantly generate a wide variety of charts and graphs, including bar charts, line graphs, scatter plots, histograms, and more, simply by describing what you want to see.
- Comprehensive Statistical Analysis: Perform various statistical operations, from descriptive statistics (mean, median, standard deviation) to more advanced analyses like correlation, regression, and trend analysis.
- No-Code Workflow: Empowers non-technical users such as marketers, managers, and analysts to perform sophisticated data analysis independently.
- R Language Power: Leverages the robust and extensive statistical and graphical capabilities of the R programming language, a gold standard in data science, without requiring users to write a single line of R code.
- Interactive and Iterative Analysis: The conversational interface allows for an iterative analysis process. You can ask follow-up questions to drill down into your data and explore different facets of your dataset.
Use Cases for rtutor
rtutor is a versatile tool applicable across numerous industries and roles:
- Business Intelligence: Marketing managers can analyze campaign effectiveness, sales teams can track performance against targets, and executives can get high-level overviews of business health.
- Academic Research: Students and researchers can quickly explore datasets, test hypotheses, and generate visualizations for their papers and presentations without getting bogged down in complex software.
- Financial Analysis: Financial analysts can use rtutor to identify trends in market data, analyze investment portfolios, and create reports for stakeholders.
- Operations Management: Operations managers can analyze supply chain data, monitor inventory levels, and identify bottlenecks in their processes.
Advantages of rtutor
rtutor offers significant advantages over traditional data analysis methods:
- Accessibility: It breaks down the barriers to data science, making powerful analytical tools available to a much broader audience.
- Speed and Efficiency: Get answers in seconds, not hours. It dramatically accelerates the data analysis workflow by automating the coding and visualization process.
- Ease of Use: The intuitive, chat-like interface requires minimal training to use effectively.
- Cost-Effective: Reduces the need to hire specialized data scientists or invest in extensive training for existing staff for many common analysis tasks.
- Reliability: By using the well-established R language in the backend, the analyses are based on trusted and validated statistical methods.
Pricing and Plans
rtutor likely operates on a freemium model. This typically includes a free plan with basic features and certain limitations (e.g., number of queries per month, maximum file size) suitable for students or individual users with small-scale needs. For professional and enterprise use, paid subscription plans would offer higher limits, advanced features, priority support, and potentially team collaboration capabilities. For the most accurate and up-to-date pricing information, it is recommended to visit the official rtutor website.
rtutor Comments (0)
Log in to post comments
Log in nowrtutorWebsite Traffic Analysis
Latest Traffic
Status
Monthly Traffic Trend
Geography
Top 5 Countries/Regions
-
🇺🇸 United States70.10%
-
🇻🇳 Vietnam19.06%
-
🇨🇦 Canada5.97%
-
🇮🇳 India2.56%
-
🇫🇷 France2.31%
Traffic source
| Source Type | Percentage |
|---|---|
|
Referral
|
60.11% |
|
Direct Access
|
39.89% |
Popular Keywords
| Keyword | Cost Per Click |
|---|---|
|
$0.00
|
|
|
$0.34
|
|
|
$0.00
|
|
|
$0.00
|
|
|
$0.00
|
rtutor Alternatives
View All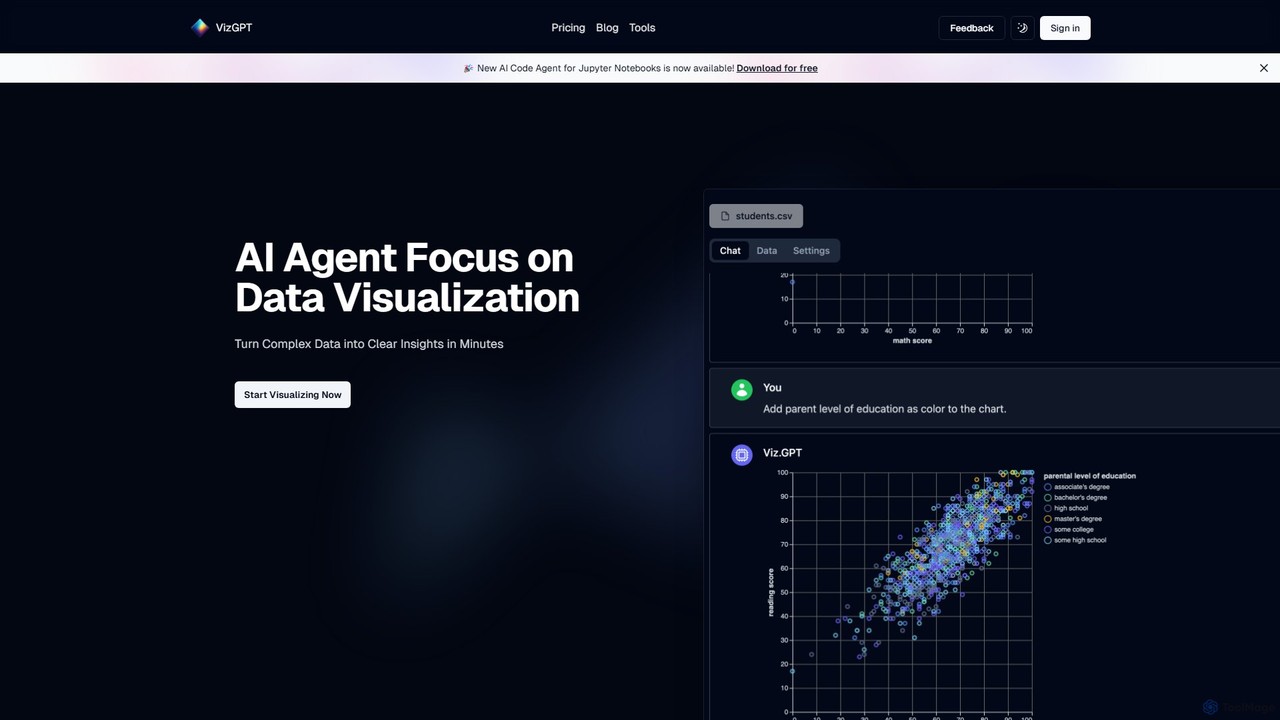
vizGPT
vizGPT is an AI-powered data visualization tool that transforms complex data into clear insights using natural language. Simply …
vizGPT is an AI-powered data visualization tool that transforms complex data into clear insights using natural language. Simply ask questions in plain English to generate charts and graphs instantly, without any coding. It supports various data sources and offers both a conversational interface and a no-code drag-and-drop editor, making data analysis accessible to everyone.
Findly
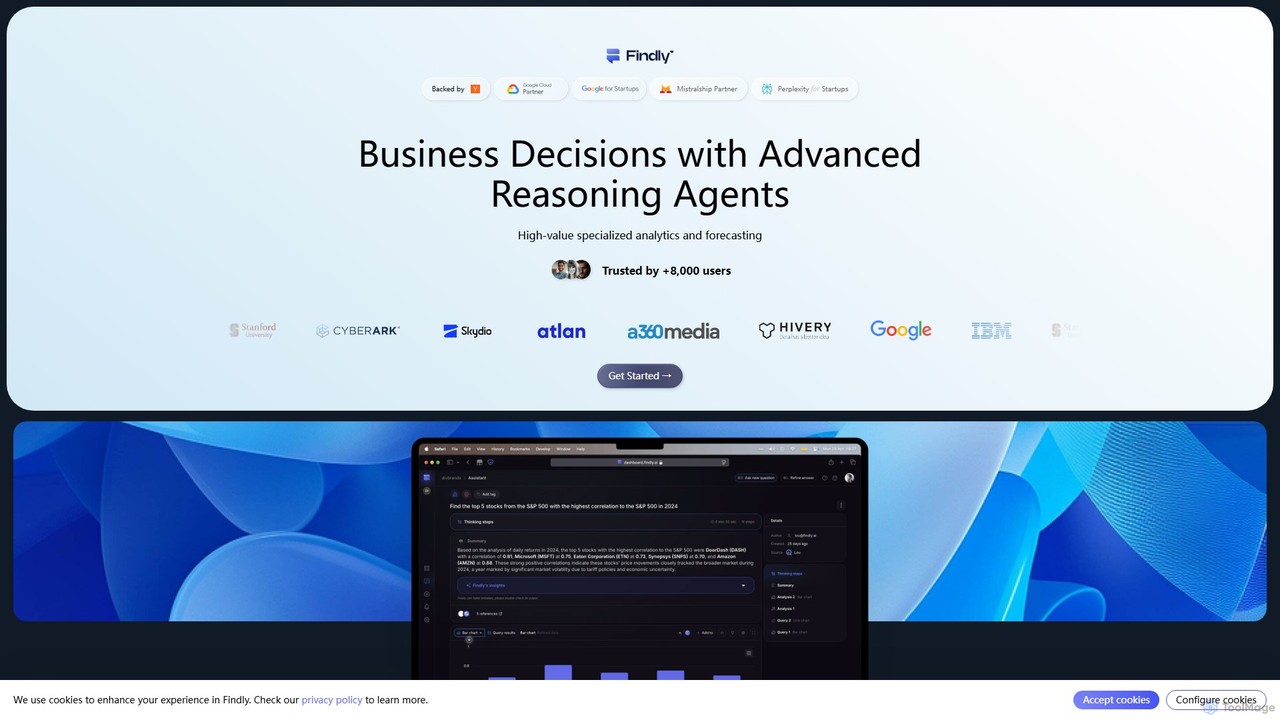
Findly is an AI-powered business intelligence (BI) platform that allows users to analyze data and get insights using …
Findly is an AI-powered business intelligence (BI) platform that allows users to analyze data and get insights using natural language. It connects to various data sources, translates plain English questions into complex SQL queries, and provides interactive visualizations and reports. Designed for both technical and non-technical users, Findly simplifies data analysis, making it faster and more accessible for entire teams.
Vizzy
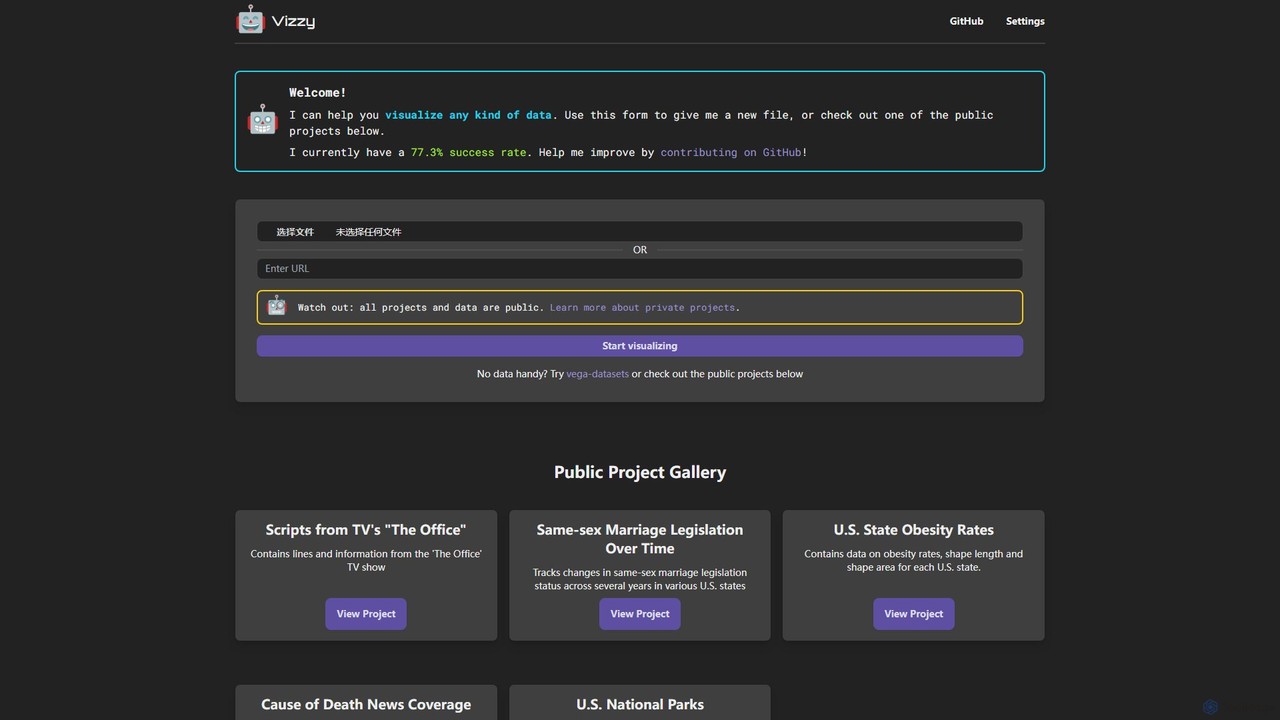
Vizzy is an AI-powered tool that leverages Large Language Models (LLMs) for rapid data visualization. Simply upload your …
Vizzy is an AI-powered tool that leverages Large Language Models (LLMs) for rapid data visualization. Simply upload your data file, and Vizzy's AI will analyze it to automatically generate insightful charts, graphs, and maps. It's a no-code, open-source platform designed to make data analysis accessible to everyone, from researchers to business analysts. Explore public datasets or visualize your own, turning raw numbers into clear visuals in seconds.
Brewit
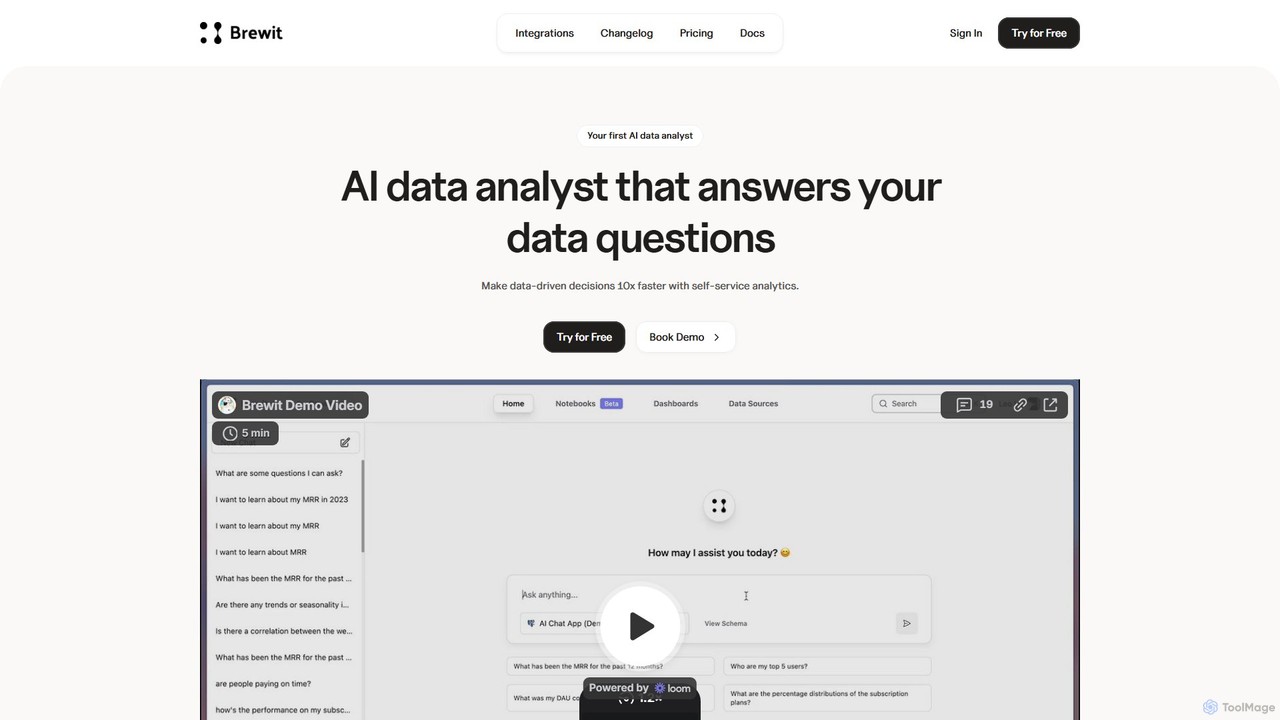
Brewit is an AI-powered analytics platform that enables users to perform self-service data analysis. Connect to your databases, …
Brewit is an AI-powered analytics platform that enables users to perform self-service data analysis. Connect to your databases, chat in natural language to query data, generate SQL, and create interactive visualizations and reports. It simplifies business intelligence, making data accessible to everyone in the organization, regardless of their technical skills.
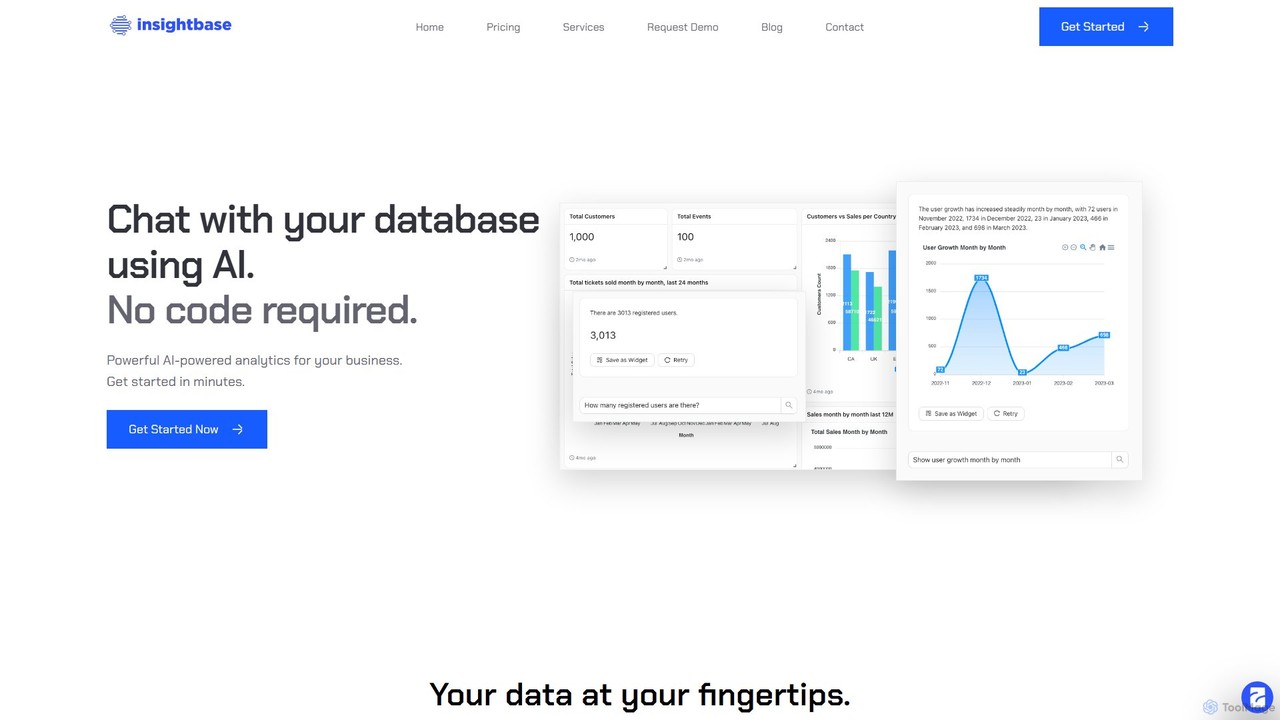
InsightBase
InsightBase is an AI-powered business intelligence platform that allows you to chat with your database using natural language. …
InsightBase is an AI-powered business intelligence platform that allows you to chat with your database using natural language. It empowers both non-technical and technical users to build dashboards, generate reports, and gain data-driven insights in minutes, without needing to write complex SQL queries.
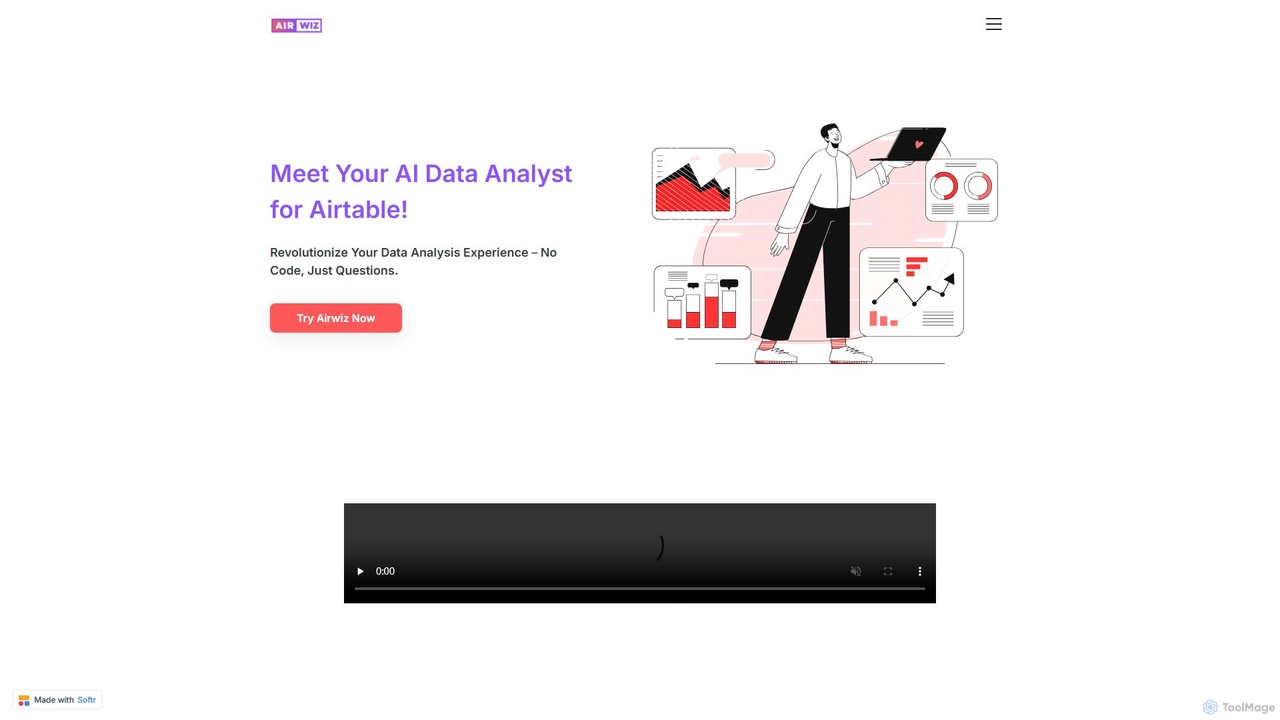
airwiz
Airwiz is an AI-powered data analyst designed specifically for Airtable. It allows users to ask complex questions about …
Airwiz is an AI-powered data analyst designed specifically for Airtable. It allows users to ask complex questions about their data in plain English and receive instant, actionable insights. With seamless integration and no coding required, Airwiz democratizes data analysis, enabling teams in product, finance, and operations to make faster, data-driven decisions directly from their Airtable bases.
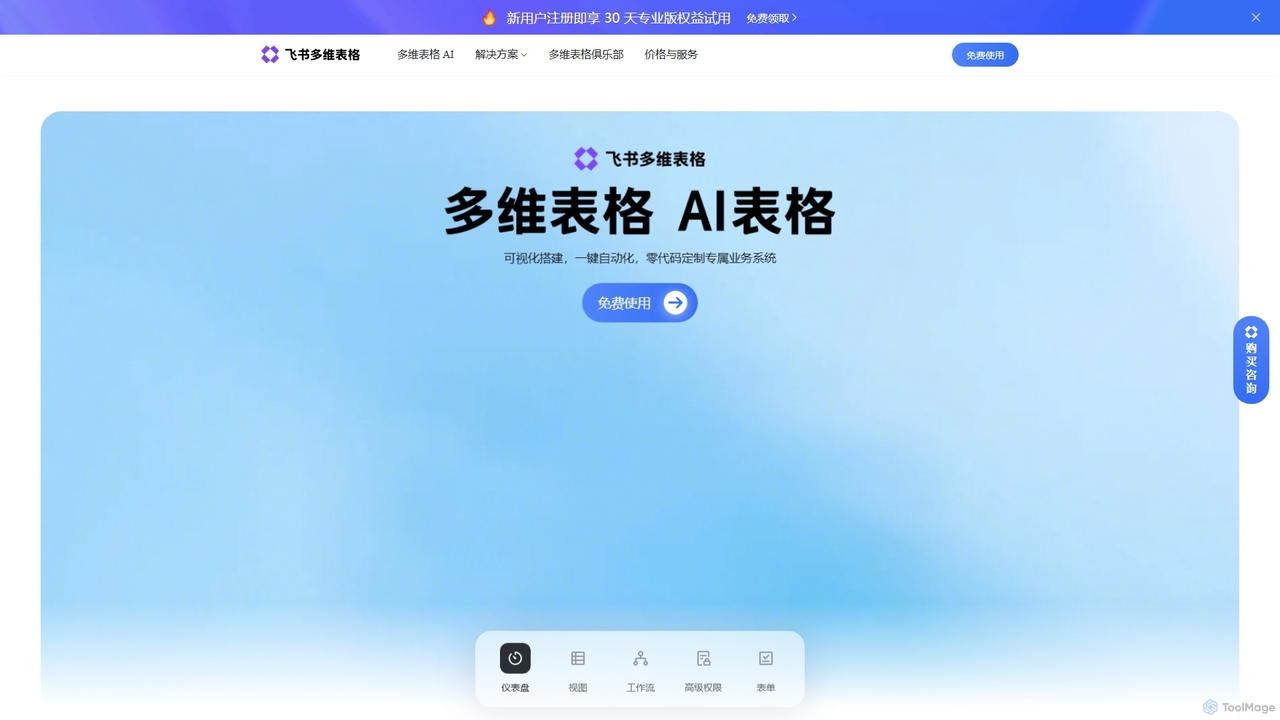
Feishu Base
Feishu Base is an AI-powered no-code platform that combines the flexibility of a spreadsheet with the power of …
Feishu Base is an AI-powered no-code platform that combines the flexibility of a spreadsheet with the power of a database. It enables teams to build custom business systems, automate workflows, and analyze data through intuitive dashboards without writing any code. It's designed for seamless collaboration and data management.
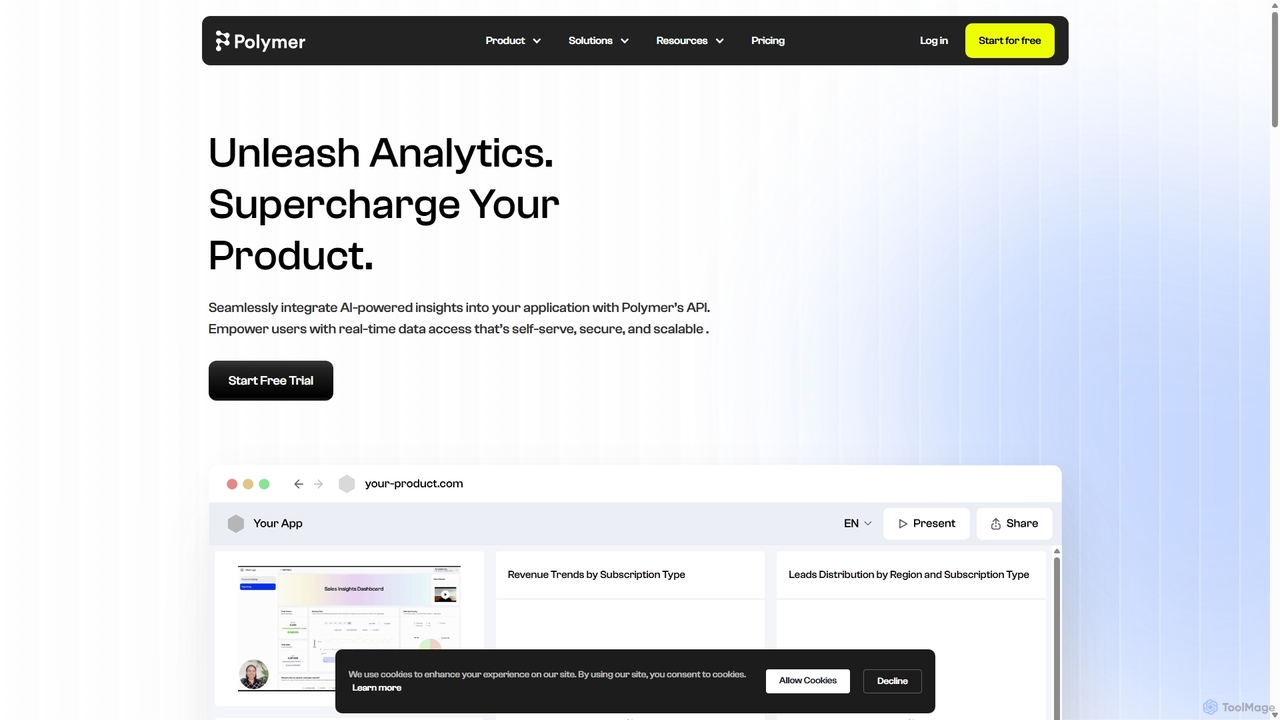
Polymer Search
Polymer Search is an AI-driven embedded analytics platform designed to supercharge products with powerful, white-labeled data visualizations. It …
Polymer Search is an AI-driven embedded analytics platform designed to supercharge products with powerful, white-labeled data visualizations. It enables seamless integration of beautiful dashboards and reports directly into your application, empowering users with self-serve analytics and AI-generated insights, all with minimal development effort.

OpenDoc AI
OpenDoc AI is a next-generation, no-code AI platform that empowers users to automate data workflows, generate business insights, …
OpenDoc AI is a next-generation, no-code AI platform that empowers users to automate data workflows, generate business insights, and build custom AI models using simple natural language prompts. It connects to various data sources, making data science accessible to everyone, regardless of technical expertise.
Analyzr
Analyzr is a no-code predictive analytics platform that empowers businesses to build custom machine learning models. It simplifies …
Analyzr is a no-code predictive analytics platform that empowers businesses to build custom machine learning models. It simplifies data analysis, enabling users to uncover insights for customer clustering, propensity scoring, and forecasting without requiring engineering expertise.
rtutor Tag
rtutor AI Tool Comparison
rtutor Embed Feature
Just copy the embed code below and paste this beautiful badge on your blog, article, or official app website to drive traffic directly to this tool's detail page and quickly boost your exposure and user count!

No comments yet, be the first to comment!